Watch Levels for next trend confirmations amid escalating Israel-Hamas war
Technical Analysis,Research &
Weekly Outlook(Oct 23 to Oct 27,2023)
Nifty-EOD Chart Analysis
(Waves structure)
Nifty-EOD Chart (20-Oct-2023):-

Technical Patterns and Formations in EOD charts
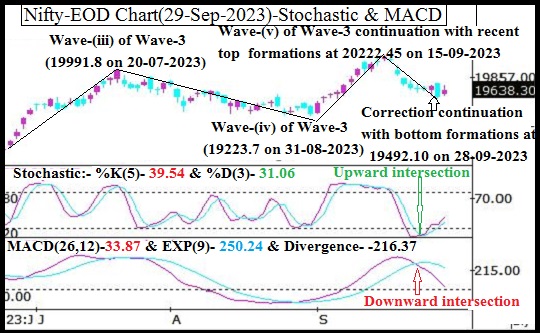
1- Corrective Wave-(ii) of Wave-3 completion at 16828.3 on 20-03-2023 and Impulsive Wave-(iii) of Wave-3 beginning
2- Impulsive Wave-(iii) of Wave-3 completion at 19991.8 on 20-07-2023.
3- Corrective Wave-(iv) of Wave-3 completion at at 19223.7 on 31-08-2023.
4- Impulsive Wave-(v) of Wave-3 continuation with recent and life time top formations at 20222.45 on 15-09-2023 but Short Term correction beginning from this level.
5- Short Term correction continuation with recent bottom formations at 19333.60 on 04-10-2023.
6- Last 20 sessions sideways trading between 19333-19849
Conclusions from EOD chart analysis
(Waves structure)
Now impulsive Wave-(v) of Wave-3 continuation with recent and life time top formations at 20222.45 on 15-09-2023 and no confirmation of its completion yet on EOD Charts therefore possibility of Nifty moving above life time top(20222.45) can not be ruled out after on going Short Term Correction completion.
At present Short Term correction is in continuation but Nifty has turned sideways between 19333-19849 for the last 20 sessions and finally sustaining beyond this range will confirm the life and length of on going correction which should be firstly watched in the coming week/weeks for deeper correction beginning confirmations below 19333 or fresh up moves beginning confirmations towards and above life time top above 19849.
Nifty-EOD Chart Analysis
(Stochastic & MACD)
Nifty-EOD Chart (20-Oct-2023):-

Technical Patterns and Formations in EOD charts
1- Stochastic- %K(5) line has intersected %D(3) line downward and its both lines are falling within and towards Over sold zone.
2- Stochastic:- %K(5)- 19.66 & %D(3)- 38.87.
3- In MACD- MACD line has intersected Average line upward and its both lines are rising in positive and negative zone.
4- MACD(26,12)- 7.32 & EXP(9)- -94.62 & Divergence- 101.94
Conclusions from EOD chart analysis
(Stochastic & MACD)
Positions of Daily indicators are as follows:-
1- As in Stochastic its %K(5) line has intersected %D(3) line downward and its both lines are falling within and towards Over sold zone therefore some more down moves can not be ruled out in the coming week. Let upward intersection happen then fresh up moves will be seen.
2- As in MACD indicator its MACD line has intersected Average line upward and its both lines are rising in positive and negative zone therefore first signal of upward trend formation has been generated. Let its Average line to move into positive zone then decisive up moves will be seen after upward trend formation confirmations.
Nifty-EOD Chart Analysis
(Averages)
Nifty-EOD Chart (20-Oct-2023):-

Technical Patterns and Formations in EOD charts
Averages:-
1- 5-Day SMA is today at 19676
2- 21-Day SMA is today at 19654
3- 55-Day SMA is today at 19613
4- 100-Day SMA is today at 19402
5- 200-Day SMA is today at 18594
Conclusions from EOD chart analysis
(Averages)
Nifty is hovering around near about Short and Intermediate term trend deciding Averages(5,21 & 55-Day SMAs). Intermediate term trend decider 55-Day SMA has turned flat while Short term trend decider 5 & 21-Day SMAs have started to move downward therefore clearly showing Short term trend turning downward signals.
As Nifty has closed below all the Short and Intermediate term deciding averagess(5,21 & 55-Day SMAs)) last Friday therefore generated stronger signals of Intermediate term trend turning down hence firrsly sustaining beyond its decider 55-Day SMA(today at 19613) should be watched in the coming week for deeper correction beginning or on going correction confirmations.
Nifty-Last 20 Sessions
intraday charts analysis
Nifty-Intra Day Chart (Oct 01 & Oct 01,2023):-

Technical Patterns formation in last 20 Sessions intraday charts
1- Selling(Resistances) in last 20 Sessions are as follows:-
A- 19519-19593
B- 19628-19681
C- 19685-19724
D- 19819-19845
2- Consolidation(Supports) in last 20 Sessions are as follows:-
A- 19488-19540
B- 19343-19374
3- Sideways trading in last 20 Sessions are between 19333-19849
Conclusions from 20 Sessions
intra day chart analysis
Last 20 Sessions sideways trading between 19333-19849 with above mentioned supports and resistances. As resistances seems stronger than supports and intraday selling was seen last Friday also therefore firstly down moves are expected towards above mentioned supports in the beginning of next week.
Firstly sustaining beyond last 20 sessions lowest(19333) should be watched in next week because sustaining below it will mean break down confirmation of more than 20 sessions like bigger trading range and resultant deeper correction beginning confirmations.
Nifty-Intra Day Chart Analysis
(20-Oct-2023)
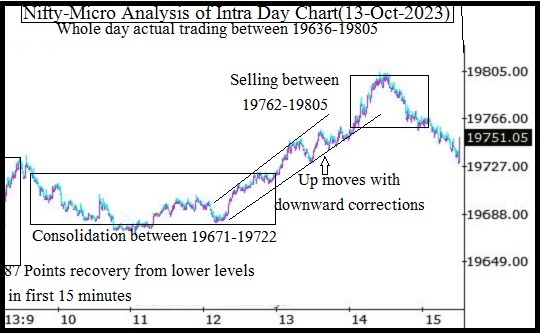
Nifty-Intra Day Chart (20-Oct-2023):-

Technical Patterns formation in today intraday charts
1- 50 Points up in first 18 minutes after weaker opening.
2- Whole day trading with selling patterns formation between 19519-19593
3- Whole day actual trading between 19519-19593
Conclusions from intra day chart analysis
Although firstly 50 points up moves in first 18 minutes after weaker opening but whole day trading was seen with selling patterns formation between 19519-19593 therefore down moves are expected below last Friday lowest(19519) in the beginning of next week.
Conclusions (After putting all studies together)
1- Long Term trend is up.
2- Intermediate Term trend is at stake.
3- Short Term trend is down.
Middle east crisis led Geo-political uncertainty and resultant Crude Price risen also in international markets therefore all the Global markets closed in red and many markets closed more than 1% down last Friday therefore Indian markets also remained subdued.
Short Term Correction which begun from life time top(20222.45) is very much on and no indication of its completion yet on EOD charts. As last 20 Sessions like bigger period sideways trading near the bottom of on going correction between 19333-19849 therefore finally sustaining beyond this range will confirm the life and length of on going correction which should be firstly watched in the coming week/weeks for its confirmations.
Short Term trend is confirm down and Short Term indicators are showing some more down moves possibility as well as intraday charts of last Friday are showing selling patterns formations therefore some more down moves will be seen towards above mentioned supports in the beginning of next week and sustaining beyond last 20 sessions lowest(19333) should be finally watched in next week for correction completion or deeper correction beginning confirmations.
Firstly following levels should be watched in next week during on going correction because next trend will get confirmations according to Israel-Hamas war escalation/de-escalation:-
1- Above mentioned next 2 supports ranges.
2- Sustaining beyond Intermediate Term trend decider 55-Day SMA which is today at 19613 because it will decide next 3 weeks to 3 months one sided moves.
3- Last 20 Sessions lowest(19333) for the life and length of on going correction.