Watch levels amid Israel-Hamas
war led Geo political tension
Technical Analysis,Research &
Weekly Outlook(Oct 16 to Oct 20,2023)
Nifty-EOD Chart Analysis
(Waves structure)
Nifty-EOD Chart (13-Oct-2023):-
Technical Patterns and Formations in EOD charts
1- Corrective Wave-C of "ABC correction" completion at 15183.4 on 17-06-2022 and Impulsive Wave-1 of new Waves structure beginning.
2- Impulsive Wave-1 completion at 18096.2 on 15-09-2022.
3- Corrective Wave-2 completion at 16747.7 on 30-09-2022.
4- Impulsive Wave-(i) of Wave-3 completion at 18887.6 on 01-12-2022.
5- Corrective Wave-(ii) of Wave-3 completion at 16828.3 on 20-03-2023.
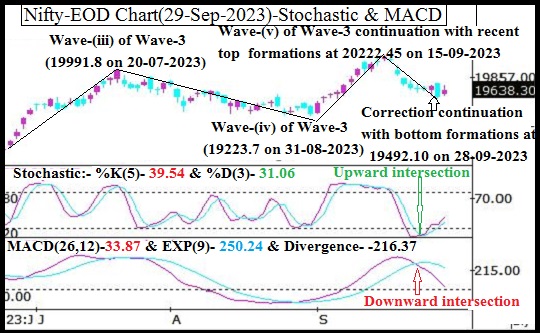
6- Impulsive Wave-(iii) of Wave-3 completion at 19991.8 on 20-07-2023.
7- Corrective Wave-(iv) of Wave-3 completion at at 19223.7 on 31-08-2023.
8- Impulsive Wave-(v) of Wave-3 continuation with recent and life time top formations at 20222.45 on 15-09-2023 but Short Term correction beginning from this level.
9- Short Term correction continuation with recent bottom formations at 19333.60 on 04-10-2023.
10- Last 15 sessions sideways trading between 19333-19843
Conclusions from EOD chart analysis
(Waves structure)
Corrective Wave-C of "ABC correction" of previous Waves structure completed at 15183.4 on 17-06-2022 and Impulsive Wave-1 of new Waves structure started. Its Wave-1 and other waves completed as per above given levels and dates.
Now impulsive Wave-(v) of Wave-3 continuation with recent and life time top formations at 20222.45 on 15-09-2023 but Short Term correction begun from this level which is in continuation with recent bottom formations at 19333.60 on 04-10-2023 and no confirmation of its completion yet on EOD charts. Last 15 sessions sideways trading between 19333-19843 and finally sustaining beyond this range will confirm the life and length of on going correction therefore it should be finally watched in the coming week/weeks.
Nifty-EOD Chart Analysis
(Stochastic & MACD)
Nifty-EOD Chart (13-Oct-2023):-
Technical Patterns and Formations in EOD charts
1- Stochastic- Stochastic- Its both lines %K(5) & %D(3) are kissing in the Over bought zone.
2- Stochastic:- %K(5)- 84.41 & %D(3)- 84.64.
3- In MACD- Its both lines are kissing in the negative zone.
4- MACD(26,12)- -137.75 & EXP(9)- -135.10 & Divergence- -2.65.
Conclusions from EOD chart analysis
(Stochastic & MACD)
Positions of Daily indicators are as follows:-
1- As in Stochastic its both lines are kissing in the Over bought zone therefore showing first signal of Short term correction beginning. Let clear downward intersection happen then Short term correction will be seen and till then up moves will be considered because some times it remains in Kising mode for longer periods.
2- As in MACD indicator its both lines are kissing in the negative zone therefore this indicator is suggesting to adopt wait and watchful approach for final confirmations of next trend formation which will be according to its Upward or Downward intersection by MACD line.
Nifty-EOD Chart Analysis
(Averages)
Nifty-EOD Chart (13-Oct-2023):-
Technical Patterns and Formations in EOD charts
Averages:-
1- 5-Day SMA is today at 19711
2- 21-Day SMA is today at 19750
3- 55-Day SMA is today at 19616
4- 100-Day SMA is today at 19338
5- 200-Day SMA is today at 18553
Conclusions from EOD chart analysis
(Averages)
Long Term Trend is up because Nifty is well above its decider 200-Day SMA but Intermediate and Short Term Term Trends are at stake because Nifty hovered around its deciders 21-Day SMA and 55-Day SMA in previous week therefore firstly sustaining beyond these 2 Averages should be watched coming week/weeks for next Trend formation confirmations.
Nifty-Last 15 Sessions
intraday charts analysis
Nifty-Intra Day Chart (Sept 22 to Oct 13,2023):-
Technical Patterns formation in last 15 Sessions intraday charts
1- Selling(Resistances) in last 15 Sessions are as follows:-
A- 19762-19836
2- Consolidation(Supports) in last 15 Sessions are as follows:-
A- 19636-19722
B- 19589-19623
C- 19488-19540
D- 19343-19774
3- Last 15 Sessions sideways trading between 19333-19843
Conclusions from 15 Sessions
intra day chart analysis
Last 15 Sessions sideways trading between 19333-19843 with lower levels above mentioned multiple supports and higher levels only one resistance therefore firstly sustaining beyond above mentioned resistance should be watched in the coming week for on going rally continuation confirmations. As Geo Political tension therefore if Nifty fails to sustaining above 19843 then until Nifty will not sustain below 19333 after complete selling till then decisive down moves will not be seen,it should be kept in mind.
Nifty-Intra Day Chart
Analysis(13-Oct-2023)
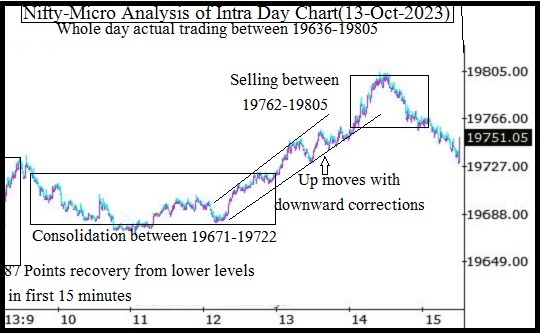
Nifty-Intra Day Chart (13-Oct-2023):-
Technical Patterns formation in today intraday charts
1- 87 Points recovery from lower levels in first 15 minutes after gap down opening.
1- Consolidation between 19671-19722
2- Up moves with downward corrections
3- Selling between 19762-19805
4- Whole day trading between 19636-19805
Conclusions from intra day chart analysis
As Israel-Hamas war acceleration news and sentiment turned depressed last Friay therefore most Asian markets were trading in Red zone and resultant firstly gap down opening was seen in Indian markets. Although such Bearish mood but Nifty not sustaining at lower levels and recovered 87 Points in first 15 minutes. As more than 3 hours consolidation and after that up moves with downward corrections therefore Nifty recovered 169 points from lower levels and once Nifty traded in green after recovering all intraday losses.
Although such strong recovery in Mid-session but higher levels selling developed therefore Nifty moves down 72 points in last hour and closed 42.95 down also last Friday. As both lower levels consolidation and higher levels selling between 19762-19805 therefore Nifty will firstly trade and prepare for next decisive moves within and near about this trading range and finally sustaining it beyond will confirm it hence it should be watched in the coming week for next decisive moves beginning confirmations.
Conclusions
(After putting all studies together)
1- Long Term trend is up.
2- Intermediate Term trend is at stake.
3- Short Term trend is at stake.
Impulsive Wave-(v) of Wave-3 continuation with recent and life time top formations at 20222.45 on 15-09-2023 but Short Term correction begun from this level which is in continuation with recent bottom formations at 19333.60 on 04-10-2023 and no confirmation of its completion yet on EOD and intraday charts.
As last 15 Sessions sideways trading between 19333-19843 therefore Short Term indicators are in indecisive mode and Nifty is hovering around Short and Intermediate Term Averages as well as intraday charts of last Friday are also showing both lower levels consolidation and higher levels selling therefore sustaining beyond following levels should be watched one by one in the coming week for next Trend formation confirmations because Indian and Global markets will react Israel-Hamas war also:-
1- Last Friday actual trading range(19762-19805)
2- Last 15 Sessions sideways trading range(19333-19843)
3- 21-Day SMA(today at 19750)
4- 55-Day SMA(today at 19616)