ॐ ह्रीं श्रीं लक्ष्मीभयो नमः॥


Trading "calls" from our "Software" with more than "90% accuracy"

More than "12 years" old "only site of whole world" 
with more than "9700 accurate Outlooks" of 
"Indian Stock Markets" 
19800 will confirm strong rally 
above life time top at 20222.45
Technical Analysis,Research & Weekly 
Outlook(Oct 09 to Oct 13,2023)
Nifty-EOD Chart Analysis
(Waves structure)
Nifty-EOD Chart (06-Oct-2023):-
Technical Patterns and Formations in EOD charts

1- Corrective Wave-(ii) of Wave-3 completion at 16828.3 on 20-03-2023 and Impulsive Wave-(iii) of Wave-3 beginning.
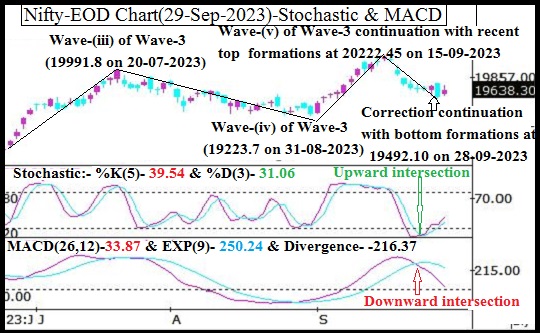
2- Impulsive Wave-(iii) of Wave-3 completion at 19991.8 on 20-07-2023.
3- Corrective Wave-(iv) of Wave-3 completion at at 19223.7 on 31-08-2023.   
4- Impulsive Wave-(v) of Wave-3 continuation with recent and life time top formations at 20222.45 on 5-09-2023 but Short Term correction beginning from this level. 
6- Short Term correction continuation with recent bottom formations at 19333.60 on 04-10-2023. 
7- Last 10 sessions sideways trading between 19333-19798

Conclusions from EOD chart analysis
(Waves structure)

Impulsive Wave-(iii) of Wave-3 started after from 16828.3 on 20-03-2023 after corrective Wave-(ii) of Wave-3 completion at this level. Now impulsive Wave-(v) of Wave-3 of this this Waves structure is in continuation with recent and life time top formations at 20222.45 on 5-09-2023 but Short Term correction begun from this level which is in continuation with recent recent bottom formations at 19333.60 on 04-10-2023. As last 10 sessions trading has turned sideways between 19333-19798 and finally sustaining beyond this range will confirm next Trend formation and big moves therefore it should be firstly watched in the coming week/weeks. 

Nifty-EOD Chart Analysis
(Stochastic & MACD)
Nifty-EOD Chart (06-Oct-2023):-
Technical Patterns and Formations in EOD charts

1- Stochastic- %K(5) line has intersected %D(3) line upward and its both lines are rising from Over sold zone.
2- Stochastic:- %K(5)- 51.38 & %D(3)- 37.55.
3- In MACD- MACD line has intersected Average line downward and its both lines are falling in negative and positive zone.
4- MACD(26,12)- -147.25 & EXP(9)- 46.73 & Divergence- -193.98

Conclusions from EOD chart analysis
(Stochastic & MACD)

Positions of Daily indicators are as follows:-

1- As in Stochastic its %K(5) line has intersected %D(3) line upward and its both lines are rising from Over sold zone therefore indicating previous week started up moves continuation in the coming week.
2- As in MACD indicator its MACD line has intersected Average line downward and its both lines are falling in negative and positive zone therefore this indicator is showing stronger indications of Short term Trend formations.

Nifty-EOD Chart Analysis
(Averages)
Nifty-EOD Chart (06-Oct-2023):-
Technical Patterns and Formations in EOD charts

Averages:-

1- 5-Day SMA is today at 19560 
2- 21-Day SMA is today at 19778
3- 55-Day SMA is today at 19623
4- 100-Day SMA is today at 19264
5- 200-Day SMA is today at 18517
 
Conclusions from EOD chart analysis
(Averages)

Although Nifty showed stronger indications of Intermediate Trend turning downward after forcefully slipping below its decider 55-Day SMA but strong recovery was seen from lower levels in last 3 sessions of previous week and and Nifty has closed above 55-Day SMA(19623) at 19653.50 last Friday. As Intermediate Trend is at stake and finally sustaining beyond 55-Day SMA will generate strong signals of next Trend formation and decisive moves beginning hence should be firstly watched in next week. 

Short term trend is down and if Nifty moves above 55-Day SMA(19623) then finally sustaining beyond Short term trend decider 21-Day SMA(today at 19778) should be watched for its confirmations. It should also be kept in mind that once sustaining above 21-Day SMA will mean Rally above life time highest(20222.45) after all trends turning upward and on going correction completion confirmations.

Nifty-Last 10 Sessions
intraday charts analysis
Nifty-Intra Day Chart (Sep 22 to Oct 06,2023):-
Technical Patterns formation in last 10 Sessions intraday charts

1- Selling(Resistances) in last 10 Sessions are as follows:-
A- 19660-19679
B- 19692-19751
C- 19763-19798 
2- Consolidation(Supports) in last 10 Sessions are as follows:-
A- 19592-19615
B- 19488-19540
C- 19343-19774
3- Last 10 Sessions actual trading between 19333-19798 

Conclusions from 10 Sessions
intra day chart analysis 

Last 10 Sessions sideways trading between 19333-19798 with above mentioned supports and resistances which seems to be almost equally strong and last Friday closing was also almost in the centre of last 10 sessions trading range therefore it will be understood that:-

1- Nifty will firstly trade and prepare for next big moves within and last 10 sessions trading range in the beginning of next week.
2- Finally sustaining beyond last 10 sessions trading range will confirm next Trend formations and big moves beginning.

Conclusions
(After putting all studies together)

1- Long Term trend is up.
2- Intermediate Term trend is at stake.
3- Short Term trend is down.

Correction of Impulsive Wave-(v) of Wave-3 from 20222.45 on 5-09-2023 after life time top formations at this level which is in continuation with recent bottom formation at 19333.60 on 04-10-2023 and no confirmation of its completion yet on EOD charts but few signals of its completion have been emerged in previous week:-

1- Weekly Candle of previous week was "Bullish Hammer" 
2- Weekly closing of previous week was both above 5-Day and 55-Day SMA.
3- Forceful recovery was seen from lower levels in previous week.
4- Intraday consolidation patterns and supports were seen at lower levels in all the last 3 sessions of previous week.

As Short Term Indicator Stochastic is showing signals of previous week started up moves continuation in the coming sessions therefore firstly sustaining beyond following levels should be watched in next week:-

1- 21-Day SMA(today at 19778)
2- Top of last 10 Sessions trading range at 19798.

As finally sustaining above these 2 levels will mean 10 sessions trading range break out and all trends turning upward confirmations as well therefore finally sustaining above psychological level of 19800 should be watched for fresh rally beginning above life time top(20222.45) because psychological level of 19800 is little above these 2 levels(19778 & 19798).
Firstly watch sustaining beyond 
19488-19576
Nifty-Intra Day Chart Analysis & 
Market Outlook(06-10-2023)
Nifty-Intra Day Chart (05-Oct-2023):-
Technical Patterns formation in today intraday charts

1- Down moves in Bullish Falling Channels
2- Supports between 19488-19500(immediate supports)
3- Sharp up
4- Selling between 19551-19576
5- Whole day actual trading between 19488-19576

Conclusions from intra day chart analysis 

Although gap up strong opening but firstly down moves were seen. As these down moves were in Bullish Falling Channels and after that lower levels some supports also developed therefore sharp moves were seen. Minor selling also at higher levels in last hours therefore expected that firstly sustaining beyond today trading range should be watched in the coming sessions because any side good intraday positions were not seen.

 As busy therefore unable to update today(05-10-2023) Outlook. 

 Down moves expectations below
 day's lowest
Nifty-Intra Day Chart Analysis & Market 
Outlook(04-10-2023)
Nifty-Intra Day Chart (03-Oct-2023):-
Technical Patterns formation in today intraday charts

1- 104 Points down in first 3 minutes after flat opening
2- Whole day sideways trading with selling Patterns formation between 19480-19564
3- Whole day actual trading between 19480-19623

Conclusions from intra day chart analysis 

At the time of Indian markets opening most Asian markets were trading in negative zone and some were deeply down in following manner

Nikkei 225- was trading 537.50 points and 1.69% down.
Hang Seng- was trading 617.66 points and 3.47% down.
SET- was trading 19.89 points and 1.35% down.

As sentiment turned dampened due to crashing like situation in Asian markets therefore Nifty has fallen 104 Points in first 3 minutes after flat opening. After that whole day sideways trading with selling Patterns formation between 19480-19564 therefore down moves are expected below day's lowest(19480) in the coming sessions.
Finally 19493-19798 will confirm next trend amid firstly up moves expectations
Technical Analysis,Research & Weekly Outlook
(Oct 03 to Oct 06,2023)
Nifty-EOD Chart Analysis
(Waves structure)
Nifty-EOD Chart (29-Sep-2023):-
Technical Patterns and Formations in EOD charts

1- Corrective Wave-C of "ABC correction" completion at 15183.4 on 17-06-2022 and Impulsive Wave-1 of new Waves structure beginning.
2- Impulsive Wave-1 completion at 18096.2 on 15-09-2022.
3- Corrective Wave-2 completion at 16747.7 on 30-09-2022.
4- Impulsive Wave-(i) of Wave-3 completion at 18887.6 on 01-12-2022.
5- Corrective Wave-(ii) of Wave-3 completion at 16828.3 on 20-03-2023.
6- Impulsive Wave-(iii) of Wave-3 completion at 19991.8 on 20-07-2023.
7- Corrective Wave-(iv) of Wave-3 completion at at 19223.7 on 31-08-2023.   
8- Impulsive Wave-(v) of Wave-3 continuation with recent and life time top formations at 20222.45 on 15-09-2023 but Short Term correction beginning from this level. 
9- Short Term correction continuation with recent bottom formations at 19492.10 on 28-09-2023. 
    
Conclusions from EOD chart analysis
(Waves structure)

Impulsive Wave-1 of new Waves structure started after corrective Wave-C of "ABC correction" completion at 15183.4 on 17-06-2022. impulsive Wave-1 completed at  18096.2 on 15-09-2022 and corrective Wave-2 begun which completed at 16747.7 on 30-09-2022 and Impulsive Wave-(i) of Wave-3 started.
 
At present impulsive Wave-(v) of Wave-3 is in continuation with recent and life time top formations at 20222.45 on 15-09-2023 but Short Term correction begun from this level which is in continuation with recent bottom formations at 19492.10 on 28-09-2023 and no confirmation of its completion yet on EOD and intraday charts. 

Nifty-EOD Chart Analysis
(Stochastic & MACD)
Nifty-EOD Chart (29-Sep-2023):-
Technical Patterns and Formations in EOD charts

1- Stochastic- %K(5) line has intersected %D(3) line upward and its both lines are rising from Over sold zone.
2- Stochastic:- %K(5)- 39.54 & %D(3)- 31.06.
3- Stochastic is showing negative/positive divergence
4- In MACD- MACD line has intersected Average line downward and its both lines are falling in positive zone.
5- MACD(26,12)-33.87 & EXP(9)- 250.24 & Divergence- -216.37

Conclusions from EOD chart analysis (Stochastic & MACD)

Positions of Daily indicators are as follows:-

1- As in Stochastic its %K(5) line has intersected %D(3) line upward and its both lines are rising from Over sold zone therefore showing signals of fresh up moves beginning in the coming week.
2- As in MACD indicator its MACD line has intersected Average line downward and its both lines are falling in positive zone as well as its MACD line is little above Zero line therefore suggesting stronger indications of downward trend formations. Divergence between its both lines has widened to 216.37 therefore some up moves also can not be ruled out hence this indicator is suggesting to adopt wait and watchful approach for final confirmations.

Nifty-EOD Chart Analysis
(Averages)
Nifty-EOD Chart (29-Sep-2023):-
Technical Patterns and Formations in EOD charts

Averages:-

1- 5-Day SMA is today at 19644 
2- 21-Day SMA is today at 19761
3- 55-Day SMA is today at 19628
4- 100-Day SMA is today at 19216
5- 200-Day SMA is today at 18498
 
Conclusions from EOD chart analysis
(Averages)

Nifty is hovering around both Short and Intermediate Term deciding Averages(5-Day SMA,21-Day SMA and 55-Day SMA) for the last 6 sessions therefore Short and Intermediate Term trends are at stake. Let one sided clear intersection of these Averages happen then that side trend formations and decisive moves beginning will get confirmations.  

Nifty-Intra Day Chart Analysis
(29-Sep-2023)
Nifty-Intra Day Chart (29-Sep-2023):-
Technical Patterns formation in today intraday charts

1- Consolidation between 19552-19604
2- Sharp up 
3- Consolidation between 19653-19682
4- Selling between 19705-19726
5- Sharp fall in last hour
6- Whole day actual trading between 19552-19726

Conclusions from intra day chart analysis 

Although firstly slipping after flat opening but lower levels consolidation developed therefore sharp up moves were seen after 11:00 AM. As follow up consolidation in Mid-session therefore after that some up moves were seen but higher levels fresh selling therefore Nifty had fallen more than 100 points in last hour,
As good intraday consolidation in comparison to selling therefore finally up moves are expected above last Friday highest(19726) but consolidation is also firstly required because some selling was also seen at higher levels last Friday.

Conclusions
(After putting all studies together)

1- Long Term trend is up.
2- Intermediate Term trend is at stake.
3- Short Term trend is at stake.

Short Term correction of impulsive Wave-(v) of Wave-3 is in continuation now with recent bottom formations at 19492.10 on 28-09-2023 and no confirmation of its completion yet on EOD and intraday charts. 

Although Nifty had moves below 61.8%(18605) crucial retracement level during on going correction and hovered around Intermediate Term trend decider 55-Day SMA(today at 19628) in previous week but closed above both these levels last Friday therefore firstly sustaining beyond both these levels will be watched in the coming week for the life of on going correction.

As Short Term indicator Stochastic is showing signals of fresh up moves beginning in the coming week and last Friday intraday charts are showing good consolidation also therefore firstly up moves are expected towards next resistances in the beginning of next week:- 

1- 19705-19726
2- 19761-19797

Next supports below last Friday closing are as follows:-

1- 19552-19604
2- 19493-19556

As Nifty traded in last 6 sessions between 19493-19798 with above mentioned supports and resistances in which Nifty has tested and broken down 2 most Crucial levels(61.8% retracement level & Intermediate Term trend decider 55-Day SMA) as well as both these levels are within last 6 sessions trading range therefore firstly sustaining it beyond should be watched in the coming week for next big moves beginning after following next trend formation confirmations:- 

1- Sustaining above 19798 will mean strong rally beginning towards and above life time top(20222.45) after all trends turning upward confirmations.
2- Sustaining below 19493 will mean all trends turning downward confirmations and down moves continuation towards the bottom of Impulsive Wave-(v) of Wave-3(19223.7).

As last Friday intraday charts and Short Term indicator Stochastic are suggesting firstly up moves beginning possibility therefore firstly up moves are expected in next week but finally sustaining beyond 19493-19798 will confirm next trend therefore should be finally watched for next trend confirmations.

Finally sustaining beyond 19600
 will confirm next Trend 
Nifty-Intra Day Chart Analysis & 
Market Outlook(29-09-2023)
Nifty-Intra Day Chart (28-Sep-2023):-
Technical Patterns formation in today intraday charts

1- Whole day down moves in Bullish Falling Channels
2- Support in last hour between 19493-19556
3- Whole day actual trading between 19493-19766

Conclusions from intra day chart analysis 

Although finally up moves were expected after fresh consolidation between 19555-19730 but firstly some up moves were seen after flat opening. As after that down moves started which remained continued till last hour and today closing was also below most Crucial level at 19600.  
As intraday selling patterns were not seen and on the contrary whole day down moves were in Bullish Falling Channels and lower levels supports were also seen therefore Watchful approach will be adopted and finally sustaining beyond 19600 will be watched in the coming sessions for next Trend formation confirmations
Finally up moves after fresh consolidation
Nifty-Intra Day Chart Analysis & 
Market Outlook(28-09-2023)
Nifty-Intra Day Chart (27-Sep-2023):-
Technical Patterns formation in today intraday charts

1- Down moves in first 2 hours after negative opening
2- Consolidation between 19555-19583
3- Up moves with downward corrections
4- Up moves in Bearish Rising Channel
5- Whole day actual trading between 19555-19730

Conclusions from intra day chart analysis 

Following lines were told at 02:15 AM on 27-11-2023 in "Firstly watch sustaining beyond 19600 under Global markets depressed sentiments":-

1- firstly sustaining beyond 19600 should be watched tomorrow 
2- finally up moves are expected above day's highest(19699).

As was told 100% same happened and;- 

1- Firstly Nifty slipped below 19600.
2- Finally Nifty moved above yesterday highest(19699) and closed at 19,716.45.

Although firstly Down moves in first 2 hours after 
negative opening and Nifty fell sharply below 19600 
also but lower levels good intraday consolidation developed therefore up moves started which remained continued till last minutes. 

As last hour up moves were in Bearish Rising Channel therefore higher levels some selling also can not be ruled out and expected that Nifty will firstly trade within day's trading range but finally up moves are expected above day's highest in the coming sessions which means that up moves will remain continued after fresh consolidation within day's trading range(19555-19730). 
Firstly watch sustaining beyond 19600 under Global markets depressed sentiments
Nifty-Intra Day Chart Analysis & 
Market Outlook(27-09-2023)
Nifty-Intra Day Chart (26-Sep-2023):-
Technical Patterns formation in today intraday charts

1- Down moves in Bullish Falling Channels
2- Consolidation between 19638-11656
3- Whole day actual trading between 19638-19699

Conclusions from intra day chart analysis 

Although minor negative closing after whole day sideways trading within 61 points but whole day good intraday consolidation was seen through most time Down moves in Bullish Falling Channels and lower levels consolidation also therefore finally up moves are expected above day's highest(19699).

As deeper down moves were seen in US and most European markets yesterday therefore sentiment may be much depressed and weaker opening may also be been seen in Indian markets tomorrow. Good intraday consolidation has been seen above 19600 in last 2 seen therefore firstly sustaining beyond 19600 should be watched tomorrow for next decisive moves beginning confirmations which will be under dampened Global markets sentiments.
Firstly watch 19600 after weaker 
Global sentiments
Pre-open Outlook(26-09-2023)

As Moody's warning about shut down in US markets and sentiment has turned weaker today morning therefore all the Asian markets are trading in negative zone and Dow Jones Futures is also trading more than 120 points down and resultant negative opening of Indian markets will seen. 

Consolidation was seen above 19600 yesterday therefore firstly sustaining beyond 19600 should be watched today for next intraday decisive moves beginning confirmation after weaker Global sentiments.
Up moves expectations towards
 next strong resistances
Nifty-Intra Day Chart Analysis & 
Market Outlook(26-09-2023)
Nifty-Intra Day Chart (25-Sep-2023):-
Technical Patterns formation in today intraday charts

1- Consolidation between 19602-19651
2- Sharp up moves
3- Selling between 19709-19734
4- Sharp fall
5- Consolidation between 19630-19682
6- Whole day actual trading between 19602-19734

Conclusions from intra day chart analysis 

Although down moves after flat opening but lower levels good consolidation developed therefore sharp up moves were seen in Mid-session. As higher levels selling also therefore sharp fall was seen after that but again consolidation was seen in last 2 hours.

As lower levels good consolidation therefore up moves are expected towards next strong resistances between 19759-19796 and sustaining it beyond should be watched in the coming sessions for next decisive moves beginning after on going Short term correction completion.
 Finally rally above life time highest(20222.45) without sustaining below 19600
Technical Analysis,Research & Weekly Outlook
(Sep 25 to Sep 29,2023)
Nifty-EOD Chart Analysis
(Waves structure)
Nifty-EOD Chart (22-Sep-2023):-
Technical Patterns and Formations in EOD charts

1- Corrective Wave-(ii) of Wave-3 completion at 16828.3 on 20-03-2023 & Impulsive Wave-(iii) of Wave-3 beginning.
2- Impulsive Wave-(iii) of Wave-3 completion at 19991.8 on 20-07-2023 & Corrective Wave-(iv) of Wave-3 beginning.
3- Corrective Wave-(iv) of Wave-3 completion at 19223.7 on 31-08-2023 & Impulsive Wave-(v) of Wave-3 beginning.  
4- Impulsive Wave-(v) of Wave-3 continuation with recent and life time top formations at 20222.45 on 15-09-2023 but Short Term correction beginning from this level. 
5- Short Term correction continuation with recent bottom formations at 19657.50 on 22-09-2023.   

Conclusions from EOD chart analysis
(Waves structure)

Corrective Wave-(ii) of Wave-3 completed at 16828.3 and Impulsive Wave-(iii) of Wave-3 started which completed at 19991.8. Then corrective Wave-(iv) of Wave-3 begun which completed at 19223.7 and impulsive Wave-(v) of Wave-3 started which is in continuation with recent top formations at 20222.45 on 15-09-2023 and no confirmation of its completion yet on EOD charts. As Short Term correction begun from this level which is in continuation with recent bottom formations at 19657.50 on 22-09-2023 and no confirmation of its completion also on EOD and intraday charts therefore fate of this on going Short Term correction should be firstly watched in the coming week for next trend formation confirmations.

Nifty-EOD Chart Analysis
(Stochastic & MACD)
Nifty-EOD Chart (22-Sep-2023):-
Technical Patterns and Formations in EOD charts

1- Stochastic- %K(5) line has intersected %D(3) line downward and its both lines are falling within and towards Over sold zone.
2- Stochastic:- %K(5)- 5.28 & %D(3)- 29.88.
3- In MACD- MACD line has intersected Average line upward,Its MACD line is falling and Average line is rising  in positive zone.
4- MACD(26,12)- 326.82 & EXP(9)- 280.22 & Divergence- 46.6

Conclusions from EOD chart analysis
(Stochastic & MACD)

Positions of Daily indicators are as follows:-

1- As in Stochastic %K(5) line has intersected %D(3) line downward and its both lines are falling within and towards Over sold zone therefore first signal of on going Short term correction completion has been developed. Let %K(5) line to intersect %D(3) line upward clearly then upward moves will be seen after Short term correction completion.
2- Although in MACD indicator its MACD line has intersected Average line upward but its MACD line is falling and Average line is rising therefore showing little indecisiveness. As its both lines are in positive zone therefore finally up moves will be expected after on going Short Term correction completion on EOD charts.

Nifty-EOD Chart Analysis
(Averages)
Nifty-EOD Chart (22-Sep-2023):-
Technical Patterns and Formations in EOD charts

Averages:-

1- 5-Day SMA is today at 19928  
2- 21-Day SMA is today at 19686
3- 55-Day SMA is today at 19606
4- 100-Day SMA is today at 19143
5- 200-Day SMA is today at 18471

Conclusions from EOD chart analysis
(Averages)

Nifty closed below both 5-Day and 21-Day SMA last Friday during on going Short Term correction which is its continuation confirmation. Although Nifty has not tested Intermediate Term Trend decider 55-Day SMA and recent bottom of on going correction is at 19657.5 which was formed last Friday therefore firstly sustaining beyond 55-Day SMA(19606) should be watched in the coming week for:-

1- The life and length of on going correction.
2- The life of both Short and Intermediate Term Trends.

Nifty-EOD Chart Analysis
(Fibonacci retracement levels)
Nifty-EOD Chart (22-Sep-2023):-
Technical Patterns and Formations in EOD charts

1- Impulsive Wave-(v) of Wave-3 beginning from 19223.7 on 31-08-2023 & .  
2- Impulsive Wave-(v) of Wave-3 continuation with recent top formations at 20222.45 on 15-09-2023.
3- Short Term correction continuation with recent bottom formations at 19657.50 on 22-09-2023.  
4- Crucial Fibonacci Retracement levels of Impulsive Wave-(v) of Wave-3 from 19223.7 to 20222.45 are as follows:-
23.6%- 18986 (Retraced)
38.2%- 18840 (Retraced)
50.0%- 18723 (Retraced)
61.8%- 18605
76.4%- 19459
 
Conclusions from EOD chart analysis
(Fibonacci retracement levels)

Correction of impulsive Wave-(v) of Wave-3 is in continuation and Nifty has retraced more than 50.0% of this wave up moves. As most crucial 61.8% retracement level(19605) is little below the lowest(19657.5) of on going correction therefore firstly sustaining it beyond should be watched in the coming week for the life of this wave correction.

Conclusions
(After putting all studies together)

1- Long Term trend is up.
2- Intermediate Term trend is up. This will be finally decided according to sustaining beyond its decider 55-Day SMA which is today at 19606.
3- Short Term trend is down.

Impulsive Wave-(v) of Wave-3 is on with recent top formations at 20222.45 on 15-09-2023 but Short Term correction started from this level which is in continuation with recent bottom formations at 19657.50 on 22-09-2023 and no confirmation of its completion also on EOD and intraday charts. 

Nifty has closed below both 5-Day,21-Day SMA and most Crucial 50.0% retracment level last Friday therefore Short Term Trend turning down confirmations. As Nifty has not tested Intermediate Term Trend decider 55-Day SMA which is today at 19606 and most crucial 61.8% retracement level which is at 19605 as well as both these levels are just above next psychological level of 19600 therefore this levels has become next trend and big moves decider in following manner:-

1- Sustaining below 19600 will mean correction correction confirmations towards the bottom of Wave-(v) of Wave-3 at 19223.7 after Intermediate Term trend turning down and 61.8% retracement level broken down confirmations 
2- Sustaining above 19600 will mean fresh rally beginning towards and above life time highest(20222.45) after Short Term correction completion and honouring both Intermediate Term trend decider 55-Day SMA and most crucial 61.8% retracement level.

As Stochastic indicator has shown first signal of on going Short term correction completion and both lines of MACD indicator are in positive zone therefore it will be understood that indicators are signalling fresh up moves beginning after some more lower levels consolidations. 

Indian Stock market is Bullish mode and now correction of impulsive Wave-(v) of Wave-3 is in continuation which is near its completion levels because Indicators are also suggesting its completion therefore expected that finally rally will start and remain continued above life time highest(20222.45) without sustaining below 19600 despite slipping towards and below it can not be ruled out.
Valid break out of 19710-19787 will confirm next intraday decisive moves
Nifty-Intra Day Chart Analysis & Market 
Outlook(22-09-2023)
Nifty-Intra Day Chart (21-Sep-2023):-
Technical Patterns formation in today intraday charts

1- 160 Points fall in first hour after gap down opening 
2- More than 5 hours sideways trading between 19710-19787
3- Whole day actual trading between 19710-19848

Conclusions from intra day chart analysis 

As most Asian markets were trading in Red and some were more than 1% down therefore firstly 160 Points fall was seen in first hour after gap down opening. More than 5 hours sideways trading between 19710-19787 which was near about lower levels of the day and some supports was also seen at lower levels also therefore firstly valid break out of 19710-19787 should be watched in the coming sessions for next intraday decisive moves beginning confirmations.
Firstly watch today lowest for up 
moves beginning confirmations
Nifty-Intra Day Chart Analysis & 
Market Outlook(21-09-2023)
Nifty-Intra Day Chart (20-Sep-2023):-
Technical Patterns formation in today intraday charts

1- Selling between 19993-20050
2- Down moves with upward corrections
3- Down moves in Bullish Falling Channel
4- Support between 19879-19919
5- Whole day actual trading between 19879-20050

Conclusions from intra day chart analysis 


A- firstly down moves are expected towards/below last Friday lowest(20129.70) in the beginning of next week
V- down moves will be seen towards following next supports in the beginning of next week:-
1- 20130-20154
2- 20044-20072
3- 19965-19990
4- 19918-19959
5- 19881-19912
C- after expected Short term correction completion in the coming week/weeks.

As was told 3 times on 16-09-2023 100% same happened and 

1- Nifty slipped 311 points in first 2 sessions of this week.
2- Today lowest was just below above mentioned 5th supports range(19881-19912) at 19878.85.

Although firstly up moves after 134 points gap down opening but selling was seen 19993-20050 which remained continued through Down moves with upward corrections which will be understood follow up selling after higher levels selling.

As down moves after 12:30 PM were were in Bullish Falling Channel and lower levels supports were also seen therefore some up moves can not be ruled out towards today highest. Firstly sustaining beyond today lowest should also be watched tomorrow for these up moves beginning confirmations.

 As I was out of station therefore unable to update today(20-09-2023) Outlook. 

Finally Bullish moves above life time highest after Short term correction completion
Technical Analysis,Research & Weekly Outlook
(Sep 18 to Sep 22,2023)
Nifty-EOD Chart Analysis
(Waves structure)
Nifty-EOD Chart (15-Sep-2023):-
Technical Patterns and Formations in EOD charts

1- Corrective Wave-C of "ABC correction" completion at 15183.4 on 17-06-2022 and Impulsive Wave-1 of new Waves structure beginning.
2- Impulsive Wave-1 completion at 18096.2 on 15-09-2022.
3- Corrective Wave-2 completion at 16747.7 on 30-09-2022.
4- Impulsive Wave-(i) of Wave-3 completion at 18887.6 on 01-12-2022.
5- Corrective Wave-(ii) of Wave-3 completion at 16828.3 on 20-03-2023.
6- Impulsive Wave-(iii) of Wave-3 completion at 19991.8 on 20-07-2023.
7- Corrective Wave-(iv) of Wave-3 completion at at 19223.7 on 31-08-2023.   
8- Impulsive Wave-(v) of Wave-3 continuation with recent top formations at 20222.45 on 15-09-2023.    

Conclusions from EOD chart analysis
(Waves structure)

As Nifty has gained more points than Impulsive Wave-1 therefore Wave-3 formation confirmation and as per this development new Waves structure has been posted above,

As per new Waves structure now Impulsive Wave-(v) of Wave-3 is in continuation with recent top formations at 20222.45 on 15-09-2023 and no indication of its completion yet on EOD charts therefore its continuation will be expected. Until complete selling patterns will not develop on EOD charts till then Impulsive Wave-(v) of Wave-3 will remain continued.

Nifty-EOD Chart Analysis
(Stochastic & MACD)
Nifty-EOD Chart (15-Sep-2023):-
Technical Patterns and Formations in EOD charts

1- Stochastic- Its both lines are kissing in Over bought zone.
2- Stochastic:- %K(5)- 89.91 & %D(3)- 88.95.
3- Stochastic is showing negative divergence
4- In MACD- MACD line has intersected Average line upward and its both lines are rising in positive zone.
5- MACD(26,12)- 325.18 & EXP(9)- 119.70 & Divergence- 205.48

Conclusions from EOD chart analysis
(Stochastic & MACD)

Positions of Daily indicators are as follows:-

1- As in Stochastic its both lines are in kissing mode for the last 7 sessions within Over bought zone and showing negative divergence also on EOD charts therefore stronger signals of Short term correction have developed. Let %K(5) line to intersect %D(3) line downward clearly then Short term correction will be seen.
2- As in MACD indicator its MACD line has intersected Average line upward and its both lines are rising in positive zone therefore Short term trend turning up upward has got confirmations and on going rally continuation will be seen. 

Although MACD indicator is confirming Short term upward trend formations but Stochastic indicator is suggesting that Short term correction is on cards therefore expected that finally up moves will be seen after Short term corrections MACD indicator shows trend for longer periods.  

Nifty-Intra Day Chart Analysis
(15-Sep-2023)
Nifty-Intra Day Chart (15-Sep-2023):-
Technical Patterns formation in today intraday charts

1- Up moves with downward corrections
2- Sharp fall
3- Up moves in Bearish Rising Channel
4- Sharp fall
5- Whole day actual trading between 20130-20222

Conclusions from intra day chart analysis 

As Bullish Global cues last Friday morning therefore firtsly up moves were seen in first 3 hours but fallen sharply in Mid-Session. First 3 hours Up moves were with downward corrections therefore again up moves begun from lower levels which remain continued till 03:00 PM. As these last hours up moves were in Bearish Rising Channel which is intraday selling pattern also therefore again sharp fall developed in last half hour. Higher levels intraday selling was seen last Friday therefore firstly down moves are expected towards/below last Friday lowest(20129.70) in the beginning of next week.

Conclusions (After putting all studies together)

1- Long Term trend is up.
2- Intermediate Term trend is up.
3- Short Term trend is up.

Impulsive Wave-(v) of Wave-3 continuation with recent top formations at 20222.45 on 15-09-2023 and no indication of its completion yet on EOD and intraday charts therefore its continuation will be expected with new life time top formations. 

As On going impulsive Wave-(v) of Wave-3 has gained 998 points in the last 12 sessions and indicators are suggesting that Short term correction may start any day as well as intraday charts of last Friday are showing selling patterns formations therefore down moves will be seen towards following next supports in the beginning of next week:-

1- 20130-20154
2- 20044-20072
3- 19965-19990
4- 19918-19959
5- 19881-19912

Finally Bullish moves of impulsive Wave-(v) of Wave-3 will remain continued above life time highest(20222.45) after expected Short term correction completion in the coming week/weeks.
Finally 20044-20115 will confirm 
next Very Short Term Trend 
Nifty-Intra Day Chart Analysis & 
Market Outlook(15-09-2023)
Nifty-Intra Day Chart (14-Sep-2023):-
Technical Patterns formation in today intraday charts

1- Firstly up moves after Gap up opening
2- Selling between 20141-20167
3- Downward moves
4- Sideways trading in last 5 hours between 20044-20115
5- Whole day actual trading between 20044-20167

Conclusions from intra day chart analysis 

Although firstly up moves after Gap up opening but higher levels selling developed therefore downward moves were seen after that. As sideways trading in last 5 hours between 20044-20115 and both selling and consolidation patterns were seen within this range therefore firstly Nifty will have to prepare for next one sided  decisive moves beginning which will be done within and near about this last 5 hours trading range. Let Nifty prepare then finally next Very Short Term Trend will be decided according to sustaining beyond last 5 hours trading range(20044-20115).
Fresh Up moves only after sustaining
 above 20096
Nifty-Intra Day Chart Analysis & 
Market Outlook(14-09-2023)
Nifty-Intra Day Chart (13-Sep-2023):-
Technical Patterns formation in today intraday charts

1- Firstly down moves after negative opening
2- Up moves with downward corrections
3- Sideways trading in last 2 hours between 20055-20096
4- Whole day actual trading between 19945-20096

Conclusions from intra day chart analysis 

Although firstly down moves after negative opening but getting supports within yesterday mentioned supports(19918-19959) therefore up moves started which remained continued in Mid-sessions. As these up moves were with downward corrections therefore consolidation will be understood during Mid-session trading and some up moves will be expected but sustaining above last 2 hours sideways trading range(20055-20096) is must because some selling was also seen within this range and fresh consolidation is also firstly required for sustaining above today highest.
Watch next supports amid down 
moves expectations
Nifty-Intra Day Chart Analysis & 
Market Outlook(13-09-2023)
Nifty-Intra Day Chart (12-Sep-2023):-
Technical Patterns formation in today intraday charts

1- 195 Points fall in first hour after more than 100 points gap up opening
2- More than 3 hours selling Patterns formations between 19978-20037
3- Whole day actual trading between 19915-20110

Conclusions from intra day chart analysis 

Although more than 100 points gap up strong opening but firstly 195 Points fall was seen in first hour. As more than 3 hours selling Patterns formations also in Mid-session between 19978-20037 therefore flat closing was seen after loosing all more than 100 points gains. Good intraday selling was seen therefore down moves are expected in the coming session and firstly sustaining beyond next immediate supports(19918-19959 should be watched for next decisive moves beginning confirmations.
Rally conitnuation with only Very Short term correction possibility
Nifty-Intra Day Chart Analysis
(11-Sep-2023)
Nifty-Intra Day Chart (11-Sep-2023):-
Technical Patterns formation in today intraday charts

1- Consolidation between 19881-19912
2- More than 4 hours consolidation in Mid-session between 19918-19959
3- Up moves in last hour
4- Whole day actual trading between 19866-20008

Conclusions from intra day chart analysis 

As firstly consolidation after positive opening and after that more than 4 hours consolidation in Mid-session also therefore up moves remained conitnued till last minutes and Nifty closed at life time highest after new Life time top formations. 
Only intraday consolidation patterns formations and selling patterns were not seen therefore on going rally conitnuation is expected but Very Short term indicators have tuned Over bought therefore only Very Short term correction possibility can not be ruled out.
Finally fresh rally amid only Very
 Short term correction possibility
Technical Analysis,Research & Weekly 
Outlook(Sep 11 to Sep 15,2023)
Nifty-EOD Chart Analysis
(Waves structure)
Nifty-EOD Chart (08-Sep-2023):-
Technical Patterns and Formations in EOD charts

1- Corrective Wave-C of "ABC correction" completion at 15183.4 on 17-06-2022 and Impulsive Wave-1 of new Waves structure beginning.
2- Impulsive Wave-[(i)] of Wave-1 completion at 18096.2 on 15-09-2022.
3- Corrective Wave-[(ii)] of Wave-1 completion at 16747.7 on 30-09-2022.
4- Impulsive Wave-(i) of Wave-[(iii)] of Wave-1 completion at 18887.6 on 01-12-2022 and Corrective Wave-A of "ABC" correction begining.
5- Corrective Wave-A of Wave-[(ii)] of Wave-[(iii)] of Wave-1 completion at 17774.3 on 26-12-2022.
6- Corrective Wave-B of Wave-[(ii)] of Wave-[(iii)] of Wave-1 completion at 18265.3 on 30-12-2022.
7- Corrective Wave-C of Wave-[(ii)] of Wave-[(iii)] of Wave-1 completion at 16828.3 on 20-03-2023.
8- Impulsive Wave-[(iii)] of Wave-[(iii)] of Wave-1 continuation with recent top formations at 19991.8 on 20-07-2023. 
9- Short Term correction completion strong indications at 19223.7 on 31-08-2023 after previous 15 Sessions trading range(19224-19584) forcefully broken out in previous week.  
10- Pull Back Rally continuation with recent top formations at 19867.15 on 08-09-2023.  

Conclusions from EOD chart analysis
(Waves structure)

Impulsive Wave-1 of new Waves structure started from 15183.4 on 17-06-2022 after Corrective Wave-C of "ABC correction" of previous Waves structure completion at this level. Impulsive Wave-[(i)] of Wave-1 completed at 18096.2 on 15-09-2022 and Corrective Wave-[(ii)] of Wave-1 begun which completed at 16747.7 on 30-09-2022 and from this levels impulsive Wave-[(iii)] of Wave-1 started.

Impulsive Wave-(i) of Wave-[(iii)] of Wave-1 completed at 18887.6 on 01-12-2022 and its "ABC" correction begun, Corrective Wave-C of "ABC" correction completed at 16828.3 on 20-03-2023. From this level Impulsive Wave-[(iii)] of Wave-[(iii)] of Wave-1 started which is in continuation with recent and life time top formations at 19991.8 on 20-07-2023. Although no confirmations of its completion yet on EOD charts but Short Term correction started from this level which is in continuation with recent bottom formations at 19223.7 on 31-08-2023. Pull Back Rally begun from this level which is in continuation with recent top formations at 19867.15 on 08-09-2023 and no confirmation of its conpletion yet.

Nifty-EOD Chart Analysis
(Stochastic & MACD)
Nifty-EOD Chart (08-Sep-2023):-
Technical Patterns and Formations in EOD charts

1- Stochastic- Its both lines are kissing in Over bought zone.
2- Stochastic:- %K(5)- 93.64 & %D(3)- 94.97.
3- In MACD- MACD line has intersected Average line upward and its MACD line is rising in positive while its Average line is rising in negative zone.
4- MACD(26,12)- 49.80 & EXP(9)- -63.74 & Divergence- 113.54

Conclusions from EOD chart analysis
(Stochastic & MACD)

Positions of Daily indicators are as follows:-

1- As in Stochastic its both lines are kissing in Over bought zone therefore first indication of Short term correction has emerged. Let %K(5) line to intersect %D(3) line downward then Short term correction beginning will be seen.
2- As in MACD indicator its MACD line has intersected Average line upward and its MACD line is rising in positive zone while its Average line is rising in negative zone therefore indications of Short term upward trend formations have emerged. Let  its Average line also to move into positive zone then decisive up moves will be seen after upward trend formation confirmations.

Nifty-Intra Day Chart Analysis
(08-Sep-2023)
Nifty-Intra Day Chart (08-Sep-2023):-
Technical Patterns formation in today intraday charts

1- Selling between 19767-19794
2- Support between 19728-19763
3- Sharp up moves
4- Mixed Patterns formation in last 4 hours between 19796-19867 
5- Whole day actual trading between 19728-19867

Conclusions from intra day chart analysis 

As selling developed after positive opening therefore down moves started and once Nifry lost all intraday gains also but lower levels supports developed and sharp up moves were seen after after that. Although Nifty closed with 0.47% gains last Friday but Mixed Patterns formation were seen in last 4 hours between 19796-19867 which means that both consolidation and selling patterns developed within this range therefore:- 

1- Nifty will firstly trade and prepare for next Very Short term moves beginning within and near about this range.
2- Finally sustaining beyond this range will confirm next Very Short term moves beginning hence it should be firstly watched in the beignning of next week.

Conclusions
(After putting all studies together)

1- Long Term trend is up.
2- Intermediate Term trend is up.
3- Short Term trend is up.

Short Term correction begun from 19991.8 on 20-07-2023 and no confirmations of its completion yet on EOD charts at its recent bottom at 19223.7 but strong indications of its completion have emergeed at this level because the Pull Back rally which started form this levels has:- 

1- Forcefully broken out Previous 15 Sessions trading range(19224-19584) in last week.
2- Nifty has remained only 124.65 points shorter than life time top at 19991.8.

As Short term indicator Stochastic is suggesting that Short term correction is on cards and MACD has also not 100% confirmned Upward Trend formations as well as some intraday selling patterns were also seen last Friday therefore Very Short Term correction may be seen in next week but finally rally continuation is expected towards following next resistances towards and above life time highest:-

1- 19831-19842
2- 19869-19991 

Immediate Supports below last Friday closing are as follows which should be watched during expected Very Short Term correction are:-

1- 19728-19763
2- 19551-19638

Finally fresh rally towards and above life time highest(19991.8) but firstly watch above supports and resistances amid only Very Short term correction possibility.