As I was out of station therefore unable to update today(20-09-2023) Outlook.

ॐ ह्रीं श्रीं लक्ष्मीभयो नमः॥

Finally Bullish moves above life time highest after Short term correction completion
Technical Analysis,Research & Weekly Outlook
(Sep 18 to Sep 22,2023)
Nifty-EOD Chart Analysis
(Waves structure)
Nifty-EOD Chart (15-Sep-2023):-

Technical Patterns and Formations in EOD charts
1- Corrective Wave-C of "ABC correction" completion at 15183.4 on 17-06-2022 and Impulsive Wave-1 of new Waves structure beginning.
2- Impulsive Wave-1 completion at 18096.2 on 15-09-2022.
3- Corrective Wave-2 completion at 16747.7 on 30-09-2022.
4- Impulsive Wave-(i) of Wave-3 completion at 18887.6 on 01-12-2022.
5- Corrective Wave-(ii) of Wave-3 completion at 16828.3 on 20-03-2023.
6- Impulsive Wave-(iii) of Wave-3 completion at 19991.8 on 20-07-2023.
7- Corrective Wave-(iv) of Wave-3 completion at at 19223.7 on 31-08-2023.
8- Impulsive Wave-(v) of Wave-3 continuation with recent top formations at 20222.45 on 15-09-2023.
Conclusions from EOD chart analysis
(Waves structure)
As Nifty has gained more points than Impulsive Wave-1 therefore Wave-3 formation confirmation and as per this development new Waves structure has been posted above,
As per new Waves structure now Impulsive Wave-(v) of Wave-3 is in continuation with recent top formations at 20222.45 on 15-09-2023 and no indication of its completion yet on EOD charts therefore its continuation will be expected. Until complete selling patterns will not develop on EOD charts till then Impulsive Wave-(v) of Wave-3 will remain continued.
Nifty-EOD Chart Analysis
(Stochastic & MACD)
Nifty-EOD Chart (15-Sep-2023):-

Technical Patterns and Formations in EOD charts
1- Stochastic- Its both lines are kissing in Over bought zone.
2- Stochastic:- %K(5)- 89.91 & %D(3)- 88.95.
3- Stochastic is showing negative divergence
4- In MACD- MACD line has intersected Average line upward and its both lines are rising in positive zone.
5- MACD(26,12)- 325.18 & EXP(9)- 119.70 & Divergence- 205.48
Conclusions from EOD chart analysis
(Stochastic & MACD)
Positions of Daily indicators are as follows:-
1- As in Stochastic its both lines are in kissing mode for the last 7 sessions within Over bought zone and showing negative divergence also on EOD charts therefore stronger signals of Short term correction have developed. Let %K(5) line to intersect %D(3) line downward clearly then Short term correction will be seen.
2- As in MACD indicator its MACD line has intersected Average line upward and its both lines are rising in positive zone therefore Short term trend turning up upward has got confirmations and on going rally continuation will be seen.
Although MACD indicator is confirming Short term upward trend formations but Stochastic indicator is suggesting that Short term correction is on cards therefore expected that finally up moves will be seen after Short term corrections MACD indicator shows trend for longer periods.
Nifty-Intra Day Chart Analysis
(15-Sep-2023)
Nifty-Intra Day Chart (15-Sep-2023):-

Technical Patterns formation in today intraday charts
1- Up moves with downward corrections
2- Sharp fall
3- Up moves in Bearish Rising Channel
4- Sharp fall
5- Whole day actual trading between 20130-20222
Conclusions from intra day chart analysis
As Bullish Global cues last Friday morning therefore firtsly up moves were seen in first 3 hours but fallen sharply in Mid-Session. First 3 hours Up moves were with downward corrections therefore again up moves begun from lower levels which remain continued till 03:00 PM. As these last hours up moves were in Bearish Rising Channel which is intraday selling pattern also therefore again sharp fall developed in last half hour. Higher levels intraday selling was seen last Friday therefore firstly down moves are expected towards/below last Friday lowest(20129.70) in the beginning of next week.
Conclusions (After putting all studies together)
1- Long Term trend is up.
2- Intermediate Term trend is up.
3- Short Term trend is up.
Impulsive Wave-(v) of Wave-3 continuation with recent top formations at 20222.45 on 15-09-2023 and no indication of its completion yet on EOD and intraday charts therefore its continuation will be expected with new life time top formations.
As On going impulsive Wave-(v) of Wave-3 has gained 998 points in the last 12 sessions and indicators are suggesting that Short term correction may start any day as well as intraday charts of last Friday are showing selling patterns formations therefore down moves will be seen towards following next supports in the beginning of next week:-
1- 20130-20154
2- 20044-20072
3- 19965-19990
4- 19918-19959
5- 19881-19912
Finally Bullish moves of impulsive Wave-(v) of Wave-3 will remain continued above life time highest(20222.45) after expected Short term correction completion in the coming week/weeks.
Finally 20044-20115 will confirm
next Very Short Term Trend
Nifty-Intra Day Chart Analysis &
Market Outlook(15-09-2023)
Nifty-Intra Day Chart (14-Sep-2023):-

Technical Patterns formation in today intraday charts
1- Firstly up moves after Gap up opening
2- Selling between 20141-20167
3- Downward moves
4- Sideways trading in last 5 hours between 20044-20115
5- Whole day actual trading between 20044-20167
Conclusions from intra day chart analysis
Although firstly up moves after Gap up opening but higher levels selling developed therefore downward moves were seen after that. As sideways trading in last 5 hours between 20044-20115 and both selling and consolidation patterns were seen within this range therefore firstly Nifty will have to prepare for next one sided decisive moves beginning which will be done within and near about this last 5 hours trading range. Let Nifty prepare then finally next Very Short Term Trend will be decided according to sustaining beyond last 5 hours trading range(20044-20115).
Fresh Up moves only after sustaining
above 20096
Nifty-Intra Day Chart Analysis &
Market Outlook(14-09-2023)
Nifty-Intra Day Chart (13-Sep-2023):-

Technical Patterns formation in today intraday charts
1- Firstly down moves after negative opening
2- Up moves with downward corrections
3- Sideways trading in last 2 hours between 20055-20096
4- Whole day actual trading between 19945-20096
Conclusions from intra day chart analysis
Although firstly down moves after negative opening but getting supports within yesterday mentioned supports(19918-19959) therefore up moves started which remained continued in Mid-sessions. As these up moves were with downward corrections therefore consolidation will be understood during Mid-session trading and some up moves will be expected but sustaining above last 2 hours sideways trading range(20055-20096) is must because some selling was also seen within this range and fresh consolidation is also firstly required for sustaining above today highest.
Watch next supports amid down
moves expectations
Nifty-Intra Day Chart Analysis &
Market Outlook(13-09-2023)
Nifty-Intra Day Chart (12-Sep-2023):-

Technical Patterns formation in today intraday charts
1- 195 Points fall in first hour after more than 100 points gap up opening
2- More than 3 hours selling Patterns formations between 19978-20037
3- Whole day actual trading between 19915-20110
Conclusions from intra day chart analysis
Although more than 100 points gap up strong opening but firstly 195 Points fall was seen in first hour. As more than 3 hours selling Patterns formations also in Mid-session between 19978-20037 therefore flat closing was seen after loosing all more than 100 points gains. Good intraday selling was seen therefore down moves are expected in the coming session and firstly sustaining beyond next immediate supports(19918-19959 should be watched for next decisive moves beginning confirmations.
Rally conitnuation with only Very Short term correction possibility
Nifty-Intra Day Chart Analysis
(11-Sep-2023)
Nifty-Intra Day Chart (11-Sep-2023):-

Technical Patterns formation in today intraday charts
1- Consolidation between 19881-19912
2- More than 4 hours consolidation in Mid-session between 19918-19959
3- Up moves in last hour
4- Whole day actual trading between 19866-20008
Conclusions from intra day chart analysis
As firstly consolidation after positive opening and after that more than 4 hours consolidation in Mid-session also therefore up moves remained conitnued till last minutes and Nifty closed at life time highest after new Life time top formations.
Only intraday consolidation patterns formations and selling patterns were not seen therefore on going rally conitnuation is expected but Very Short term indicators have tuned Over bought therefore only Very Short term correction possibility can not be ruled out.
Finally fresh rally amid only Very
Short term correction possibility
Technical Analysis,Research & Weekly
Outlook(Sep 11 to Sep 15,2023)
Nifty-EOD Chart Analysis
(Waves structure)
Nifty-EOD Chart (08-Sep-2023):-

Technical Patterns and Formations in EOD charts
1- Corrective Wave-C of "ABC correction" completion at 15183.4 on 17-06-2022 and Impulsive Wave-1 of new Waves structure beginning.
2- Impulsive Wave-[(i)] of Wave-1 completion at 18096.2 on 15-09-2022.
3- Corrective Wave-[(ii)] of Wave-1 completion at 16747.7 on 30-09-2022.
4- Impulsive Wave-(i) of Wave-[(iii)] of Wave-1 completion at 18887.6 on 01-12-2022 and Corrective Wave-A of "ABC" correction begining.
5- Corrective Wave-A of Wave-[(ii)] of Wave-[(iii)] of Wave-1 completion at 17774.3 on 26-12-2022.
6- Corrective Wave-B of Wave-[(ii)] of Wave-[(iii)] of Wave-1 completion at 18265.3 on 30-12-2022.
7- Corrective Wave-C of Wave-[(ii)] of Wave-[(iii)] of Wave-1 completion at 16828.3 on 20-03-2023.
8- Impulsive Wave-[(iii)] of Wave-[(iii)] of Wave-1 continuation with recent top formations at 19991.8 on 20-07-2023.
9- Short Term correction completion strong indications at 19223.7 on 31-08-2023 after previous 15 Sessions trading range(19224-19584) forcefully broken out in previous week.
10- Pull Back Rally continuation with recent top formations at 19867.15 on 08-09-2023.
Conclusions from EOD chart analysis
(Waves structure)
Impulsive Wave-1 of new Waves structure started from 15183.4 on 17-06-2022 after Corrective Wave-C of "ABC correction" of previous Waves structure completion at this level. Impulsive Wave-[(i)] of Wave-1 completed at 18096.2 on 15-09-2022 and Corrective Wave-[(ii)] of Wave-1 begun which completed at 16747.7 on 30-09-2022 and from this levels impulsive Wave-[(iii)] of Wave-1 started.
Impulsive Wave-(i) of Wave-[(iii)] of Wave-1 completed at 18887.6 on 01-12-2022 and its "ABC" correction begun, Corrective Wave-C of "ABC" correction completed at 16828.3 on 20-03-2023. From this level Impulsive Wave-[(iii)] of Wave-[(iii)] of Wave-1 started which is in continuation with recent and life time top formations at 19991.8 on 20-07-2023. Although no confirmations of its completion yet on EOD charts but Short Term correction started from this level which is in continuation with recent bottom formations at 19223.7 on 31-08-2023. Pull Back Rally begun from this level which is in continuation with recent top formations at 19867.15 on 08-09-2023 and no confirmation of its conpletion yet.
Nifty-EOD Chart Analysis
(Stochastic & MACD)
Nifty-EOD Chart (08-Sep-2023):-

Technical Patterns and Formations in EOD charts
1- Stochastic- Its both lines are kissing in Over bought zone.
2- Stochastic:- %K(5)- 93.64 & %D(3)- 94.97.
3- In MACD- MACD line has intersected Average line upward and its MACD line is rising in positive while its Average line is rising in negative zone.
4- MACD(26,12)- 49.80 & EXP(9)- -63.74 & Divergence- 113.54
Conclusions from EOD chart analysis
(Stochastic & MACD)
Positions of Daily indicators are as follows:-
1- As in Stochastic its both lines are kissing in Over bought zone therefore first indication of Short term correction has emerged. Let %K(5) line to intersect %D(3) line downward then Short term correction beginning will be seen.
2- As in MACD indicator its MACD line has intersected Average line upward and its MACD line is rising in positive zone while its Average line is rising in negative zone therefore indications of Short term upward trend formations have emerged. Let its Average line also to move into positive zone then decisive up moves will be seen after upward trend formation confirmations.
Nifty-Intra Day Chart Analysis
(08-Sep-2023)
Nifty-Intra Day Chart (08-Sep-2023):-

Technical Patterns formation in today intraday charts
1- Selling between 19767-19794
2- Support between 19728-19763
3- Sharp up moves
4- Mixed Patterns formation in last 4 hours between 19796-19867
5- Whole day actual trading between 19728-19867
Conclusions from intra day chart analysis
As selling developed after positive opening therefore down moves started and once Nifry lost all intraday gains also but lower levels supports developed and sharp up moves were seen after after that. Although Nifty closed with 0.47% gains last Friday but Mixed Patterns formation were seen in last 4 hours between 19796-19867 which means that both consolidation and selling patterns developed within this range therefore:-
1- Nifty will firstly trade and prepare for next Very Short term moves beginning within and near about this range.
2- Finally sustaining beyond this range will confirm next Very Short term moves beginning hence it should be firstly watched in the beignning of next week.
Conclusions
(After putting all studies together)
1- Long Term trend is up.
2- Intermediate Term trend is up.
3- Short Term trend is up.
Short Term correction begun from 19991.8 on 20-07-2023 and no confirmations of its completion yet on EOD charts at its recent bottom at 19223.7 but strong indications of its completion have emergeed at this level because the Pull Back rally which started form this levels has:-
1- Forcefully broken out Previous 15 Sessions trading range(19224-19584) in last week.
2- Nifty has remained only 124.65 points shorter than life time top at 19991.8.
As Short term indicator Stochastic is suggesting that Short term correction is on cards and MACD has also not 100% confirmned Upward Trend formations as well as some intraday selling patterns were also seen last Friday therefore Very Short Term correction may be seen in next week but finally rally continuation is expected towards following next resistances towards and above life time highest:-
1- 19831-19842
2- 19869-19991
Immediate Supports below last Friday closing are as follows which should be watched during expected Very Short Term correction are:-
1- 19728-19763
2- 19551-19638
Finally fresh rally towards and above life time highest(19991.8) but firstly watch above supports and resistances amid only Very Short term correction possibility.
More up moves but after fresh consolidation
Nifty-Intra Day Chart Analysis &
Market Outlook(08-09-2023)
Nifty-Intra Day Chart (07-Sep-2023):-
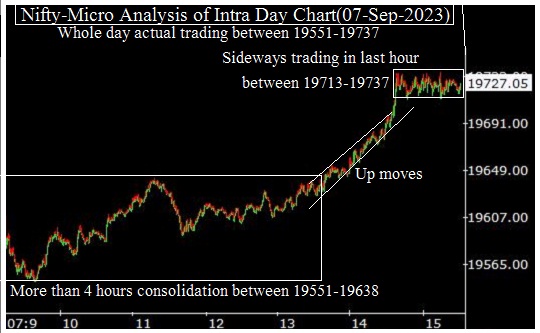
Technical Patterns formation in today intraday charts
1- More than 4 hours consolidation between 19551-19638
2- Up moves
3- Sideways trading in last hour between 19713-19737
4- Whole day actual trading between 19551-19737
Conclusions from intra day chart analysis
Although firstly slipping after negative opening but lower levels more than 4 hours consolidation was seen therefore up moves developed in Mid-Session. As higher levels sideways trading in last hour between 19713-19737 which was with more than 100 points gains therefore more up moves are expected but fresh consolidation is also firstly required because Very Short Term indicators have also turned Over bought.
19492-19636 will confirm next
decisve moves beginning
Nifty-Intra Day Chart Analysis &
Market Outlook(07-09-2023)
Nifty-Intra Day Chart (06-Sep-2023):-

Technical Patterns formation in today intraday charts
1- Down moves with upward corrections
1- Consolidation between 19492-19524
3- Sharp up in last half hour
4- Whole day actual trading between 19492-19636
Conclusions from intra day chart analysis
As selling begun after flat opening therefore down moves started which were with upward corrections therefore it will be understood that selling remained continued alomost first 4 hours and Nifty traded 82 points down also.
Lower levels good consolidation developed after more than 3 hours down moves therefore more than 100 points sharp jumo was seen in last half hour and Nifty closed after 36 points gains. Although today closing was near the higher levels of the day but higher levels selling was also seeen despite lower levels consolidation therefore Nifty will firstly trade within and near about today trading range and finally sustaining beyond today trading range will confirm next decisve moves beginning.
Finally 19433-19545 will confirm
next decisive moves beginning
Nifty-Intra Day Chart Analysis & Market
Outlook(05-09-2023)
Nifty-Intra Day Chart (04-Sep-2023):-

Technical Patterns formation in today intraday charts
1- Firstly down moves after gap up strong opening
2- Slow up moves after 11:00 AM
3- Whole day actual trading between 19433-19545
Conclusions from intra day chart analysis
Although gap up strong opening but firstly down moves were seen and Nifty traded in negative zone also for a while. As all the up moves after 11:00 AM were slow therefore intraday selling will also understood despite 0.48% positive closing. Expected that firstly Nifty will trade within day's trading range between 19433-19545 and finally sustaining beyond this range will confirm next decisive moves beginning.
Firstly watch last 15 sessions highest
at 19584 for on going correction
compleiton confirmations
Technical Analysis,Research &
Weekly Outlook(Sep 04 to Sep 08,2023)
Nifty-EOD Chart Analysis
(Stochastic & MACD)
Nifty-EOD Chart (01-Sep-2023):-

Technical Patterns and Formations in EOD charts
1- Impulsive Wave-[(iii)] of Wave-[(iii)] of Wave-1 beginning from 16828.3 on 20-03-2023.
2- Impulsive Wave-[(iii)] of Wave-[(iii)] of Wave-1 continuation with recent top formations at 19991.8 on 20-07-2023.
3- Short Term correction continuation with recent bottom formations at 19223.7 on 31-08-2023.
4- Last 15 Sessions trading between 19224-19584.
5- Stochastic- %K(5) line has intersected %D(3) line upward and its both lines are rising from Over sold zone.
6- Stochastic:- %K(5)- 45.48 & %D(3)- 33.47.
7- In MACD- MACD line has intersected Average line upward and its both lines are rising in negative zone.
8- MACD(26,12)- -98.18 & EXP(9)- -131.48 & Divergence- 33.3
9- MACD is showing negative/positive divergence
Conclusions from EOD chart analysis
(Stochastic & MACD)
Impulsive Wave-[(iii)] of Wave-[(iii)] of Wave-1 which started from 16828.3 on 20-03-2023 is in continuation with recent top and life time top formation at 19991.8 on 20-07-2023. Although no confirmation of its completion yet on EOD Charts but Short Term correction begun from this level and in continuation with recent bottom formations at 19223.7 on 31-08-2023. Last 15 sessions trading between 19224-19584 and finally sustaining beyond this range will confirm the life and length of on going correction. Positions of Daily indicators are as follows:-
1- As in Short Term indicator Stochastic %K(5) line has intersected %D(3) line upward and its both lines have started to rise from Over sold zone therefore more upward moves are expected in next week.
2- As in MACD indicator its MACD line has intersected Average line upward and its both lines are rising in negative zone therefore it will be understood that first signal of Short Term upward trend formation has emerged. Let its both lines to move into positive zone then upward trend formations will get confirmations.
Nifty-EOD Chart Analysis
(Averages)
Nifty-EOD Chart (01-Sep-2023):-

Technical Patterns and Formations in EOD charts
Averages:-
1- 5-Day SMA is today at 19337
2- 21-Day SMA is today at 19419
3- 55-Day SMA is today at 19371
4- 100-Day SMA is today at 18853
5- 200-Day SMA is today at 18374
Conclusions from EOD chart analysis
(Averages)
As Nifty has closed above all the Short(5 and 21-Day SMA) and Intermediate(55-Day SMA) Term Averages last Friday therefore first signal of on going Short Term correction completion has emerged. Let 5-Day SMA to move above both 21 and 55-Day SMA then Short Term correction completion and fresh rally beginning above life time highest(19991.8) will get confirmations.
Nifty-Last 15 Sessions
intraday charts analysis
Nifty-Intra Day Chart (Aug 11 to Sep 01,2023):-

Technical Patterns formation in last 15 Sessions intraday charts
1- Resistances in last 15 Sessions are as follows:-
A- 19414-19488
B- 19544-19584
2- Supports in last 15 Sessions are as follows:-
A- 19287-19349
B- 19258-19281
3- Last 15 Sessions actual trading between 19224-19584
Conclusions from 15 Sessions
intra day chart analysis
Last 15 Sessions actual trading between 19224-19584 with above mentioned supports and resistances which are almost equal strong also. As last Friday closng was near about in the middle of last 15 Sessions trading range also therefore firstly Nifty will have to trade and prepare for next trend formations within and near about last 15 sessions trading range. Finally sustaining beyond or forceful break out/down of this range will confirm next big moves beginning hence should be watched in next week for its confirmations.
Nifty-Intra Day Chart Analysis
(01-Sep-2023)
Nifty-Intra Day Chart (01-Sep-2023):-

Technical Patterns formation in today intraday charts
1- Up moves after positive opening
2- More than 3 hours consolidation between 19287-19349(immediate supports)
3- Up moves with downward corrections
4- Sideways trading in last hours between 19421-19458
5- Whole day actual trading between 19256-19458
Conclusions from intra day chart analysis
Most positive news that India's gross domestic product (GDP) grew by 7.8 per cent in the April-June quarter of current fiscal (2023-2024), compared to a growth of 6.1 per cent in the previous January-March quarter of fiscal 2022-23 therefore sentiment boosted and firstly up moves were seen after positive opening.
As more than 3 hours consolidation between 19287-19349 and after that up moves were with downward corrections therefore last Friday closing was near the higher levels of the day after sideways trading in last hours. Whole day only intraday consolidation and selling patterns were not seen therefore firstly up moves are expected in the beginning of next week.
Conclusions
(After putting all studies together)
1- Long Term trend is up.
2- Intermediate Term trend is at stake and firstly sustaining beyond its decider 55-Day SMA(today at 19371) should be watched in the coming week for its confirmations.
3- Short Term trend is at stake and firstly sustaining beyond its decider 5-Day and 21-Day SMA(today at 19337 and 19419 respectively) should be watched in the coming week for its confirmations.
Impulsive Wave-[(iii)] of Wave-[(iii)] of Wave-1 begun from 16828.3 on 20-03-2023 and in continuation with recent top formations at 19991.8 on 20-07-2023. Short Term correction started from this levels which is in continuation with recent bottom formations at 19223.7 on 31-08-2023 and no confirmation of its completion yet on EOD and intraday charts. As last 15 Sessions trading between 19224-19584 and finally sustaining beyond this range will confirm the life and length of on going last 30 sessions correction therefore it should be watched in the coming week/weeks.
As Nifty closed above all the Averages last Friday and Indicators are also showing upmoves beginning signals as well as last Friday intraday chart is shouing good intraday consolidation therefore up moves are expected towards the highest(19584) of last 15 sessions trading range and firstly sustaining beyond next resistances of last 15 Sessions should be watched in the coming week bacause:-
1- Sustaining above last 15 sessions highest(19584) will be confirmation of on going 30 sessions correction
2- Fresh rally beginning towards and above life time highest(19991.8).
Watch most crucial level for
next trends & big moves
Nifty-Intra Day Chart Analysis &
Market Outlook(01-09-2023)
Nifty-Intra Day Chart (31-Aug-2023):-

Technical Patterns formation in today intraday charts
1- Whole day down moves with upward corrections
2- Whole day actual trading between 19224-19388
Conclusions from intra day chart analysis
Previous sessions Outlooks of this week are live proofs of this fact that we were Bearish and Nifty closed at the lowest of this week on 31-08-2023.
Although positive opening but good intraday selling was seen in previous sessions therefore down moves started which remained continued till last minutes. As whole day down moves were with upward corrections therefore follow up selling will be understood and down moves are expected but sustaining below day's lowest(19224) will mean deeper correction beginning confirmations.
As 19245 is 23.6% Retracement levels of Impulsive Wave-[(iii)] of Wave-[(iii)] of Wave-1(from 16828.3 to Wave-19991.8) and day's lowest(19224) is below it therefore 19245 has become most crucial level and next trends with big moves decider also hence sustaining it beyond should be firstly watched today for its confirmations.
Finally 19245-19452 will confirm next Short term Trend & remain cautious also
Nifty-Intra Day Chart Analysis &
Market Outlook(31-08-2023)
Nifty-Intra Day Chart (30-Aug-2023):-

Technical Patterns formation in today intraday charts
1- Selling between 19414-19452(immediate Resistances)
2- Sharp fall in last hour
3- Whole day actual trading between 19335-19452
Conclusions from intra day chart analysis
Although Bullish Global cues led strong opening but five hours selling was seen therefore sharp fall developed in last hour and closing was near the lower levels of the day.
As intraday charts of previous sessions were showing good selling patterns formations therefore our view was Bearish and Nifty has closed within 100 points between 19265-19348 in last 4 sessions.
Following levels becomes crucial and next decisive moves decider:-
1- Selling range(19414-19452) of 30-08-2023 which is immediate Resistances.
2- Previous 3 sessions(25-08-2023 to 29-08-2023) trading range(19245-19356) in which selling was also seen.
As sharp fall was also seen yesterday within last 4 sessions trading range(19245-19452) therefore finally sustaining beyond this range should be watched in the coming sessions for next Short term Trend beginning confirmations and remain cautious also because sustaining below 19245 will mean deeper correction beginning.
Down moves expectations below
day's lowest
Nifty-Intra Day Chart Analysis &
Market Outlook(29-08-2023)
Nifty-Intra Day Chart (28-Aug-2023):-

Technical Patterns formation in today intraday charts
1- Down moves after positive opening
2- 116 Points up moves till 02:00 PM
3- More than 4 hours selling Patterns formation between 19307-19366
4- Whole day actual trading between 19250-19366
Conclusions from intra day chart analysis
Although positive opening but firstly down moves and after that 116 Points up moves were seen till 02:00 PM. As more than 4 hours selling Patterns formation between 19307-19366 in Mid-session also therefore down moves after expected below day's lowest(19250) despite positive closing on 28-08-2023.
Firstly watch Intermediate Term trend
decider 55-Day SMA amid
correction continuation expectations
Technical Analysis,Research & Weekly
Outlook(Aug 28 to Sep 01,2023)
Nifty-EOD Chart Analysis
(Stochastic & MACD)
Nifty-EOD Chart (25-Aug-2023):-

Technical Patterns and Formations in EOD charts
1- Last 38 sessions most time trading range(19297-19991) broken down and first time closing below it at 19265.80 on 25-08-2023
2- Stochastic- %K(5) line has intersected %D(3) line downward and its both lines are falling towards Over sold zone.
3- Stochastic:- %K(5)- 45.86 & %D(3)- 59.77.
4- In MACD- MACD line has intersected Average line downward and its both lines are kissing in negative zone.
5- MACD(26,12)- -139.70 & EXP(9)- -131.93 & Divergence- -7.77
Conclusions from EOD chart analysis
(Stochastic & MACD)
Short Term correction which started from 19991.8 on 20-07-2023 is in continuation with recent bottom formations at 19229.7 on 25-08-2023 and no indication of its completion yet on EOD charts. Positions of Daily indicators are as follows:-
1- As in Short Term indicator Stochastic %K(5) line has again intersected %D(3) line downward in previous week and its both lines are falling towards Over sold zone therefore more downward moves are expected in next week.
2- As in MACD indicator its both lines are kissing in negative zone therefore at present this indicator is not showing any side clear trend but its both lines are in negative zone therefore finally downward intersection will mean on going correction continuation confirmations which should be firstly watched in next week.
Nifty-EOD Chart Analysis
(Averages)
Nifty-EOD Chart (25-Aug-2023):-

Technical Patterns and Formations in EOD charts
Averages:-
1- 5-Day SMA is today at 19377
2- 21-Day SMA is today at 19497
3- 55-Day SMA is today at 19309
4- 100-Day SMA is today at 18761
5- 200-Day SMA is today at 18346
Conclusions from EOD chart analysis
(Averages)
As Nifty had sustainined below both Short Term Trend deciders 5-Day and 21-Day SMA therefore confirmed that Short Term Trend has turned downward. Nifty has closed(19250.30) below Intermediate Term Trend decider 55-Day SMA which is today at 19309 therefore it will be understood that Intermediate Term Trend is at stake and firstly sustaining beyond 55-Day SMA should be watched in the coming week for Intermediate Term Trend and next big moves beginning confirmations.
Nifty-Intra Day Chart Analysis
(25-Aug-2023)
Nifty-Intra Day Chart (25-Aug-2023):-

Technical Patterns formation in today intraday charts
1- Up moves after 71 points gap down opening
2- Selling between 19296-19339
3- Selling between 19276-19299
4- Sharp fall in last half hour
5- Whole day actual trading between 19230-19339
Conclusions from intra day chart analysis
Although firstly up moves after 71 points gap down opening but higher levels good intraday selling developed last Friday therefore Sharp fall was seen in last half hour. As only intraday selling and consolidation was not seen therefore firstly down moves below last Friday lowest will be seen in the beginning of next week.
Conclusions
(After putting all studies together)
1- Long Term trend is up.
2- Intermediate Term trend is still up but at stake and firstly sustaining beyond 55-Day SMA(today at 19309) should be watched in the coming week for its confirmations.
3- Short Term trend is confirm down.
Impulsive Wave-[(iii)] of Wave-[(iii)] of Wave-1 is in continuation with recent and life time top formations at 19991.8 on 20-07-2023 and no confirmations of its completion yet on EOD charts but Short Term correction started from this levels which is in continuation with recent bottom formations at 19265.80 on 25-08-2023.
As Short Term indicator Stochastic is signalling correction continuation possibility and last Friday intraday charts are also showing more downward moves signals therefore firstly Bearish moves are expected in the beginning of next week and following supports/levels should also be watched one by one for the length of on going correction:-
1- Watch those next supports below last Friday closing(19265.80) which were posted in previous week Weekly Outlook.
2- Watch following Fibonacci Retracement levels of Impulsive Wave-[(iii)] of Wave-[(iii)] of Wave-1(from 16828.3 to Wave-19991.8):-
13.0%- 19,580.5 (Retraced)
23.6%- 19,245.2
27.0%- 19,137.7
38.2%- 18,783.3 (Crucial)
50.0%- 18,410.1 (Crucial)
61.8%- 18,036.8 (Crucial)
70.7%- 17,755.2
76.4%- 17,574.9
78.6%- 17,505.3
88.6%- 17,188.9
Correction continuation expectations and firstly sustaining beyond Intermediate Term trend decider 55-Day SMA(today at 19309) should be watched in the coming week for its confirmations because its turning down confirmations will mean minimum 3 weeks to 3 Months long correction and testing possibility of Long Term trend decider 200-Day SMA(today at 18346) also can not be ruled out in that situation.
Down moves towards next supports
Nifty-Intra Day Chart Analysis &
Market Outlook(25-08-2023)
Nifty-Intra Day Chart (24-Aug-2023):-

Technical Patterns formation in today intraday charts
1- Up moves after positive opening
2- Down moves with upward corrections
3- Whole day actual trading between 19370-19584
Conclusions from intra day chart analysis
Although firstly up moves after positive opening but intraday selling patterns were also seen in last 2 sessions therefore not sustaining at higher levels and down moves started which remain continued till last 15 minutes. AS all the down moves were with upward corrections therefore intraday selling will be understood and down moves continuation is expected towards next supports between 19254-19295.
Watch 19437-19472 for next intraday decisive moves beginning confirmations
Nifty-Intra Day Chart Analysis &
Market Outlook(24-08-2023)
Nifty-Intra Day Chart (23-Aug-2023):-

Technical Patterns formation in today intraday charts
1- 72 Points down in first hour after positive opening
2- Consolidation between 19367-19393
3- Up moves in Mid-session
4- Last 3 hours sideways trading between 19437-19472
5- Whole day actual trading between 19367-19472
Conclusions from intra day chart analysis
Although positive opening but intraday selling was seen yesterday therefore Nifty could not sustain and firstly 72 Points down moves were seen in first hour as well as Nifty slipped below yesterday lowest(19382). As lower levels some consolidation therefore up moves were seen in Mid-session but higher levels 3 hours sideways trading between 19437-19472 in which one sided trading patterns were not seen therefore firstly sustaining beyond this range should be watched tomorrow for next intraday decisive moves beginning confirmations.
Down moves expectations below today lowest
Nifty-Intra Day Chart Analysis &
Market Outlook(23-08-2023)
Nifty-Intra Day Chart (22-Aug-2023):-

Technical Patterns formation in today intraday charts
1- Whole day sideways trading between 19382-19443
2- Selling between 19407-19443
3- Whole day actual trading between 19382-19443
Conclusions from intra day
chart analysis
Following lines were told on 19-08-2023 in "Finally watch 19237 amid firstly up moves expectations towards next resistances":-
firstly up moves expectations towards above mentioned resistances.
As was told 100% same happened and:-
1- Firstly Nifty moved up 133 Points in first 2 sessions of this week
2- 1st resistance range of Nifty was given between 19394-19415 and Nifty closed within it at 19396.45 today and just below it at 19393.60 yesterday.
Although flat closing today but higher levels good intraday selling was seen between 19407-19443 during whole day sideways trading. As today closing was within and above mentioned resistance range(19394-19415) also therefore down moves are expected below today lowest(19382)
Subscribe to:
Posts (Atom)