As out of station therefore unable to post today(06-06-2023) Outlook.

ॐ ह्रीं श्रीं लक्ष्मीभयो नमः॥

Sustaining beyond 18465-18662 will
confirm next trend
Technical Analysis,Research & Weekly Outlook
(Jun 05 to Jun 09,2023)
Nifty-EOD Chart Analysis
(Corrective Waves)
Nifty-EOD Chart (02-Jun-2023):-

Technical Patterns and Formations in EOD charts
1- Impulsive Wave-(i) of Wave-[(iii)] of Wave-1 completion at 18887.6 on 01-12-2022 and Corrective Wave-A of "ABC" correction beginning.
2- Corrective Wave-A of Wave-[(ii)] of Wave-[(iii)] of Wave-1 completion at 17774.3 on 26-12-2022.
3- Corrective Wave-B of Wave-[(ii)] of Wave-[(iii)] of Wave-1 completion at 18265.3 on 30-12-2022.
4- Corrective Wave-C of Wave-[(ii)] of Wave-[(iii)] of Wave-1 completion indication with recent bottom formation at 16828.3 on 20-03-2023 because that Pull Back Rally which begun from this level is continuing strongly with recent top formation at 18662.5 on 30-05-2023.
Conclusions from EOD chart analysis
(Corrective Waves)
Corrective Wave-A of "ABC" correction begun after impulsive Wave-(i) of Wave-[(iii)] of Wave-1 completion at 18887.6 on 01-12-2022. Its Wave-A completed at 17774.3 on 26-12-2022 and from this level Wave-B started which completed at 18265.3 on 30-12-2022. Wave-C begun from this level which showed strong indications of its comletion after its bottom formations at 16828.3 on 20-03-2023 because that Pull Back Rally which begun from this level is continuing strongly with recent top formation at 18662.5 on 30-05-2023 and no confirmations of its completion yet on EOD Charts..
.
Nifty-EOD Chart Analysis
(Stochastic & MACD)
Nifty-EOD Chart (02-Jun-2023):-

Technical Patterns and Formations in EOD charts
1- Pull Back Rally beginning from 16828.3 on 20-03-2023
2- Pull Back Rally continuation with recent top formation at 18662.5 on 30-05-2023.
3- Stochastic- %K(5) line has intersected %D(3) line downward and its both lines are falling from Over bought zone.
4- Stochastic:- %K(5)- 51.42 & %D(3)- 69.27.
5- MACD- Its both lines are kissing in positive zone.
6- MACD(26,12)- 147.36 & EXP(9)- 137.57 & Divergence- 9.79
Conclusions from EOD chart analysis
(Stochastic & MACD)
Positions of Daily indicators are as follows:-
1- As in Short Term indicator Stochastic %K(5) line has intersected %D(3) line downward and its both lines are falling from Over bought zone therefore some more dowm moves can not be ruled out in the coming week.
2- As both lines of MACD are kissing in positive zone therefore this indicator is not showing any side clear direction. Let upward or downward clear cross over happen in it then that side next Trend will get confirmations. If finally upside clear cross over will develop then strong up moves will be seen because its both lines are in positive zone.
Nifty-Last 5 Sessions
intraday charts analysis
Nifty-Intra Day Chart (May 29 to Jun 02,2023):--

Technical Patterns formation in last 5 Sessions intraday charts
1- Selling(Resistances) in last 5 sessions are as follows:-
A- 18544-18580
B- 18615-18662
2- Consolidation(Supports) in last 5 sessions are as follows:-
A- 18479-18516
3- Last 5 Sessions actual trading between 18465-18662
Conclusions from 5 Sessions
intra day chart analysis
Last 5 Sessions trading between 18465-18662 with above mentioned supports and resistances. As both supports and resistances are stronger and firstly Nifty has to prepare for next decisive moves beginning beyond this 5 sessions range therefore firstly Nifty will have to trade within this range in the beginning of next week.
Finally sustaining beyond 18465-18662 should be watched in the coming week for fresh rally beginning after sustaining above 18662 and Short Term correction beginning after sustaining below 18465.
Nifty-Intra Day Chart Analysis
(02-Jun-2023)
Nifty-Intra Day Chart (02-Jun-2023):-

Technical Patterns formation in today intraday charts
1- 94 Points sharp fall in first hour after strong opening
2- Consolidation between 18479-18516
3- Up moves with downward corrections
4- Volatility in last 2 hours between 18495-18566
5- Whole day actual trading between 18479-18573
Conclusions from intra day chart analysis
Although firstly 94 points sharp fall in first hour after strong opening but after that lower levels consolidation developed and follow up consolidation was also seen in Mid-session through up moves with downward corrections therefore firstly up moves are expected in the beginning of next week. As volatility in last 2 hours between 18495-18566 and technical positions reverses also during such volatility therefore firstly sustaining beyond this range should also be watched in the beginning of next week amid rally continuation expectations.
Conclusions (After putting all studies together)
1- Short Term Trend is sideways between 18465-18662
2- Intermediate Term Trend is up.
3- Long Term Trend is up.
Impulsive Wave-(i) of Wave-[(iii)] of Wave-1 completed at 18887.6 on 01-12-2022 and Corrective Wave-A of "ABC" correction started. Its Wave-C completion strong indications developed at 16828.3 on 20-03-2023 because the Pull Back Rally which started from this level has proved stronger after gaining 1834.2 points(10.89%) from Wave-C lower levels and no confirmation of its completion yet on EOD charts.
Although Short term indicator Stochastic is showing more down moves signals but intraday charts of last Friday are suggesting up moves in the beginning of next week therefore firstly sustaining beyond above mentioned resistances should be watched for the life and length of expected up moves. As finally sustaining beyond last 5 sessions trading range(18465-18662) will confirm fresh rally towards and above life time highest(18887.6) or Short Term correction towards following next supports therefore firstly should be watched in the coming week/weeks for its confirmations:-
1- 18419-18445
2- 18373-18397
3- 18325-18353
4- 18203-18261
5- 18059-18127
As finally sustaining beyond 18465-18662 will confirm next trend towards above mentioned levels therefore should be firstly watched in next week.
Watch yesterday lowest & immediate Resistances after loosing all 86 points gains in first hour
Post-open Outlook(02-06-2023)
As all the Asian markets were trading with good gains and most were more than 1% up as well as Hang Seng was more than 3 % up after strong closing of all US markets yesterday therefore Indian markets opened positive and firstly traded 86 points up.
More than 4 hours selling was seen between 18544-18580 yesterday and it was immediate resistances of Nifty therefore Nifty moved down sharply in first hour and now trading in Red after loosing all 86 points intraday gains.
Although Bullish Global markets but firstly Indian markets will have to prepare technically for decisive up moves beginning therefore firstly sustaining beyond yesterday lowest(18465) and immediate resistances of Nifty(18544-18580) should be watched today and in the coming sessions for the life and length of on going correction in Indian markets.
Watch next supports for the life & length of on going Short Term correction
Nifty-Intra Day Chart Analysis &
Market Outlook(02-06-2023)
Nifty-Intra Day Chart (01-Jun-2023):-

Technical Patterns formation in today intraday charts
1- More than 4 hours selling between 18544-18580(immediate Resistances)
2- Down moves with upward corrections
3- Sharp fall in last half hour
4- Whole day actual trading between 18465-18580
Conclusions from intra day chart analysis
Following lines were told on 29-05-2023 in "Firstly watch next supports amid down moves expectations towards it":-
down moves expectations towards next
supports between 18419-18445.
Following lines were told on 30-05-2023 in "Down moves towards next supports":-
down moves are expected below today lowest and towards yesterday mentioned next supports(18419-18445)
As was told 100% same happened and Down moves were seen in last 2 sessions with today lowest formations at 18464.55 today which was little above in last 2 sessions mentioned next supports.
As firstly more than 4 hours selling and after that down moves with upward corrections in Mid-session therefore sharp fall was seen in last half hour today. More than 5 hours clear selling patterns formations therefore correction continuation is expected towards next supports. Finally sustaining beyond following next supports should be watched in the coming sessions for the life and length of on going Short Term correction:-.
1- 18419-18445
2- 18373-18397
Down moves towards next supports
Nifty-Intra Day Chart Analysis &
Market Outlook(31-05-2023)
Nifty-Intra Day Chart (30-May-2023):-

Technical Patterns formation in today intraday charts
1- Sharp up moves from lower levels
2- Selling between 18628-18662
3- Up moves in Bearish Rising Channel
4- Selling between 18631-18647
5- Whole day actual trading between 18576-18662
Conclusions from intraday
chart analysis
Although firstly slipping after flat opening but immediately after that sharp up moves were seen from lower levels. As higher levels selling and after that follow follow up selling in Mid-sessions and last hour also therefore down moves are expected below today lowest and towards yesterday mentioned next supports(18419-18445) despite positive closing today after most time positive zone trading.
Firstly watch next supports amid
down moves expectations towards it
Nifty-Intra Day Chart Analysis &
Market Outlook(30-05-2023)
Nifty-Intra Day Chart (29-May-2023):-

Technical Patterns formation in today intraday charts
1- Selling between 18615-18641(immediate Resistances)
2- Down moves
3- Support between 18585-18593
4- Up moves in Bearish Rising Channel
5- Down moves
6- Support between 18582-18597
7- Whole day actual trading between 18582-18641
Conclusions from intra day chart analysis
Following lines were told on 27-05-2023 in "Finally fresh rally towards & above life time highest after volatility within supports & resistances":-
firstly up moves are expected towards following next resistances in the beginning of next week:-
1- 18559-18586
2- 18674-18696
3- 18832-18854
As was told 100% same happened today and whole day positive zone trading was seen and Nifty closed 99.30 points up today.
Although gap up strong opening today but higher levels continuous selling developed therefore down moves were seen again and again from intraday higher levels. As minor supports at lower levels also therefore sustaining below today lowest should also be firstly watched tomorrow amid down moves expectations towards next supports between 18419-18445. Sustaining beyond this supports range should be firstly watched in the coming sessions for next decisive moves beginning confirmations.
Finally fresh rally towards & above
life time highest after volatility
within supports & resistances
Technical Analysis,Research & Weekly Outlook
(May 29 to Jun 02,2023)
Nifty-EOD Chart Analysis
(Waves structure)
Nifty-EOD Chart (26-May-2023):-

Technical Patterns and Formations in EOD charts
1- Corrective Wave-C of "ABC correction" completion at 15183.4 on 17-06-2022 and Impulsive Wave-1 of new Waves structure beginning.
2- Impulsive Wave-[(i)] of Wave-1 completion at 18096.2 on 15-09-2022.
3- Corrective Wave-[(ii)] of Wave-1 completion at 16747.7 on 30-09-2022.
4- Impulsive Wave-(i) of Wave-[(iii)] of Wave-1 completion at 18887.6 on 01-12-2022 and Corrective Wave-A of "ABC" correction begining.
5- Corrective Wave-A of Wave-[(ii)] of Wave-[(iii)] of Wave-1 completion at 17774.3 on 26-12-2022.
6- Corrective Wave-B of Wave-[(ii)] of Wave-[(iii)] of Wave-1 completion at 18265.3 on 30-12-2022.
7- Corrective Wave-C of Wave-[(ii)] of Wave-[(iii)] of Wave-1 completion strong indications after its recent bottom formation at 16828.3 on 20-03-2023.
8- Pull Back Rally continuation with recent top formation at 18508.55 on 26-05-2023.
Conclusions from EOD chart analysis
(Waves structure)
Impulsive Wave-1 of new Waves structure started from 15183.4 on 17-06-2022 after corrective Wave-C of "ABC correction" of previous Waves structure completion at this level. Impulsive Wave-[(i)] of Wave-1 completed at 18096.2 on 15-09-2022 and Corrective Wave-[(ii)] of Wave-1 started which completed at 16747.7 on 30-09-2022 and from this levels impulsive Wave-[(iii)] of Wave-1 begun.
Impulsive Wave-(i) of Wave-[(iii)] of Wave-1 completed at 18887.6 on 01-12-2022 and Corrective Wave-A of "ABC" correction begun. Now corrective Wave-C is in continuation with recent bottom formation at 16828.3 on 20-03-2023 and strongest signals of its completion have developed after 1680.25 points(9.98%) recovery from lower levels.
Nifty-EOD Chart Analysis
(Stochastic & MACD)
Nifty-EOD Chart (26-May-2023):-

Technical Patterns and Formations in EOD charts
1- Pull Back Rally beginning from 16828.3 on 20-03-2023.
2- Pull Back Rally continuation with recent top formation at 18508.55 on 26-05-2023.
3- Stochastic- %K(5) line has intersected %D(3) line upward and its both lines are rising towards Over bought zone.
4- Stochastic:- %K(5)- 77.46 & %D(3)- 73.17.
5- In MACD- MACD line has intersected Average line downward and its both lines are falling in positive zone.
6- MACD(26,12)- 106.60 & EXP(9)- 205.20 & Divergence- -98.6
Conclusions from EOD chart analysis
(Stochastic & MACD)
Positions of Daily indicators are as follows:-
1- As in Short Term indicator Stochastic %K(5) line has intersected %D(3) line upward and its both lines are rising towards Over bought zone therefore this indicator is suggesting more up moves possibilities because it has not developed Overbought yet.
2- As in MACD its MACD line has intersected Average line downward and its both lines are falling in positive zone therefore this indicator is indicating Very Short Term downward trend formation possibilities because its both lines are in positive zone.
Conclusion from indicators is that firstly limited up moves will develop and after that limited down moves be seen
Nifty-Intra Day Chart Analysis
(26-May-2023)
Nifty-Intra Day Chart (26-May-2023):-
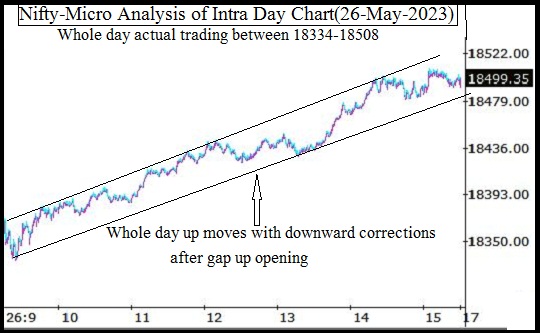
Technical Patterns formation in today intraday charts
1- Whole day up moves with downward corrections after gap up opening
2- Whole day actual trading between 18334-18508
Conclusions from intra day chart analysis
As whole day up moves with downward corrections after gap up opening and intraday selling patterns were not seen as well as last Friday closing was at the top of the day therefore on going rally continuation is expected in the beginning of next week.
Conclusions
(After putting all studies together)
All the trends are up. Pull Back rally continuation and no indication of its completion yet on EOD and Intraday charts therefore firstly up moves are expected towards following next resistances in the beginning of next week:-
1- 18559-18586
2- 18674-18696
3- 18832-18854
As Short Term Indicators are suggesting a Short Term correction possibility also and that may be seen after some up moves towards following next supports in the coming week therefore should be watched for fresh rally beginning towards and above life time highest(18887.6) after Short Term correction completion:-
1- 18419-18445
2- 18373-18397
3- 18325-18353
4- 18203-18261
5- 18059-18127
Expected that finally fresh rally will be seen towards and above life time highest(18887.6) in the coming week/weeks after volatility within above mentioned supports and resistances.
Up moves continuation towards
next resistances
Nifty-Intra Day Chart Analysis &
Market Outlook(26-05-2023)
Nifty-Intra Day Chart (25-May-2023):-

Technical Patterns formation in today intraday charts
1- Down moves after negative opening
2- Consolidation in Mid-session between 18203-18261
3- Up moves in last hours
4- Whole day actual trading between 18203-18338
Conclusions from intra day
chart analysis
When Nifty closed at 18348 with 33 points gains on 23-05-2023 then we told following lines on 23-05-2023 in "18232 will confirm today started correction continuation/completion":-
1- firstly down moves are expected towards 18232.
2- sustaining it beyond should be firstly watched tomorrow for today started correction continuation/completion.
As was told 100% same happened and:-
1- Nifty slipped 143 points in last 2 sessions.
2- Nifty got supports just below 18232 at 18202.40 today before recovering 133 points from this level to 18336.
Although firstly down moves were seen after negative opening today but lower levels good intraday consolidation in Mid-session therefore up moves developed in last hours and its continuation is expected in the coming sessions towards next resistances between 18390-18419.
18232 will confirm today started correction continuation/completion
Nifty-Intra Day Chart Analysis & Market
Outlook(24-05-2023)
Nifty-Intra Day Chart (23-May-2023):-

Technical Patterns formation in today intraday charts
1- Up moves after positive opening
2- Selling between 18390-18419
3- Down moves in last hour
4- Whole day actual trading between 18325-18419
Conclusions from intra day chart analysis
Although firstly up moves after positive opening but more than 4 hours selling therefore down moves were seen in last hour. As only selling paterns formations and consolidation was not seen today therefore firstly down moves are expected towards 18232 and sustaining it beyond should be firstly watched tomorrow for today started correction continuation/completion.
Sustaining beyond 18232-18335 will
confirm next decisive moves beginning
Nifty-Intra Day Chart Analysis &
Market Outlook(23-05-2023)
Nifty-Intra Day Chart (22-May-2023):-

Technical Patterns formation in today intraday charts
1- Up moves after flat opening
2- Whole day trading with mixed Patterns formation between 18232-18335
3- Whole day actual trading between 18179-18335
Conclusions from intra day
chart analysis
Although firstly up moves after flat opening but after that whole day today trading was with mixed Patterns formation between 18232-18335 therefore Nifty will firstly trade and prepare for next decisive moves within or near about this range. As finally sustaining beyond 18232-18335 will confirm next decisive moves beginning therefore should befirstly watched tomorrow for its confirmations.
Finally last 14 sessions trading range break out/down will confirm next Trend
Technical Analysis,Research & Weekly Outlook
(May 22 to May 26,2023)
Nifty-EOD Chart Analysis
(Corrective Waves)
Nifty-EOD Chart (19-May-2023):-

Technical Patterns and Formations in EOD charts
1- Impulsive Wave-(i) of Wave-[(iii)] of Wave-1 completion at 18887.6 on 01-12-2022 and Corrective Wave-A of "ABC" correction beginning.
2- Corrective Wave-A of Wave-[(ii)] of Wave-[(iii)] of Wave-1 completion at 17774.3 on 26-12-2022.
3- Corrective Wave-B of Wave-[(ii)] of Wave-[(iii)] of Wave-1 completion at 18265.3 on 30-12-2022.
4- Corrective Wave-C of Wave-[(ii)] of Wave-[(iii)] of Wave-1 completion indication with recent bottom formation at 16828.3 on 20-03-2023.
5- Pull Back Rally continuation with recent top formation at 18458.9 on 15-05-2023.
6- Short Term correction continuation with recent bottom formation at 18060.40 on 19-05-2023
7- Last 14 sessions sideways trading between 18043-11458.
Conclusions from EOD chart analysis
(Corrective Waves)
Corrective Wave-A of "ABC" correction started after impulsive Wave-(i) of Wave-[(iii)] of Wave-1 completion at 18887.6 on 01-12-2022. Wave-A completed at 17774.3 on 26-12-2022 and from this level Wave-B started which completed at 18265.3 on 30-12-2022 and Wave-C begun.
Although no confirmation of Wave-C completion yet but strong indications of its completion have developed on EOD Charts because the Pull Back Rally which started from its lowest at 16828.3 on 20-03-2023) has gained gained 1630.6 points(9.68%) from Wave-C lower levels and no confirmation of its completion yet. Now Short Term correction of Pull Back Rally is on with its recent bottom formation at 18060.40 on 19-05-2023 and no confirmation of its completion yet also but Bullish Hammer Daily Candle fomations last Friday therefore first signal of its completion will be understood but confirmations are still required.
Last 14 sessions sideways trading between 18043-11458 in which firstly 6 sessions up moves were seen and down moves developed in last 4 sessions and previous week closing was 160 points above the lower levels of last 14 sessions. As finally sustaining beyond this range will confirm next Short to Intermediate Term next Trend therefore it should be firstly watched in the coming week/weeks
Nifty-EOD Chart Analysis
(Stochastic & MACD)
Nifty-EOD Chart (19-May-2023):-

Technical Patterns and Formations in EOD charts
1- Pull Back Rally beginning from 16828.3 on 20-03-2023
2- Pull Back Rally continuation with recent top formation at 18458.9 on 15-05-2023.
3- Short Term correction continuation with recent bottom formation at 18060.40 on 19-05-2023
4-
5- Stochastic- %K(5) line has intersected %D(3) line downward and its both lines are falling towards Over sold zone.
6- Stochastic:- %K(5)- 20.77 & %D(3)- 28.32.
7- MACD- Its both lines are kissing in positive zone.
8- MACD(26,12)- 234.23 & EXP(9)- 281.43 & Divergence- -47.2
Conclusions from EOD chart analysis
(Stochastic & MACD)
Positions of Daily indicators are as follows:-
1- As in Short Term indicator Stochastic %K(5) line has intersected %D(3) line downward and its both lines are falling towards Over sold zone therefore some more nut limited down moves can not be ruled out.
2- As both lines of MACD are kissing in positive zone therefore it will be understood that at present this indicator is not suggesting any side direction. Let upward or downward clear cross over develop in it then that side next Trend will be understood.
Nifty-Last 14 Sessions
intraday charts analysis
Nifty-Intra Day Chart (May 02 to May 19,2023):-

Technical Patterns formation in last 14 Sessions intraday charts
1- Last 14 Sessions Resistances above last Friday closing are as follows:-
A- 18222-18297
B- 18302-18337
C- 18340-18366
D- 18429-18458
2- Last 14 Sessions Supports below last Friday closing are as follows:-
A- 18059-18127
3- Last 14 Sessions actual trading between 18043-18458
Conclusions from 14 Sessions
intra day chart analysis
Last 14 Sessions trading between 18043-18458 with above mentioned supports and resistances. Although finally sustaining beyond last 14 sessions trading range will confirm next trend and big moves also but resistances are stronger than supports and last Friday lowest(18060.40) was little above last 14 sessions lowest(18043) therefore firstly sustaining it beyond should be watched in the coming week for next Short/Intermediate Term and big moves beginning indications and confirmations one by one.
Nifty-Intra Day Chart Analysis
(19-May-2023)
Nifty-Intra Day Chart (19-May-2023):-

Technical Patterns formation in today intraday charts
1- Firstly 125 points fall after positive opening
2- More than 4 hours consolidation between 18061-18127(immediate supports)
3- Up moves with downward corrections in last hours
4- Whole day actual trading between 18061-18218
Conclusions from intra day chart analysis
Although firstly 125 points fall after positive opening last Friday but more than 4 hours consolidation was seen between 18061-18127 therefore this range will be immediate supports of Nifty. As up moves with downward corrections also developed in last hours and it is an indication of follow up consolidation as well therefore firstly up moves are expected in the beginning of next week. Until Nifty will not sustain below last Friday lowest(18061) after complete fresh selling till then decisive down moves will not be seen.
Conclusions
(After putting all studies together)
1- Short Term Trend is down.
2- Intermediate Term Trend is up.
3- Long Term Trend is up.
Impulsive Wave-1 of new Waves structure started from 15183.4 on 17-06-2022 and its impulsive Wave-(i) of Wave-[(iii)] of Wave-1 completed at 18887.6 on 01-12-2022. Then corrective Wave-A of "ABC" correction begun and finally its corrective Wave-C completion indications developed after its bottom formation at 16828.3 on 20-03-2023 because from this level strong Pull Back Rally was seen which gained 1630.6 points(9.68%) after its recent top formation at 18458.9 on 15-05-2023.
Short Term correction of Pull Back Rally developed in previous week which is also in continuation and no confirmation of its completion yet. As Bullish Hammer Candle formation with good intraday consolidation patterns formations in last Friday in EOD and intraday charts therefore firstly up moves are expected towards above mentioned resistances in next week. As resistances are stronger than supports in last 14 sessions sideways trading therefore until Nifty will not sustain above last 14 sessions highest(18458) after complete fresh consolidation till then fresh up moves will not be seen above it ie above the top of on going Pull Back Rally.
As finally sustaining beyond last 14 sessions trading range(18043-18458) will confirm deeper correction beginning below 18043 and fresh rally beginning above 18458 therefore firstly should be watched in the coming week/weeks for its confirmations.
Next resistances above last 14 sessions highest are as follows which should be watched after upward break out above 18458:-
1- 18559-18586
2- 18674-18696
3- 18832-18854
Next supports below last 14 sessions lowest are as follows which should be watched after downward break down below 18043:-
1- 17937-17988
2- 17886-17922
3- 17712-17803
4- 17613-17646
5- 17503-17541
Watch next supports for the life & length
of on going correction
Nifty-Intra Day Chart Analysis &
Market Outlook(19-05-2023)
Nifty-Intra Day Chart (18-May-2023):-

Technical Patterns formation in today intraday charts
1- Selling between 18222-18297
2- Selling between 18140-18219
3- Sharp fall in last half hour
4- Whole day actual trading between 18105-18297
Conclusions from intra day chart analysis
Although positive opening but selling developed and follow up selling was seen in Mid-sessions also therefore sharp fall in last half hour. As only intraady selling patterns formations today hence more down moves are expected in the coming sessions and firstly sustaining beyond next supports rane(17937-17988) should be watched in the coming sessions for the life and length of on going correction.
Down moves towards next supports
Nifty-Intra Day Chart Analysis &
Market Outlook(17-05-2023)
Nifty-Intra Day Chart (16-May-2023):-

Technical Patterns formation in today intraday charts
1- More than 5 hours selling between 18340-18432
2- Down moves in last hour
3- Whole day actual trading between 18265-18432
Conclusions from intra day chart analysis
Following lines were told yesterday in "Down Moves expectations below today lowest":-
down moves are expected below today
lowest(18288) in the coming sessions.
As was told 100% same happened and:-
1- Nifty closed 112 Points down today
2- Down moves were seen below yesterday lowest(18288) and today lowest formations was at 18264.35.
Although positive opening today but selling developed which remained continued more than 5 hours therefore down moves were seen in last hour and today closing was near the lower levels of the day. As whole day good intraday selling today therefore more down moves are expected below today lowest and towards next supports between 18144-18206.
Down Moves expectations
below today lowest
Nifty-Intra Day Chart Analysis &
Market Outlook(16-05-2023)
Nifty-Intra Day Chart (15-May-2023):-

Technical Patterns formation in today intraday charts
1- Whole day up moves in Bearish Rising Channel
2- Sharp fall
3- Whole day actual trading between 18288-18458
Conclusions from intra day chart analysis
As all the Asian markets were trading with good gains and Dow Jones Futures was also more than 100 points up today morning therefore Indian markets starts to move up after flat opening which remain continued til 02:30 PM. Although today closing was with 84 points gains but whole day up moves were in Bearish Rising Channel therefore sharp fall was seen in last hour and down moves are expected below today lowest(18288) in the coming sessions.
Firstly watch next supports amid
high possibility of Short Term
correction beginning
Technical Analysis,Research & Weekly Outlook
(May 15 to May 19,2023)
Nifty-EOD Chart Analysis
(Waves structure)
Nifty-EOD Chart (12-May-2023):-

Technical Patterns and Formations in EOD charts
1- Corrective Wave-C of "ABC correction" completion at 15183.4 on 17-06-2022 and Impulsive Wave-1 of new Waves structure beginning.
2- Impulsive Wave-[(i)] of Wave-1 completion at 18096.2 on 15-09-2022.
3- Corrective Wave-[(ii)] of Wave-1 completion at 16747.7 on 30-09-2022.
4- Impulsive Wave-(i) of Wave-[(iii)] of Wave-1 completion at 18887.6 on 01-12-2022 and Corrective Wave-A of "ABC" correction begining.
5- Corrective Wave-A of Wave-[(ii)] of Wave-[(iii)] of Wave-1 completion at 17774.3 on 26-12-2022.
6- Corrective Wave-B of Wave-[(ii)] of Wave-[(iii)] of Wave-1 completion at 18265.3 on 30-12-2022.
7- Corrective Wave-C of Wave-[(ii)] of Wave-[(iii)] of Wave-1 completion indication with recent bottom formation at 16828.3 on 20-03-2023.
8- Pull Back Rally continuation with recent top formation at 18389.7 on 11-05-2023.
Conclusions from EOD chart analysis
(Waves structure)
Corrective Wave-C of "ABC correction" of previous Waves structure completed at 15183.4 on 17-06-2022 and from this level Impulsive Wave-1 of new Waves structure started. Impulsive Wave-[(i)] of Wave-1 completed at 18096.2 on 15-09-2022 and Corrective Wave-[(ii)] of Wave-1 begun which completed at 16747.7 on 30-09-2022.
Impulsive Wave-(i) of Wave-[(iii)] of Wave-1 completed at 18887.6 on 01-12-2022 and Corrective Wave-A of "ABC" correction started. Now corrective Wave-C is in continuation with recent bottom formation at 16828.3 on 20-03-2023 and no confirmation of its completion yet but strongest signals of its completion have emerged after 1561.4 points(9.27%) recovery from lower levels.
Nifty-EOD Chart Analysis
(Stochastic & MACD)
Nifty-EOD Chart (12-May-2023):-

Technical Patterns and Formations in EOD charts
1- Stochastic- Its both lines are kissing in Over bought zone.
2- Stochastic:- %K(5)- 78.77 & %D(3)- 80.82.
3- Stochastic is showing negative divergence
4- MACD- Its both lines are kissing in positive zone.
5- MACD(26,12)- 301.64 & EXP(9)- 279.90 & Divergence- 21.74
6- MACD is showing negative divergence
Conclusions from EOD chart analysis
(Stochastic & MACD)
Positions of Daily indicators are as follows:-
1- As both lines of Short Term indicator Stochastic are kissing in Over bought zone and this indicator is showing negative divergence also therefore suggesting strongest indications of Short Term correction beginning.
2- As both lines of MACD are kissing in positive zone and this indicator is showing negative divergence as well therefore indicating Short Term correction beginning possibility.
Indicators are suggesting that Short Term correction is on cards which may begin any day in the coming week/weeks.
Nifty-Last 4 Sessions
intraday charts analysis
Nifty-Intra Day Chart (May 09 to May 12,2023):-

Technical Patterns formation in last 4 Sessions intraday charts
1- Selling(Resistances) in last 4 Sessions are as follows:-
A- 18318-18389
2- Consolidation(Supports) in last 4 Sessions are as follows:-
A- 18261-18389
3- Last 4 Sessions actual trading between 18195-18389
Conclusions from 4 Sessions
intra day chart analysis
Last 4 Sessions trading between 18195-18389 with above mentioned supports and resistances. As resistances seems much stronger than supports and selling was seen in previous 2 sessions at the higher levels of last 4 sessions also therefore firstly down moves are expected towards and below the lowest(18195) of last 4 sessions in the beginning of next week.
Conclusions
(After putting all studies together)
1- Short Term Trend is sideways for the last 4 sessions.
2- Intermediate Term Trend is up.
3- Long Term Trend is up.
Pull Back rally continuation strongly and no confirmation of its completion yet on EOD charts but Short Term correction beginning signals have developed in indicators and intraday charts of previous weeks have shown selling patterns formations also therefore Short Term correction may begin any day in the coming week/weeks which may be deeper also because Indicators have started to show negative divergence as well. Firstly sustaining beyond following next supports should be watched in next week one by one in the coming week amid high possibility of Short Term correction beginning:-
1- 18261-18389
2- 18144-18206
3- 17937-17988
4- 17886-17922
5- 17712-17803
6- 17613-17646
7- 17503-17541
Next resistances above previous week closing are as follows which should be watched after expected correction completion:-
1- 18318-18389
2- 18559-18586
3- 18674-18696
4- 18832-18854
Down moves below 18271
Nifty-Intra Day Chart Analysis &
Market Outlook(12-05-2023)
Nifty-Intra Day Chart (11-May-2023):-

Technical Patterns formation in today intraday charts
1- 92 Points fall in first 30 minutes after positive opening
2- Selling patterns formations between 18315-18346
3- Whole day actual trading between 18271-18389
Conclusions from intra day chart analysis
Although positive opening but after that 92 Points fall in first 30 minutes and clear selling patterns formations between 18315-18346 therefore down moves are expected in the coming session below day's lowest(18271).
Watch 18249-18286 for next intraday decisive moves beginning confirmations
Nifty-Intra Day Chart Analysis &
Market Outlook(09-05-2023)
Nifty-Intra Day Chart (08-May-2023):-

Technical Patterns formation in today intraday charts
1- Up moves with downward corrections
2- Sideways trading in last 3 hours between 18249-18286
3- Whole day actual trading between 18101-18286
Conclusions from intra day chart analysis
Al Dow jones closed with more than 400 points gains last Friday therefore all the Asian markets were in Green today morning hence sentiment turned Bullish and Indian markets opened positive as well as up moves started which remained continued till 02:00 PM. Although up moves were with downward corrections and follow up continuous consolidation will be understood but sideways trading in last 3 hours between 18249-18286 therefore firstly sustaining beyond this range should be watched tomorrow for next intraday decisive moves beginning confirmations.
Subscribe to:
Posts (Atom)