As busy therefore Stock Market Outlook of today(19-10-2021) is not being updated.

ॐ ह्रीं श्रीं लक्ष्मीभयो नमः॥

Live Proofs of our "100% accurate Indian Stock markets predictions"
"Nifty above 18000 before
DIWALI-2021"
was told only by us in whole world on 16-11-2020 in "DIPAWALI ISSUE(2020) of The Economic Revolution" when previous closing of Nifty was at 12643.90 on 10-11-2020 & Nifty highest was at 18350.75 on 14-10-2021.
In "English" edition of "The Economic Revolution"

In "Gujarati" edition of "The Economic Revolution"

Nifty above 18000 till Diwali-2021
Above topic was posted in our this Blog also on 11-11-2020.
Just click following topic link of our this Blog and see live proofs of our "100% accurate prediction of Nifty above 18000" on yours own .
Remain cautious because maximum target of Nifty is at 18793.00
Technical Analysis,Research & Weekly
Outlook(Oct 18 to Oct 22,2021)
Nifty-EOD Chart Analysis
(Waves structure)
Nifty-EOD Chart(14-Oct-2021):-

Technical Patterns and Formations in EOD charts
1- Corrective Wave-C completion and Impulsive Wave-1 beginning from 7511.10 on 24-03-2020
2- Impulsive Wave-1 completion at 11794.30 on 31-08-2020
3- Wave-1 gained 4283.20 points
4- Corrective Wave-2 completion at 10790.20 on 24-09-2020
5- Impulsive Wave-3 completion at 15431.8 on 16-02-2021
6- Wave-3 gained 4641.60 points
7- Corrective Wave-4 completion at 14151.4 on 22-04-2021
8- Impulsive Wave-5 continuation with recent high and new life time top formation at 18350.75 on 14-10-2021
Conclusions from EOD chart analysis
(Waves structure)
Impulsive Wave-5 continuation with recent high and new life time top formation in previous session at 18350.75 on 14-10-2021 and no signal of Wave-5 completion yet on EOD chartS.
Nifty-EOD Chart Analysis
(Stochastic & MACD)
Nifty-EOD Chart (14-Oct-2021):-

Technical Patterns and Formations in EOD charts
1- Impulsive Wave-5 continuation with recent high and new life time top formation at 18350.75 on 14-10-2021
2- Stochastic- %K(5) is at 92.54 & %D(3) is at 87.58 and its both lones are rising in Over bought zone.
3- In MACD- MACD line has intersected Average line upward. Its MACD line has started to move up while its Average line is moving flat in positive zone.
4- MACD is showing negative divergence
Conclusions from EOD chart analysis
(Stochastic & MACD)
Although strong rally continuation but Short Term indicator Stochastic is completely overbought therefore it will be understood that Short Term correction is on cards and it may be seen in next week.
As strong rally continuation therefore MACD line has intersected Average line upward in MACD indicator but MACD is showing negative divergence and its Average line is moving flat also therefore some more confirmation is required for upward trend formations in this indicator.
Nifty-Intra Day Chart Analysis
(14-Oct-2021)
Nifty-Intra Day Chart (14-Oct-2021):-

Technical Patterns formation in today intraday charts
1- Consolidation between 18255-18291
2- Down moves in Bullish Falling Channel
3- Up moves with downward corrections
4- Whole day actual trading between 18248-18350
Conclusions from intra day chart analysis
As firstly sideways trading consolidation and after that till end of the day follow up consolidation through Down moves in Bullish Falling Channel and Up moves with downward corrections therefore whole day last Thursday trading will be understood with good intraday consolidation and resultant up moves above day highest(18350) will be seen in the beginning of next week.
Conclusions (After putting all studies together)
Bullish rally continuation and all the trends are up as well as no indication of its completion yet on intraday and EOD charts patterns.
As EOD,Weekly and Monthly indicators have turned Overbought and many of them are showing negative divergence also therefore view should be cautious because Short,Intermediate and/or Long Term correction may begun any day after selling patterns formations on EOD and intraday charts because indicators are such high Overbought.
Nifty highest at 18350.75 was formed on 14-10-2021 and as per above given Waves structure its maximum target is at 18793,its calculations are as follows:-
As per Elliott Wave theory "Wave-3 should not be shorter than both Wave-1 and Wave-5. Now impulsive Wave-5 is on and it should not gain more points than Wave-3 has gained.
Impulsive Wave-1 gained=4283.20 points(11794.30-7511.10)
Impulsive Wave-3 gained=4641.60 points(15431.80-10790.20)
Impulsive Wave-5 has gained 3796.25 points till 24-09-2021(17947.65-14151.40)
As according to Elliott Wave theory Wave-5 can not gain more points than Wave-3 gained therefore on going impulsive Wave-5 will gain lesser points than 4641.60.
Impulsive Wave-5 started from 14151.4 on 22-04-2021 and it has to gain less than 4641.60 points therefore maximum target of on going impulsive Wave-5 is 18793.00(14151.40+4641.60)
As Nifty has travelled upto 18350.75 till last Thursday(14-10-2021) and as per present Waves structure its maximum target is at 18793.00 therefore remain cautious and if clear selling patterns develop on intraday and EOD Charts then correction should be considered according to the weightage,size and duration of selling patterns formations.
It should also be kept in mind that As per Eliot Waves theory Waves structure will be recalculated after Nifty moving above 18793.00 and till then trading policies should be above given Nifty Waves structure.
Rally continuation expectations amid higher levels Profit booking possibilities
Nifty-Intra Day Chart Analysis &
Market Outlook(14-10-2021)
Nifty-Intra Day Chart (13-Oct-2021):-

Technical Patterns formation in today intraday charts
1- Whole day up moves with downward corrections
2- Whole day actual trading between 18051-18197
Conclusions from intra day chart analysis
As whole day up moves with downward corrections and selling patterns were not seen therefore rally continuation is expected but Short Term indicators have turned over bought hence remain cautious and sustaining above today highest(18197) should also be watched because some higher levels Profit booking can not be ruled out in today like heated sentiments.
Rally towards life time highest
Nifty-Intra Day Chart Analysis &
Market Outlook(13-10-2021)
Nifty-Intra Day Chart (12-Oct-2021):-

Technical Patterns formation in today intraday charts
1- Consolidation between 17865-17942
2- Consolidation between 17860-17980
3- Whole day actual trading between 17865-18008
Conclusions from intra day chart analysis
Although firstly slipping but good consolidation was seen after 10:30 AM therefore today closing was near the top of the day and expected that on going rally will reain continued towards life time highest(18042) tomorrow and sustaining above it will confirm fresh rally.
Firstly watch 18000 for next
decisive moves
Nifty-Intra Day Chart Analysis &
Market Outlook(12-10-2021)
Nifty-Intra Day Chart (11-Oct-2021):-

Technical Patterns formation in today intraday charts
1- Up moves after weak opening
2- Selling between 17980-18041
3- Down moves in last hours
4- Whole day actual trading between 17840-18041
Conclusions from intra day chart analysis
Although weaker opening but strong up moves started which crossed 18000 first time today. As selling developed above 18000 and selling patterns were seen between 17980-18041 therefore down moves begun which remain continued till last minutes and Nifty closed after loosing almost 100 points from higher levels.
As good selling above 18000 today therefore if follow up selling develops tomorrow also then sharp down moves well be seen and for its confirmations firstly sustaining beyond 18000 should be watched tomorrow for fresh rally above 18000 and Short Term correction below it.
Rally continuation except
minor correction possibility
Technical Analysis,Research &
Weekly Outlook(Oct 11 to Oct 14,2021)
Nifty-EOD Chart Analysis
(Averages,Stochastic & MACD)
Nifty-EOD Chart (08-Oct-2021):-

Technical Patterns and Formations in EOD charts
1- Impulsive Wave-5 continuation with recent high and new life time top formation at 17947.65 on 24-09-2021
2-Averages
A- 5-Day SMA is today at 17769
B- 21-Day SMA is today at 17634
3- Stochastic- %K(5) is at 69.98 & %D(3) is at 69.25 and its both lones are kissing just below Over bought zone.
4- In MACD- MACD line has intersected Average line downward and its both lines are moving downward in positive zone.
5- MACD is showing negative divergence
6- Doji Candle formation last Friday
Conclusions from EOD chart analysis
(Averages,Stochastic & MACD)
Nifty got supports at 21-Day SMA on 01-10-2021 and after that strong rally was seen as well as last Friday closing was above all the Short Term Averages.
As in Stochastic both its lines are kissing just below Over bought zone therefore has shown 1st indication of Short Term correction beginning but selling patterns have not developed on EOD charts yet therefore let it happen then Short Term correction will be seen.
As in MACD both lines are falling in positive zone after MACD line downward intersection of Average line and it is showing negative divergence also therefore suggesting Downward trend beginning possibilities but selling patterns have not been developed on EOD charts yet hence let it happen the decisive down moves will be seen.
Nifty-Last 11 Sessions
intraday charts analysis
Nifty-Intra Day Chart (Sep 24 to Oct 08,2021):-

Technical Patterns formation in last 11 Sessions intraday charts
1- Selling(Resistances) in last 11 Sessions are as follows:-
A- 17907-17943
B- 17852-17890
2- Consolidation(Supports) in last 11 Sessions are as follows:-
A- 17641-17704
B- 17453 47516
4- Last 11 Sessions actual trading between 17453-17947
Conclusions from 11 Sessions
intra day chart analysis
Last 11 Sessions trading between 17453-17947 with above mentioned lower levels supports and higher levels resistances within it.
As Nifty traded almost whole day last Friday within above mentioned both resistance ranges and closed below 1st resistance range but above 2nd resistance range therefore firstly sustaining beyond or forceful break out of both resistance ranges(17852-17943)should be watched in next week for first strong signal of next decisive moves beginning as well as its confirmation will be sustaining beyond last 11 Sessions trading range(17453-17947).
Nifty-Intra Day Chart
Analysis(08-Oct-2021)
Nifty-Intra Day Chart (08-Oct-2021):-

Technical Patterns formation in today intraday charts
1- Down moves in Bullish Falling Channels
2- Selling between 17917-17941
3- Sharp fall
4- Up moves with downward corrections
5- Whole day actual trading between 17841-17941
Conclusions from intra day
chart analysis
Although last Friday closing was at life time highest but some intraday selling was also seen at higher levels. As lower levels consolidation patterns have also developed therefore expected that Nifty will firstly trade within last Friday trading range((17841-17941)) in the beginning of next week and will prepare for next decisive moves within this range,firstly sustaining it beyond or its forceful break out should be watched in next week for its beginning.
Conclusions (After Putting
All Studies Together)
All the trends are up with closing at life time highest last Friday and no indication of Impulsive Wave-5 completion yet on EOD charts.
As Doji Candle formation after some higher levels intraday selling patterns formations last Friday but lower levels good consolidation was also seen therefore firstly sustaining beyond last Friday trading range(17841-17941) should be watched in next week for:-
1- Above 17941 will mean rally above 18000 after last 11 sessions trading range break out.
2- Below 17841 will mean Short Term correction beginning towards next supports within above mentioned last 11 sessions trading range(17453-17947)
Sustaining below 17453 will mean correction continuation towards next supports of last 24 sessions trading range:-
1- 17360-17411
2- 17280-17305
Impulsive Wave-5 rally continuation is expected except minor correction possibility because some intraday selling patterns were seen last Friday. It must be kept in mind that until complete selling patterns will not develop on intraday and EOD charts till then Short/Intermediate Term correction will not be seen.
Up moves towards immediate resistance
Nifty-Intra Day Chart Analysis &
Market Outlook(07-10-2021)
Nifty-Intra Day Chart (06-Oct-2021):-

Technical Patterns formation in today intraday charts
1- More than 3 hours selling between 17816-17884(immediate resistances)
2- Down moves in Bullish Falling Channels in last 2 hours
3- Whole day actual trading between 17614-17884
Conclusions from intra day chart analysis
Following lines were told on 05-10-2021 in "Rally continuation towards last resistances Nifty":-
on going rally continuation will be seen towards last resistances(17907-17943) of Nifty tomorrow.
As was told 100% same happened and rally remain continued up to 17884.60 and then down moves started which remain continued till last minutes.
Although firstly more than 3 hours selling between 17816-17884 but Down moves were in Bullish Falling Channels in last 2 hours after that also therefore some up moves will be seen towards immediate resistance(17816) tomorrow and finally sustaining it beyond will confirm the life of today started correction.
Rally continuation towards last resistances Nifty
Nifty-Intra Day Chart Analysis &
Market Outlook(06-10-2021)
Nifty-Intra Day Chart (05-Oct-2021):-

Technical Patterns formation in today intraday charts
1- Consolidation between 17641-17704
2- Sharp up
3- Up moves with downward corrections
4- Whole day actual trading between 17641-17833
Conclusions from intra day chart analysis
As US markets closed more than 300 points down yesterday therefore sentiment was dampened today morning hence weaker opening of Indian marekts but consolidation developed.
Firstly more than 3 hours consolidation and after that sharp up moves as well as last more than Two and half hours up moves with downward corrections therefore whole day good buying will be understood and on going rally continuation will be seen towards last resistances(17907-17943) of Nifty tomorrow.
Levels will confirm next
decisive moves
Nifty-Intra Day Chart Analysis &
Market Outlook(05-10-2021)
Nifty-Intra Day Chart (04-Oct-2021):-

Technical Patterns formation in today intraday charts
1- Strong up moves after gap up opening
2- Mixed Patterns formation with volatility between 17650-17750
3- Whole day actual trading between 17581-17750
Conclusions from intra day chart analysis
Following lines were told on 02-10-2021 in "Firstly watch last 19 sessions trading range for the life and size correction":-
1- Resistances are as follows:-
A- 17638-17685
B- 17678-17742
2- consolidation will be understood and resultant some up moves will be seen in the beginning of next week.
As was told 100% same happened and up moves were seen after gap up opening but last more than 5 hours volatile trading within 100 points was with Mixed Patterns formation between 17650-17750 and that was almost within above mentioned resistances(17638-17742) also therefore firstly sustaining beyond 17638-17750 should be watched tomorrow for the life of today started fresh up moves after previous week correction.
Next moves after sustaining beyond 17638-17750 will be towards following supports and resistances:-
Supports below 17638 are as follows:-
A- 17462-17486
B- 17360-17411
C- 17280-17305
Resistances above 17750 are as follows:-
A- 17755-17781
B- 17822-17896
C- 17907-17943
Firstly watch last 19 sessions trading range for the life and size correction
Technical Analysis,Research & Weekly
Outlook(Oct 04 to Oct 08,2021)
Nifty-EOD Chart Analysis
(Averages,Stochastic & MACD)
Nifty-EOD Chart (01-Oct-2021):-

Technical Patterns and Formations in EOD charts
1- Impulsive Wave-5 continuation with recent high and new life time top formation at 17947.65 on 24-09-2021
2-Averages
A- 5-Day SMA is today at 17693
B- 21-Day SMA is today at 17530
3- Stochastic- %K(5) is at 21.27 & %D(3) is at 37.67
4- Stochastic- %K(5) line has intersected %D(3) line downward and both lines are moving towards Over sold zone.
5- In MACD- MACD line has intersected Average line downward and its both lines are moving downward in positive zone.
Conclusions from EOD chart analysis
(Averages,Stochastic & MACD)
As EOD Waves structure of Nifty was updated in previous week weekly Outlook and no material change in it since then therefore only Short Term Averages and Indicators analysis is being updated in this week Weekly Outlook.
Last Friday closing was at 17532 which is below 5-Day SMA(17693) and testing 21-Day SMA(17530). It means that Short Term Trend has turned down and first signal of Intermediate Term Trend moving down will emerge after sustaining below 21-Day SMA therefore firstly sustaining it beyond should be watched in next week.
As in Stochastic %K(5) line has intersected %D(3) line downward and both lines are moving towards Over sold zone and have not turned Oversold therefore some more down moves may also be seen in next week.
As in MACD both lines are falling in positive zone after MACD line downward intersection of Average line therefore it is confirming downward trend formations and some more down moves possibilities in next week.
Nifty-Last 19 Sessions
intraday charts analysis
Nifty-Intra Day Chart (Oct 01 & Oct 01,2021):-

Technical Patterns formation in last 19 Sessions intraday charts
1- Selling(Resistances) in last 19 Sessions are as follows:-
A- 17638-17685
B- 17678-17742
C- 17755-17781
D- 17822-17896
E- 17907-17943
2- Consolidation(Supports) in last 19 Sessions are as follows:-
A- 17462-17486
B- 17360-17411
C- 17280-17305
3- Last 19 Sessions actual trading between 19255-17947
Conclusions from 19 Sessions
intra day chart analysis
Last 19 Sessions trading between 19255-17947 with above mentioned lower levels supports and higher levels resistances within it as well as last Friday closing was almost in the middle of this range. As these supports and resistances are almost equally strong therefore expected that Nifty will firstly traded within this last 19 Sessions trading range and will prepare for next decisive moves beyond this range.
Nifty-Intra Day Chart Analysis
(01-Oct-2021)
Nifty-Intra Day Chart (01-Oct-2021):-

Technical Patterns formation in today intraday charts
1- Selling between 17515-17550
2- Support between 17462-17486
3- Last 3 hours up moves with downward corrections
4- Whole day actual trading between 17453-17557
Conclusions from intra day chart analysis
Although firstly selling after gap down opening but lower levels support has also developed therefore up moves were seen in last 3 hours last Friday. As these up moves were with with downward corrections hence consolidation will be understood and resultant some up moves will be seen in the beginning of next week.
Conclusions
(After Putting All Studies Together)
1- Long Term Trend is up.
2- Intermediate Term Trend is sideways between 19255-17947 for the last 19 Sessions.
3- Short Term Trend is down.
As in previous week long Weekly Black Candle was formed and last Friday closing was near the lower levels of Week therefore emergence of weakness beginning signals.
Although firstly some up moves are expected in the beginning of next week because 3 hours consolidation was seen last Friday after lower levels supports but MACD is showing downward trend formations and Stochastic is also suggesting some more down moves possibilities therefore finally correction continuation is expected within last 19 Sessions trading range(19255-17947) in next week.
As many times Bullish markets completes its corrections through Short Term corrections or sideways trading therefore firstly sustaining beyond last 19 sessions trading range(19255-17947) should be watched in the coming week/weeks for the life and size of previous week started correction amid some more down moves possibilities within this range in next week
Correction continuation towards
next supports
Nifty-Intra Day Chart Analysis &
Market Outlook(01-10-2021)
Nifty-Intra Day Chart (30-Sep-2021):-

Technical Patterns formation in today intraday charts
1- Selling between 17678-17742
2- Selling between 17638-17685
3- Whole day actual trading between 17586-17742
Conclusions from intra day chart analysis
As whole day good selling today therefore correction continuation will be seen below today lowest and towards following next supports:-
1- 17360-17411
2- 17280-17305
3- 17213-17270
Firstly sideways market and sharp fall if fresh selling develop
Nifty-Intra Day Chart Analysis &
Market Outlook(30-09-2021)
Nifty-Intra Day Chart (29-Sep-2021):-

Technical Patterns formation in today intraday charts
1- Consolidation between 17609-17683(immediate supports)
2- Up moves
3- Selling between - 17755-17781(immediate resistances)
4- Whole day actual trading between 17609-17781
Conclusions from intra day chart analysis
Although firstly 140 points slipping after weaker opening but lower levels more than 3 hours good consolidation developed therefore up moves were seen in Mid-session. As minor selling also at higher levels therefore down moves were seen in last half hour.
Last 5 sessions trading between 17576-17947 with following supports and resistances within this range therefore Nifty will firstly remain sideways within this range:-
Resistances:-
1- 17907-17943
2- 17822-17896
3- 17755-17781
Supports:-
1- 17609-17683
As resistances are much stronger than supports therefore expected that Nifty will not move above 17947 anf if fresh selling develop tomorrow then sharp fall may be seen towards yesterday updated 3 supports ranges.
Correction continuation expectations
Nifty-Intra Day Chart Analysis &
Market Outlook(29-09-2021)
Nifty-Intra Day Chart (28-Sep-2021):-

Technical Patterns formation in today intraday charts
1- Selling between 17822-17883
2- Down moves with upward corrections
3- Down moves in Bullish Falling Channel
4- Sharp recovery in last hour
5- Whole day actual trading between 17577-17912
Conclusions from intra day chart analysis
Although positive opening but fresh selling developed after last 2 sessions selling therefore decisive down moves was seen. As lower levels some consolidation also therefore sharp recovery from lower levels in last hour.
some buying was seen above 17802 in 2 previous sessions but good selling above it today therefore expected that down moves will be seen towards today lowest(17577) and once sustaining below it will mean today started correction continuation towards following next supports:-
1- 17360-17411
2- 17280-17305
3- 17213-17270
Levels will confirm next
more than 2% moves
Nifty-Intra Day Chart Analysis &
Market Outlook(28-09-2021)
Nifty-Intra Day Chart (27-Sep-2021):-

Technical Patterns formation in today intraday charts
1- Selling between 17907-17943
2- Down moves with upward corrections
3- Selling between 17877-17896
4- Down moves in Bullish Falling Channel
5- Whole day actual trading between 17802-17943
Conclusions from intra day chart analysis
Following lines were told on 25-09-2021 in " Wave-5 Rally continuation towards its maximum target at 18793":-
1- some higher levels good intraday selling was seen therefore Doji Black Candle was formed last Friday
2- firstly sustaining beyond last Friday trading range(17819-17947) should be firstly watched in the beginning of next week
17819-17947 was told on 25-09-2021 for firstly watching in the beginning of this week and Nifty traded almost whole day within this range between 17802-17943 with higher levels selling and some supports also at lower levels also.
Expected that Nifty will again trade and prepare for next decisive moves within and near about 17802-17943 tomorrow also because both higher levels selling and lower levels buying has been seen in last 2 sessions and finally sustaining it beyond will confirm next more than 2% moves which should be firstly watched in the coming sessions.
Wave-5 Rally continuation towards its maximum target at 18793
Technical Analysis,Research & Weekly
Outlook(Sep 27 to Oct 01,2021)
Nifty-EOD Chart Analysis
(Waves structure)
Nifty-EOD Chart (24-Sep-2021):-

Technical Patterns and Formations in EOD charts
1- Corrective Wave-C completion and Impulsive Wave-1 beginning from 7511.10 on 24-03-2020
2- Impulsive Wave-1 completion at 11794.30 on 31-08-2020
3- Wave-1 gained 4283.20 points
4- Corrective Wave-2 completion at 10790.20 on 24-09-2020
5- Impulsive Wave-3 completion at 15431.8 on 16-02-2021
6- Wave-3 gained 4641.60 points
7- Corrective Wave-4 completion at 14151.4 on 22-04-2021
8- Impulsive Wave-5 continuation with recent high and new life time top formation at 17947.65 on 24-09-2021
Conclusions from EOD chart analysis
(Waves structure)
Impulsive Wave-5 continuation in full force with recent high and new life time top formation at 17947.65 on 24-09-2021 and no indication of Wave-5 completion yet on EOD and intraday chartS except Doji Black Candle formation last Friday.
Nifty-EOD Chart Analysis
(Stochastic & MACD)
Nifty-EOD Chart (24-Sep-2021):-

Technical Patterns and Formations in EOD charts
1- Impulsive Wave-5 continuation with recent high and new life time top formation at 17947.65 on 24-09-2021
2- Stochastic- %K(5) is at 76.00 & %D(3) is at 58.62
3- Stochastic- %K(5) line has intersected %D(3) line upward and both lines are moving towards Over bought zone.
4- Stochastic is showing negative divergence.
5- In MACD- MACD line has intersected Average line downward and its both lines are moving downward in positive zone.
6- MACD is showing negative divergence.
Conclusions from EOD chart analysis
(Stochastic & MACD)
As in Stochastic %K(5) line has intersected %D(3) line upward and both lines are moving towards Over bought zone therefore indications of some up moves but %K is just below Overbought zone and this indicator is showing negative divergence also hence Short Term Correction may begin after some up moves.
As in MACD both lines are falling in positive zone after MACD line downward intersection of Average line therefore MACD is indicating downward trend formations and its possibility increases also because this indicator is showing negative divergence as well.
Conclusions
(After Putting All Studies Together)
All the trends are up and Bullish rally continuation forcefully in the form of Impulsive Wave-5 and no indication of its completion yet on EOD Charts except Over bought Weekly indicators.
As Short term indicators are showing signals of Short Term correction but after some more up moves and more selling patterns formations therefore let fresh selling firstly develop in next week then Short Term correction beginning will be considered accordingly.
As per above given Waves structure maximum target of Nifty is at 18793.00 and its calculations are as follows:-
As per Elliott Wave theory "Wave-3 should not be shorter than both Wave-1 and Wave-5. Now impulsive Wave-5 is on and it should not gain more points than Wave-3 has gained.
Impulsive Wave-1 gained=4283.20 points(11794.30-7511.10)
Impulsive Wave-3 gained=4641.60 points(15431.80-10790.20)
Impulsive Wave-5 has gained 3796.25 points till 24-09-2021(17947.65-14151.40)
As according to Elliott Wave theory Wave-5 can not gain more points than Wave-3 gained therefore on going impulsive Wave-5 will gain lesser points than 4641.60.
Impulsive Wave-5 started from 14151.4 on 22-04-2021 and it has to gain less than 4641.60 points therefore maximum target of on going impulsive Wave-5 is 18793.00(14151.40+4641.60)
As some higher levels good intraday selling was seen therefore Doji Black Candle was formed last Friday hence firstly sustaining beyond last Friday trading range(17819-17947) should be firstly watched in the beginning of next week for immediate rally towards 18793.00 after sustaining above 17947 or Rally after Short term correction after sustaining below 17819. Next supports below 17819 are as follows:-
1- 17360-17411
2- 17280-17305
3- 17213-17270
We posted following topic telling maximum of Nifty at 18793.00 on 07-08-2021 also when previous closing of Nifty was at 16238.20 on 06-08-2021:-
Rally continuation with little
deeper corrections possibility
Nifty-Intra Day Chart Analysis &
Market Outlook(24-09-2021)
Nifty-Intra Day Chart (23-Sep-2021):-

Technical Patterns formation in today intraday charts
1- Whole day up moves with downward corrections
2- Whole day actual trading between 17647-17843
Conclusions from intra day chart analysis
As FOMC announcements led strong US markets rally yesterday and Dow Jones Futures was trading more than 100 points up today morning also therefore most Asian markets were trading with good gains hence strong opening of Indian markets today morning.
Whole day today up moves were with downward corrections and today closing was at life time highest after new life time top formations and intraday selling patterns were not seen therefore rally will remain continued. As sentiment has turned heated after strong rally of today therefore little deeper corrections may also be seen.
Firstly watch 17524-17610
amid mixed cues
Nifty-Intra Day Chart Analysis &
Market Outlook(23-09-2021)
Nifty-Intra Day Chart (22-Sep-2021):-

Technical Patterns formation in today intraday charts
1- Slipping after positive opening
2- Selling between 17571-17610
3- Whole day actual trading between 17524-17610
Conclusions from intra day chart analysis
As good selling between 17571-17610 therefore down moves are expected below today lowest(17524) but SGX Nifty is trading more than 110 points up after more then 500 points strong rally in Dow Jones hence firstly sustaining beyond today trading range(17524-17610) should be firstly watched tomorrow amid these mixed cues.
17213-17622 will confirm next Short Term trend
Nifty-Intra Day Chart Analysis &
Market Outlook(22-09-2021)
Nifty-Intra Day Chart (21-Sep-2021):-
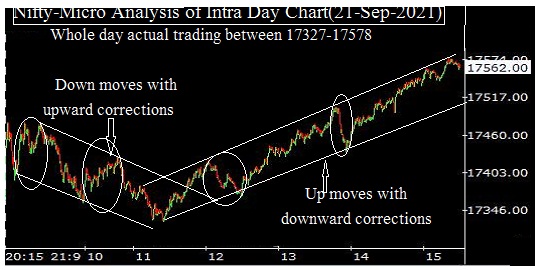
Technical Patterns formation in today intraday charts
1- Down moves with upward corrections
2- Up moves with downward corrections
3- Whole day actual trading between 17327-17578
Conclusions from intra day chart analysis
Although firstly 70 points down moves with upward corrections but getting supports just above yesterday mentioned 1st supports range(17280-17305) and after that last 4 hours up moves with downward corrections and closing as well as today highest formations within yesterday selling range(17512-17622).
As Nifty has honoured both immediate supports and resistances therefore expected that Nifty will again trade between immediate supports and resistances(17213-17622) as well as prepare for next decisive moves beyond this range. Finally sustaining beyond/forceful break out of 17213-17622 will confirm next Short Term trend hence should be watched in the coming sessions.
Slipping towards next supports
Nifty-Intra Day Chart Analysis &
Market Outlook(21-09-2021)
Nifty-Intra Day Chart (20-Sep-2021):-

Technical Patterns formation in today intraday charts
1- Selling between 17512-17622
2- Down moves till last minutes
3- Whole day actual trading between 17361-17622
Conclusions from intra day chart analysis
Following lines were told on 18-09-2021 in "Short Term correction towards next supports amid Sideways market turning expectations":-
1- some down moves expectations in the beginning of next week.
2- down moves will be seen below last Friday lowest(17538) in the beginning of next week.
3- Short Term correction expectations towards above mentioned supports in the beginning of next week.
As was told 100% same happened and Nifty
closed 188 points down today.
As more than 4 hours good selling therefore down moves were seen till last minutes and more than 1% negative closing also but Nifty hovered around last Saturday posted 3rd support range(17370-17394) in last minutes.
Following supports are lying below today lowest:-
1- 17280-17305
2- 17213-17270
As consolidation patterns were not seen and only selling developed therefore Nifty may slip towards above mentioned supports but finally sideways market is expected between 17280-17512 tomorrow.
Subscribe to:
Posts (Atom)