Levels will confirm next big moves amid US Bond yield led huge volatility
Technical Analysis,Research & Weekly Outlook
(Mar 08 to Mar 12,2021)
Nifty-EOD Chart Analysis
(Waves structure)
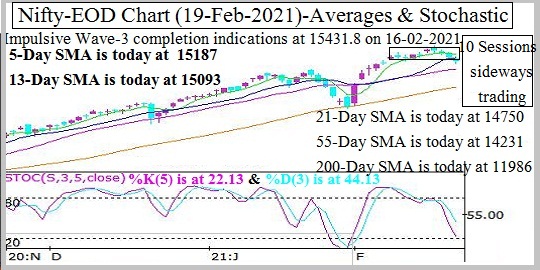
Nifty-EOD Chart (05-Mar-2021):-

Technical Patterns and Formations in EOD charts
1- Corrective Wave-C completion and Impulsive Wave-1 beginning from 7511.10 on 24-03-2020
2- Impulsive Wave-1 completion at 11794.30 on 31-08-2020 and corrective Wave-2 beginning
3- Wave-1 gained 4283.20 points
4- Corrective Wave-2 completion at 10790.20 on 24-09-2020 and Impulsive Wave-3 beginning
5- Impulsive Wave-3 completion indications after new life time highest top formation at 15431.8 on 16-02-2021
7- Wave-3 has gained 4641.60 points which are more than Wave-1 gained
8- Correction continuation with recent last Friday bottom formation at 14467.75 on 26-02-2021 which is below last 24 sessions lowest.
9- Last 24 sessions sideways trading between 14468-15421
Conclusions from EOD chart analysis(Waves structure)
Impulsive Wave-3 continuation and no confirmation of its completion yet but indications of its completion after new life time highest top formation at 15431.8 on 16-02-2021 because:-
1- last Friday closing is below Short Term averages(5,13,and 21 SMA)
2- Last 24 sessions sideways trading between 14468-15421 with higher levels good intraday selling within this range.
3- As Wave-3 has gained more points than Wave-1 then it may correct to form Wave-4.
Nifty-EOD Chart Analysis
(Wave-3 Fibonacci retracement )
Nifty-EOD Chart (05-Mar-2021):-

Technical Patterns and Formations in EOD charts
1- Corrective Wave-2 completion at 10790.20 on 24-09-2020 and Impulsive Wave-3 beginning
2- Impulsive Wave-3 completion indications after new life time highest top formation at 15431.8 on 16-02-2021
Conclusions from EOD chart analysis (Wave-3 Fibonacci retracement Fibonacci retracement levels)
Wave-3 correction beginning confirmation will mean its continuation according to following Fibonacci Retracement levels of Wave-3(10790.20-15431.8):-
1- 13.0%- 14,828.40(Corrected)
2- 23.6%- 14,336.34
3- 27.0%- 14,178.60
4- 38.2%- 13,658.68(Crucial)
5- 50.0%- 13,110.97(Crucial)
6- 61.8%- 12,563.27(Crucial)
7- 70.7%- 12,150.20
8- 76.4%- 11,885.60
9- 78.6%- 11,783.50
10-88.6%- 11,319.30
Nifty-EOD Chart Analysis (Stochastic)
Nifty-EOD Chart (05-Mar-2021):-

Technical Patterns and Formations in EOD charts
1- Stochastic %K(5) is at 73.29 & %D(3) is at 73.10
2- Stochastic is showing negative divergence from over bought zone through moving down when Nifty is moving up.
3- Last 24 sessions sideways trading between 14468-15421
Conclusions from EOD
chart analysis (Stochastic)
As Stochastic is showing negative divergence from over bought zone therefore signalling Short Term Correction and its beginning confirmation will be after sustaining below last 24 sessions sideways trading range lowest(14468).
Nifty-Last 25 Sessions
intraday charts analysis
Nifty-Intra Day Chart (Febr 01 to Mar 05,2021):-

Technical Patterns formation in last 25 Sessions intraday charts
1- Union-Budget day rally on 01-02-2021
2- Last 24 sessions sideways trading between 14468-15421
3- Selling(Resistances) in last 24 Sessions are between:-
A- 15007-15092
B- 15145-15196
C- 15213-15245
D- 15274-15315
E- 15335-15431
3- Consolidation(Supports) in last 24 Sessions are sessions:-
A- 14788-14855
B- 14663-14742
C- 14504-14615
Supports below last 24 sessions trading range are as follows:-
A- 13817-13865
B- 13725-13776
C- 13606-13701
Conclusions from 25 Sessions
intra day chart analysis
Strong 701 points rally was seen on Union-Budget day(01-02-2021) and after that Nifty traded sideways last 24 sessions between 14468-15421.
As above mentioned 5 resistances and 3 supports exists in last 24 sessions trading range therefore expected that Nifty will firstly trade and prepare for next trend within this range and finally sustaining beyond last 24 sessions trading range(14468-15421) will generate big moves which will be seen in next week/weeks.
Nifty-Intra Day Chart Analysis
(05-Mar-2021)
Nifty-Intra Day Chart (05-Mar-2021):-

Technical Patterns formation in today intraday charts
1- 4 Hours selling between 15007-15092(immediate Resistances)
2- Sharp fall
3- Up moves in Bearish Rising Channels
4- Whole day actual trading between 14863-15092
Conclusions from intra day chart analysis
As firstly 4 Hours selling between 15007-15092 therefore sharp fall was seen after that. Although some up moves were seen in last hour but in Bearish Rising Channels hence these up moves will be understood follow up selling.
Immediate resistances of Nifty have been developed between 15007-15092 last Friday and until Nifty will not sustain above 15092 after complete consolidation till then decisive up moves will not be seen.
As last Friday whole day trading will be understood with selling patterns formations therefore sustaining below 14863 will mean sharp fall towards next supports.
Conclusions (After Putting All Studies Together)
1- Long Term Trend is up.
2- Intermediate Term Trend is up.
3- Short Term Trend is sideways between 14468-15421.
Nifty has turned sideways for the last 24 sessions between 14468-15421 after Union-Budget day(01-02-2021) strong 701 points rally and finally sustaining beyond this range will form following next trend:-
1- Above 15421 will mean strong rally but complete consolidation is firstly required because multiple resistances are lying below it.
2- Below 14468 will mean Short Term correction continuation towards above given next supports and Fibonacci Retracement levels of Wave-3(10790.20-15431.8).
As intraday charts of last Friday are showing good selling therefore firstly some down moves are expected in the beginning of next week hence sustaining beyond next supports should be firstly watched in next week.
US Bond yield led huge volatility is being seen in all the Global and Indian markets and finally sustaining beyond last 24 sessions trading range(14468-15421) will confirm its impact on Indian markets which should be watched for next big moves confirmations.