ॐ ह्रीं श्रीं लक्ष्मीभयो नमः॥


Trading "calls" from our "Software" with more than "90% accuracy"

More than "12 years" old "only site of whole world" 
with more than "9700 accurate Outlooks" of 
"Indian Stock Markets" 
13772-13912 will confirm Indian markets reaction on Budget and crashing Global markets 
Mid-session Outlook(28-01-2021)

As most Asian markets were in crashing mode after more than 2% fall of all US markets Indices therefore huge gap down opening of Indian markets and Nifty is trading between 13795-13898 since today morning which is within previous Outlook mentioned supports(13772-13912).

Indian markets will have to react on Budget expectations and crashing Global markets and  Finally sustaining beyond 13772-13912 will confirm next trend as the result of these 2 developments therefore firstly sustaining beyond 13772-13912 should be watched in the coming sessions for Indian markets final reaction and resultant next trend. 
Strong Pull back Rally in the coming 1/2 sessions
Nifty-Intra Day Chart Analysis & 
Market Outlook(28-01-2021)
Nifty-Intra Day Chart (27-Jan-2021):-
Technical Patterns formation in today intraday charts

1- Selling between 14120-14194
2- Down moves with upward corrections
3- Consolidation between 13930-14010
4- Whole day actual trading between 13930-14237

Conclusions from intra day chart analysis 

In both previous Outlooks possibility of huge/sharp fall was told after sustaining below 14265 and it was seen today because following next supports were much below 14265:- 

1- 13875-13912
2- 13815-13845
3- 13772-13811(Gap supports)

Slipping 75 points in first 10 seconds and after that selling through Down moves with upward corrections therefore correction continuation and closing below 14000 today.  

Although last more than 1 hour consolidation between 13930-14010 but higher levels good selling also therefore complete consolidation is firstly required for fresh rally above 14000.

As crashing like situation in all Global markets therefore more weakness can not be ruled out tomorrow but Very Short Term indicators have turned Oversold and consolidation was seen at lower levels today as well as above mentioned multiple supports are lying below today lowest therefore expected that strong Pull back Rally will be seen in the coming 1/2 sessions after fresh consolidation above 13815.
 Firstly watch sustaining beyond 14265
Nifty-Intra Day Chart Analysis &
Market Outlook(27-01-2021)
Nifty-Intra Day Chart (25-Jan-2021):-
Technical Patterns formation in today intraday charts

1- Selling between 14455-14480
2- Sharp fall
3- Selling between 14324-14432
4- Down moves in Bullish Falling Channel
5- Whole day actual trading between 14218-14491

Conclusions from intra day chart analysis 

Following conclusive lines were told on 23-01-2021 in "Firstly watch crucial levels in Budget news led highly volatile next week":-

1- Nifty will firstly prepare for post-Budget big moves between and near about 14265-14528 in the beginning of next week
2- As strong resistances are above it therefore Nifty will have to consolidate completely for crossing and sustaining above those resistances
3- Remain completely careful because fresh selling within this range and sustaining below 14265 will mean huge fall because next supports are much below it. 

Nifty traded first 6 hours between 14265-14528 and slipped below it in last half hour after good selling above it last Monday therefore more down moves are expected tomorrow, follow up selling and once sustaining below 14265 will mean sharp fall possibility also therefore remain cautious.

As Union Budget led volatility can not be ruled out and last hour Down moves were in Bullish Falling Channel last Monday therefore some up moves possibility can not be ruled but until complete consolidation will not develop till then Nifty will not be able to move and sustain above 14265

Global markets are also highly volatile due to new variant of coronavirus therefore firstly sustaining beyond 14265 should be watched tomorrow for slow up moves above it and sharp fall below it.
समस्त हिन्दुस्थानियों को 
72 वें गणतंत्र दिवस की हार्दिक शुभकामनायें 
Wishing you all Hindusthanis 
Happy Republic Day 2021

Live proofs of our accuracy
Just click on following "Topic link" and go through above topic in this Blog which was posted on 16-01-2021:-
Just click on following "Topic link" and go through above topic in this Blog which was posted on 05-12-2020:-

 Firstly watch crucial levels in Budget news led highly volatile next week
Technical Analysis,Research & 
Weekly Outlook(Jan 25 to Jan 29,2021)
Nifty-EOD Chart Analysis 
(Averages,MACD & Stochastic)
Nifty-EOD Chart (22-Jan-2021):-
Technical Patterns and Formations in EOD charts

1- Impulsive Wave-5 continuation with recent top formation at 14753.55 on 21-01-2021
2-Averages
A- 5-Day SMA is today at 14481
B- 13-Day SMA is today at 14437
C- 21-Day SMA is today at 14264
D- 55-Day SMA is today at 13541
3- Stochastic %K(5) is at 64.14 & %D(3) is at 67.11 
4- MACD line intersected Average line downward

Conclusions from EOD chart analysis
(Averages,MACD & Stochastic)

Impulsive Wave-5 continuation with recent top formation at 14753.55 on 21-01-2021. Although no confirmation of its completion yet but correction beginning signals developed in last 2 sessions through 2 long Black candles formation and previous week closing below 13-Day SMA(14437) at 14357.75.

In Stochastic %K(5) has intersected downward %D(3) and started to move down from Over bought zone after making lower top formation therefore indicating more down moves possibilities in the coming sessions.

In MACD also MACD line intersected Average line downward therefore showing Short Term Trend turning down indications.

Nifty-Last 5 Sessions 
intraday charts analysis
Nifty-Intra Day Chart (Jan 18 to Jan 22,2021):-
Technical Patterns formation in last 5 Sessions intraday charts

1 Selling(Resistances) in last 5 sessions are between:-
A- 14477-14528 
B- 14555-14619
C- 14701-14753 
2- Consolidation(Supports) in last 5 sessions are sessions:-
A- 14265-14340 
3- Mixed Patterns formation between 14358-14483
4- 5 Sessions actual trading between 14223-14753 

Conclusions from 5 
Sessions intra day chart analysis 

Last 5 Sessions actual trading between 14223-14753 with higher levels multiple resistances and only one support range at lower levels. 

As more than last 2 hours trading with Mixed Patterns formation between 14358-14483 last Friday was just above next supports(14265-14340) and just below next resistances(14477-14528) therefore expected that Nifty will firstly trade between 14265-14528 in the beginning of next week and finally sustaining beyond this range will confirm the life of last Thursday started correction.

Nifty-Intra Day Chart 
Analysis(22-Jan-2021)
Nifty-Intra Day Chart (22-Jan-2021):-
Technical Patterns formation in today intraday charts

1- Selling between 14555-14619(immediate Resistances)
2- Sharp fall
2- Selling between 14477-14528(immediate Resistances)
3- Mixed Patterns formation between 14358-14483
4- Whole day actual trading between 14358-14619

Conclusions from 
intra day chart analysis 

Although positive zone trading was seen in first hour after flat opening but selling developed therefore sharp fall was seen. 

Follow up selling was seen in Mid-session but last more than 2 hours trading was with Mixed Patterns formation between 14358-14483 because both consolidation and selling patterns were seen within this range. 

Expected that Nifty will firstly trade and prepare for next moves between 14358-14483 in the beginning of next week and firstly sustaining it beyond should be watched for moves towards next support below 14358 and next resistances above 14483.

Conclusions 
(After Putting All Studies Together)

1- Long Term Trend is up
2- Intermediate Term Trend is up
3- Short Term Trend has turned down after closing below 13-Day SMA(14437) at 14357.75.

As Waves structure was updated in previous weekly Outlook and no material change in its set up therefore only Averages and Indicators have been posted in this week Outlook.

Although new life time highest in previous week but Nifty could not move above Immediate maximum target of Nifty which was at 14754.25 and slipped also 395 points from 14753.55 in last 2 sessions therefore given waves structure is still valid. 

As Union Budget will be announced on 01-02-2021 and Indian markets will have to prepare for post Budget big moves therefore next 4 sessions of the coming week will be crucial because Nifty will technically prepare for post-Budget big moves in this period.

As coming week will be Budget news led highly volatile and firstly sustaining beyond crucial levels(14265-14528) should be watched in next week because Nifty will firstly prepare for post-Budget big moves between and near about 14265-14528 in the beginning of next week. As strong resistances are above it therefore Nifty will have to consolidate completely for crossing and sustaining above those resistances. Remain completely careful because fresh selling within this range and sustaining below 14265 will mean huge fall because next supports are much below it.  
 Watch levels for first signal of next decisive moves beginning amid Volatility
Nifty-Intra Day Chart Analysis &
Market Outlook(22-01-2021)
Nifty-Intra Day Chart (21-Jan-2021):-
Technical Patterns formation in today intraday charts

1- More than 5 hours selling between 14701-14753(immediate Resistances)
2- Sharp fall in last hour
3- Whole day actual trading between 14518-14753

Conclusions from intra day chart analysis 

Live proofs of levels accuracy


immediate maximum target of Nifty is at 14754.25

Immediate maximum target of Nifty was given at 14754.25 on 16-01-2021 and Nifty crashed 235 points from 14753.55 on 21-01-2021.

Although strong gap up opening today but sentiment turned heated due to SENSEX surpassing 50,000 mark therefore selling developed which remained continued more than 5 hours hence sharp fall was seen in last hour.

As more than 5 hours selling between 14701-14753 therefore it will be immediate resistance of Nifty and next supports are between 14265-14340 hence Nifty will prepare for post-budget moves between 14265-14753 in the coming sessions and remain volatile also within this 488 points range.  

Expected that Nifty will firstly trade and prepare for next decisive moves between 14518-14665 and sustaining beyond this range should be watched for first signal of its beginning.

 As busy in a marriage therefore Outlook of today(21-01-2021) is not being updated.

 Firstly watch 1st resistance for next decisive moves beginning confirmations
Nifty-Intra Day Chart Analysis & 
Market Outlook(20-01-2021)
Nifty-Intra Day Chart (19-Jan-2021):-
Technical Patterns formation in today intraday charts

1- Up moves with downward corrections
2- Whole day actual trading between 14351-14546

Conclusions from intra day chart analysis 

Following lines were told and 3 resistances were updated on 16-01-2021 in "Firstly watch immediate maximum target of Nifty at 14754.25 amid Pre-Post Budget news led volatility":-

1- For correction life firstly sustaining beyond 13-Day SMA(14276) should be watched in the coming week because it is between immediate next supports(14230-14301).

2- 3 Resistances:-

1- 14482-14549  
2- 14580-14617 
3- 14621-14648 

Immediate next supports were told between 14230-14301 and Nifty got supports just below it at 14,222.80 on 18-01-2021 as well as after that 239.85 points rally was seen today which remained continued up to 1st resistances at 14546.05

Although whole day today up moves were with downward corrections and closing was near the higher levels of the day as well as selling patterns were not seen but Very Short Term indicators have turned Over Bought after strong rally of today and above mentioned resistances are lying within and above today closing therefore firstly complete consolidation is required for rally continuation above today highest.

Expected that Nifty will firstly trade and prepare for next decisive moves within and neat about above mentioned 1st resistance(14482-14549) and finally sustaining it beyond will confirm following next moves:-

1- Sustaining below 14482 will mean sharp fall.
2- Sustaining above 14549 will mean slow up moves with follow up consolidation because above it multiple resistances are lying up to 14648. 

Firstly sustaining beyond above mentioned 1st resistance(14482-14549) should be watched  tomorrow for next decisive moves beginning confirmations.
Firstly watch supports for the life of on going correction
Nifty-Intra Day Chart Analysis & 
Market Outlook(19-01-2021)
Nifty-Intra Day Chart (18-Jan-2021):-
Technical Patterns formation in today intraday charts

1- Down moves with upward corrections
2- Selling between 14265-14343(immediate Resistances)
3- Up moves in Bearish Rising Channel
4- Down moves with upward corrections
5- Whole day actual trading between 14223-14459

Conclusions from intra day chart analysis 


1- Nifty will slip towards the lowest of last 5 sessions(14358) and once sustaining below it will mean sharp fall
2- correction continuation is expected in the beginning of next week
3- At present Short Term correction is on and its continuation is expected below last 5 sessions lowest(14358)in the coming week.
4- For correction life firstly sustaining beyond 13-Day SMA(14276) should be watched in the coming week because it is between immediate next supports(14230-14301).

As was told 100% same happened today and:- 

1- Nifty slipped below 14358 today
2- Today lowest was just below immediate next supports(14230-14301) at 14,222.80 and closed near 13-Day SMA(14276) at 14281.30.

Nifty slipped 40 points in first 2 minutes and more than 100 points within first 20 minutes as well as after that whole day selling remain continued thorugh Down moves with upward corrections and up moves in Bearish Rising Channel therefore Nifty closed at the lower levels of the day.

As very Short Term Indicators have turned oversold and Nifty closed within mentioned supports(14230-14301) therefore firstly sustaining it beyond should be watched in the coming sessions for the life of on going correction.  
Firstly watch immediate maximum target of Nifty at 14754.25 amid Pre-Post Budget news led volatility 
Technical Analysis,Research & Weekly Outlook
(Jan 18 to Jan 22,2021)
Nifty-EOD Chart Analysis
(Waves structure)
Nifty-EOD Chart (15-Jan-2021):-
Technical Patterns and Formations in EOD charts

1- Corrective Wave-C completion and Impulsive Wave-1 beginning from 7511.10 on 24-03-2020  
2- Wave-1(9889.05 on 30-04-2020)
3- Wave-2(8806.75 on 18-05-2020)
4- Wave-3(12025.50 on 15-10-2020)
5- Wave-4(11535.50 on 30-10-2020)
6- Impulsive Wave-5 continuation with recent top formation at 14653.40 on 13-01-2021

Conclusions from EOD chart analysis
(Waves structure)

Impulsive Wave-5 continuation with recent top formation at 14653.40 on 13-01-2021 and no indication of its completion yet because no selling patterns formations on EOD charts except long black candle formation last Friday.

Nifty-EOD Chart Analysis
(Averages & Stochastic)
Nifty-EOD Chart (15-Jan-2021):-
Technical Patterns and Formations in EOD charts

1- Impulsive Wave-5 continuation with recent top formation at 14653.40 on 13-01-2021
2- Last 5 Sessions sideways trading between 14358-14653
3-Averages
A- 5-Day SMA is today at 14528
B- 13-Day SMA is today at 14276
C- 21-Day SMA is today at 14049
D- 55-Day SMA is today at 13292
4- Stochastic %K(5) is at 65.20 & %D(3) is at 81.78
5- Stochastic showing negative divergence in over bought zone through moving down when Nifty is moving up.

Conclusions from EOD chart analysis
(Averages & Stochastic)

Impulsive Wave-5 continuation and no confirmation of its completion yet on EOD charts but last Friday closing was below 5-Day SMA(14528) at 14433.70 which is first indication of Short term correction beginning.

Last 5 Sessions sideways trading between 14358-14653 and last session closing was near its lower levels therefore if Nifty sustains below last 5 sessions lowest(14358) then Short term correction will be seen after 5 sessions trading range breaking down confirmations.

Short term indicator Stochastic has confirmed Short term correction beginning through:-

1- Showing negative divergence in over bought zone.
2- Moving down from over bought zone. 
3- %K(5) intersecting downward %D(3).

Nifty-Last 5 Sessions
intraday charts analysis
Nifty-Intra Day Chart (Jan 11 to Jan 15,2021):-
Technical Patterns formation in last 5 Sessions intraday charts

1- Selling(Resistances) in last 5 sessions are between:-
A- 14482-14549  
B- 14580-14617 
C- 14621-14648
2- Consolidation(Supports) in last 5 sessions are between:-
A- 14395-14430
B- 14461-14480
3- Sideways trading in last 5 sessions are between:- 
A- 14419-14457
4- 5 Sessions actual trading between 14358-14653 

Conclusions from 5 Sessions
intra day chart analysis 

As good selling at higher levels in last 5 sessions therefore Nifty fallen into last 5 sessions supports and traded sideways within these supports between 14419-14457 last Friday.

Nifty closed near the lower levels of last 5 sessions and higher levels good selling also therefore expected that Nifty will slip towards the lowest of last 5 sessions(14358) and once sustaining below it will mean sharp fall after valid break down of last 5 sessions trading range.

Next supports below 14358 are as follows:-

1- 14258-14301
2- 14230-14252

Nifty-Intra Day Chart
Analysis(15-Jan-2021)
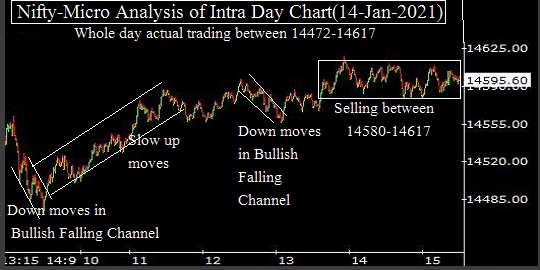
Nifty-Intra Day Chart (15-Jan-2021):-
Technical Patterns formation in today intraday charts

1- Sharp fall after flat opening
2- Selling between 14482-14549(immediate Resistances)
3- Sharp fall 
4- Sideways trading in last hour between 14419-14457
5- Whole day actual trading between 14358-14617

Conclusions from
intra day chart analysis 

Firstly sharp fall after flat opening and after that more than 4 hours selling between 14482-14549 therefore this range will be immediate Resistance on Nifty.

Although again sharp fall after more than 4 hours selling but after that sideways trading in last hour between 14419-14457 therefore firstly sustaining beyond this range should be watched in next week for correction continuation confirmation below 14419 and first signal of correction completion above 14457. 

As good selling above 14482 in last 3 sessions of previous week therefore correction continuation is expected in the beginning of next week and complete consolidation is firstly required for correction completion and sustaining above 14457.

Conclusions
(After Putting All Studies Together)

1- Long Term Trend is up
2- Intermediate Term Trend is up
3- Short Term Trend has turned down after last Friday closing below 5-Day SMA(14528) at 14433.70

Impulsive Wave-5 of Nifty continuation and as per Elliott Wave theory maximum target of on going Wave-5 is at 14754.25. Its calculation is as follows:-                                                                                   

As per Elliott Wave theory "Wave-3 should not be shorter than both Wave-1 and Wave-5. Now impulsive Wave-5 is on and it should not gain more points than Wave-3  gained.

Impulsive Wave-1 gained=2377.95 points(9889.05-7511.10)
Impulsive Wave-3 gained=3218.75 points(12025.50-8806.75)
Impulsive Wave-5 has gained 3117.90 points till 13-01-2021(14653.40-11535.50)

As according to Elliott Wave theory Wave-5 can not gain more points than Wave-3 gained therefore on going impulsive Wave-5 will gain lesser points than 3218.75.

Impulsive Wave-5 started from 11535.50 on 30-10-2020 and it has to gain less than 3218.75 points therefore maximum target of on going impulsive Wave-5 is 14754.25(11535.50+3218.75)

It must be kept in mind that nothing is absolute in financial markets and if Nifty moves above 14754.25 then as per Elliott Wave theory Waves structure has to be recalculated and if correction remain continued without moving above 14754.25 then "ABC" correction of rally between 7511.10-14754.25 will be considered.

At present Short Term correction is on and its continuation is expected below last 5 sessions lowest(14358)in the coming week. For correction life firstly sustaining beyond 13-Day SMA(14276) should be watched in the coming week because it is between immediate next supports(14230-14301).

As per given Waves structure immediate maximum target of Nifty is at 14754.25 and correction started from just below it in previous week from 14653.40 therefore firstly 14754.25 should be watched in the coming 3 weeks of Pre-Post Budget news led volatility for rally continuation or deeper "ABC" correction. 
 Sustaining below 14580 will be first strong signal of Short Term Correction 
Nifty-Intra Day Chart Analysis & 
Market Outlook(15-01-2021)
Nifty-Intra Day Chart (14-Jan-2021):-
Technical Patterns formation in today intraday charts

1- Down moves in Bullish Falling Channel
2- Slow up moves
3- Down moves in Bullish Falling Channel
4- Selling between 14580-14617
5- Whole day actual trading between 14472-14617

Conclusions from intra day chart analysis 

As firstly Down moves in Bullish Falling Channel therefore after that up moves were seen but those up moves were slow hence some selling also can not be ruled out.

Although again some consolidation in Mid-session but last hours selling patterns formations between 14580-14617 which were below yesterday selling levels therefore higher levels follow up selling will be understood.

As selling above 14580 in last 2 sessions therefore if fresh selling develops tomorrow then Short Term Correction will be seen and its first strong signal will be sustaining below 14580.
watch levels for next Short Term trend confirmations
Nifty-Intra Day Chart Analysis & 
Market Outlook(14-01-2021)
Nifty-Intra Day Chart (13-Jan-2021):-
Technical Patterns formation in today intraday charts

1- Down moves with upward corrections
2- Down moves in Bullish Falling Channel
3- Up moves in Bearish Rising Channel
4- Whole day actual trading between 14436-14653

Conclusions from intra day chart analysis 

Although gap up opening but selling developed and down moves were seen with upward corrections therefore Nifty slipped more than 200 points from higher levels. 

As some consolidation at lower levels through Down moves in Bullish Falling Channel hence up moves in last hours which were in Bearish Rising Channel therefore follow up selling will be understood at higher levels today. 

Both lower levels some supports and higher levels good selling between 14436-14653 therefore firstly sustaining beyond this range should be watched tomorrow for next Short Term trend confirmations.
 As busy therefore Stock Market Outlook of 13-01-2021 is not being updated.
 Firstly watch levels for next Very Short term trend confirmations
Nifty-Intra Day Chart Analysis & 
Market Outlook(12-01-2021)
Nifty-Intra Day Chart (11-Jan-2021):-
Technical Patterns formation in today intraday charts

1- Whole day up moves in Bearish Rising Channels
2- Down moves in Bullish Falling Channels
3- Whole day actual trading between 14384-14498

Conclusions from intra day chart analysis 

Although firstly some consolidation through Down moves in Bullish Falling Channels but Whole day up moves were in Bearish Rising Channels therefore some selling also can not be ruled out.

As both buying and selling therefore some consolidation is required for sustaining above day's highest and more selling will mean Very Short term correction below day's lowest.

Nifty will have to prepare for the next Very Short term trend within or near about day's range(14384-14498) and firstly sustaining its beyond should be watched for its confirmations.
Nifty IT led Rally continuation and correction only after fresh selling patterns formation
Nifty & Bank Nifty Weekly Outlook
(Jan 11 to Jan 15,2021)
Nifty-EOD Chart Analysis (Stochastic)
Nifty-EOD Chart (08-Jan-2021):-
Technical Patterns and Formations in EOD charts

1- Corrective Wave-C completion and Impulsive Wave-1 beginning from 7511.10 on 24-03-2020  
2- Impulsive Wave-5 continuation with recent top formation at 14367.30 on 08-01-2021
3- Stochastic at %K(5) is at 74.67 & %D(3) is at 78.52

Conclusions from EOD chart analysis(Stochastic)

Impulsive Wave-5 continuation with recent top formation at 14367.30 on 08-01-2021 and no confirmation of its completion yet because no selling patterns formations on EOD charts and intraday charts.

As Short Term Indicator Stochastic has become Overbought and showing negative divergence as well as %K has intersected downward %D therefore indicating signals of Short Term correction which will be seen after selling patterns formations on Intraday and EOD charts.

Nifty-Intra Day Chart Analysis(08-Jan-2021)
Nifty-Intra Day Chart (08-Jan-2021):-
Technical Patterns formation in today intraday charts

1- Consolidation between 14230-14252 
2- Consolidation between 14258-14301
3- Up moves with downward correction 
4- Whole day actual trading between 14222-14367

Conclusions from intra day chart analysis 

As Dow Jones Futures was trading more than 110 points up and all the Asian markets were trading with 0.90% to 02.5% gains therefore sentiment was Bullish last Friday morning hence strong opening of Indian markets.

Firstly consolidation between 14230-14252 and after that some up moves then follow up consolidation between 14258-14301 as well as last hour up moves with downward correction therefore whole day last Friday trading will be understood with consolidation hence firstly up moves above last Friday highest will be considered in the beginning of next week. 
Nifty-Conclusions
(After Putting All Studies Together)

All trends are up,rally continuation and no indication of its completion yet on EOD and intraday charts. 

As Short to Intermediate Term indicators have turned over bought and shown negative divergence also therefore Short to Intermediate Term correction is very much due which will be seen after selling patterns formation on both EOD and intraday charts 
  
Bank Nifty-EOD Chart Analysis (Stochastic)
Bank Nifty-EOD Chart (08-Jan-2021):-
Technical Patterns and Formations in EOD charts

1- Corrective Wave-A completion at 16116.30 on 24-03-2020 and Wave-B beginning 
2- Wave-c of Wave-B continuation with recent top formation at 32298.05 on 08-01-2021
3- Stochastic at %K(5) is at 83.52 & %D(3) is at 82.30

Conclusions from 
EOD chart analysis (Stochastic)

Wave-c of Wave-B continuation with recent top formation at 32298.05 on 08-01-2021 and no confirmation of its completion yet because no selling patterns formations on EOD charts.

As Short Term Indicator Stochastic has become Overbought and showing negative divergence therefore indicating signals of Short Term correction which will be seen after complete selling patterns formations on Intraday and EOD charts.

Bank Nifty-Last 3 Sessions intraday charts analysis
Bank Nifty-Intra Day Chart (Jan 06 to Jan 08,2021):-
Technical Patterns formation in last 3 Sessions intraday charts

1- Selling(Resistances) in last 3 sessions are between:-
A- 32120-32227 
B- 32093-32167
C- 32072-32150
D- 31852-31981 
2- Consolidation(Supports) in last 3 sessions are
A- 31580-31772
3- 3 Sessions actual trading between 31549-32227 

Conclusions from 
3 Sessions intra day chart analysis 

Rally continuation with its new top formation last Friday and closing also near the top of on gong rally but good selling and minor consolidation near last 3 sessions lowest.

As good selling and only little consolidation in last 3 sessions therefore if more selling develops in next week then Short Term correction will be seen below 31549. As minor buying therefore complete consolidation is firstly required for decisive up moves above 32227.

Bank Nifty-Intra Day Chart 
Analysis(08-Jan-2021)
Bank Nifty-Intra Day Chart (08-Jan-2021):-
Technical Patterns formation in today intraday charts

1- Selling between 32120-32227
2- Selling between 32093-32167
3- Whole day actual trading between 32003-32227

Conclusions from intra day chart analysis 

Bank Nifty traded sideways between 32003-32227 last Friday with higher levels selling therefore signalling some down moves in the beginning of next week.

Bank Nifty-Conclusions
(After Putting All Studies Together)

All trends are up,Wave-c of Wave-B continuation continuation and no confirmation of its completion yet on EOD and intraday charts. 

As Short to Intermediate Term indicators have turned over bought and shown negative divergence also therefore Short to Intermediate Term correction is very much due which will be seen after complete selling patterns formation on both EOD and intraday charts 

Conclusions 
(After Putting All Studies Together)

As strong rally in Nifty IT therefore rally continuation forcefully in Nifty but Bank Nifty is under performing and slow up moves in last 3 sessions. 

Although Short to Intermediate Term indicators have turned over bought and shown negative divergence also therefore Short to Intermediate Term correction is very much due but no selling patterns formation on both EOD and Nifty intraday charts of last Friday therefore immediate correction will not be considered. 

As Bank Nifty has shown  some selling in last 3 sessions therefore if more selling develop in it and in other Indices also then  Bank Nifty will lead correction.

Nifty IT led Rally continuation and let fresh selling patterns develop on EOD and Intraday charts then Short to Intermediate Term correction will be considered according to the size of selling patterns formation. 
 Firstly watch 14178-14244 after strong Global cues today morning
Pre-open Outlook(08-01-2021)
As Dow Jones Futures is now trading more than 110 points up and all the Asian markets are trading with 0.90% to 02.5% gains therefore sentiment is Bullish today morning hence strong opening of Indian markets will be seen.

More than 9 hours selling between 14178-14244 in last 2 sessions and firstly sustaining it beyond should be watched today for first signal of next decisive moves beginning beyond this range

As good selling between 14178-14244 therefore follow up selling within or near about this range will mean sharp fall and complete consolidation is required for sustaining above it.
 Emergence of Short to Intermediate term correction expectation
Nifty-Intra Day Chart Analysis & 
Market Outlook(08-01-2021)
Nifty-Intra Day Chart (07-Jan-2021):-
Technical Patterns formation in today intraday charts

1- More than 5 hours selling between 14178-14234
2- Down moves in last hour
3- Whole day actual trading between 14124-14234

Conclusions from intra day chart analysis 

Following lines were told yesterday in "Firstly watch 14040-14244 for first signal of next Short Term trend beginning":-

1- Although Dow Jones is trading more than 700 points up but higher levels good selling between 14178-14244 today
2- until complete consolidation will not develop till then Nifty will not sustain above 14244
3- follow up selling within this range will mean sharp correction if sustains below today lowest.

As more than 5 hours follow up selling between 14178-14234 today which is within yesterday mentioned more than 4 hours good selling range(14178-14244) therefore today closing was near the lower levels of the day after last hour down moves. 

More than 9 hours selling between 14178-14244 in last 2 sessions therefore it will be immediate resistance of Nifty and Short Term indicators have turned overbought also also hence emergence of Short to Intermediate term correction expectation,its confirmation will be after sustaining below 14040 because some buying was seen above it yesterday.
 Firstly watch 14040-14244 for first signal of next Short Term trend beginning
Nifty-Intra Day Chart Analysis & 
Market Outlook(07-01-2021)
Nifty-Intra Day Chart (06-Jan-2021):-
Technical Patterns formation in today intraday charts

1- More than 4 hours selling between 14178-14244(immediate Resistances)
2- Sharp fall
3- Consolidation between 14040-14114
4- Last hour up move
5- Whole day actual trading between 14040-14244

Conclusions from intra day chart analysis 

As firstly more than 4 hours selling therefore sharp down in Mid-session but lower levels consolidation hence up moves in last hour. 

Both selling and buying between 14040-14244 therefore whole day trading will be understood with Mixed Patterns formation within this range and firstly Nifty has to trade and prepare for next decisive moves between and near about 14040-14244 as well as finally sustaining beyond this range will confirm next decisive moves.

Although Dow Jones is trading more than 700 points up but higher levels good selling between 14178-14244 today therefore until complete consolidation will not develop till then Nifty will not sustain above 14244 and follow up selling within this range will mean sharp correction if sustains below today lowest.

Firstly sustaining beyond 14040-14244 should be watched tomorrow for first signal of next Short Term trend beginning.
Firstly Short Term correction or sharp intraday fall
Nifty-Intra Day Chart Analysis & 
Market Outlook(06-01-2021)
Nifty-Intra Day Chart (05-Jan-2021):-
Technical Patterns formation in today intraday charts

1- First half hour sideways trading between 14093-14113
2- Down moves in Bullish Falling Channel
3- Slow up moves
4- Sharp fall
5- Last half hour sideways trading between 14194-14215
6- Whole day actual trading between 14076-14215

Conclusions from intra day chart analysis 

As some seling yesterday therefore Nifty slipped more then 80 points in first hour but lower levels consolidation therefore rally continuation. Although whole day slow up moves but consolidation also through intraday correction hence closing at the top of the day. As last half hour sideways trading between 14194-14215 and some selling also due to slow up moves therefore firstly consolidation is required within or near about today trading range for decisive up moves above today highest. 

Short Term indicators are completely Over bought and slow up moves in last 2 sessions therefore therefore firstly Short Term correction or sharp intraday fall is expected tomorrow before any decisive up move if fresh consolidation develops.
 Watch today trading range amid sharp down moves possibility 
Nifty-Intra Day Chart Analysis & 
Market Outlook(05-01-2021)
Nifty-Intra Day Chart (04-Jan-2021):-
Technical Patterns formation in today intraday charts

1- Selling between 14082-14112
2- Sharp fall
3- Slow up moves with downward corrections
4- Whole day actual trading between 13954-14147

Conclusions from intra day chart analysis 

As sentiment was Bullish due to Covind-19 Vaccine news and strong most Asian markets therefore gap up opening of Indian markets but immediately selling developed hence sharp fall was seen. 

Although today closing was at the top of the day but last 5 hours up moves were slow hence some selling can not be ruled and downward corrections was also seen during these up moves therefore some buying will also be considered. 

As one sided technical patterns formations were not seen during today volatility therefore Nifty will firstly trade within today trading range tomorrow and finally valid break out of today trading range should be watched in the coming sessions amid sharp down moves possibility below today lowest(13954) because today lowest was much below last Friday lowest and little above last Thursday lowest.