Correction continuation which may be deeper also
Technical Analysis,Research & EOD Outlook
(Sep 21 to Sep 25,2020)
Nifty-EOD Chart Analysis
(Wave B structure & Stochastics)
Nifty-EOD Chart (18-Sep-2020):-
Technical Patterns and Formations in EOD charts
1- Corrective Wave-A completion at 7511.10 on 24-03-2020 and Wave-B beginning
2- Wave-c of Wave-B completion indications with recent top formation at 11794.3 on 31-08-2020
3- 14 Sessions sideways trading between 11186-11585
4- Stochastic-%K(5) is at 67.87 & %D(3) is at 76.96
Conclusions from EOD chart analysis
(Wave B structure & Stochastics)
As Nifty crashed 406 points from higher levels and closed 260 points down on 31-08-2020 as well as formed long Bearish Engulfing candle on both EOD and Weekly chart therefore generated strongest indication of Wave-B completion at 11794.3 and Wave-C beginning to move towards and below the origin of Wave-B(7511.10).
Although such big fall on 31-08-2020 but after that Nifty has turned sideways between 11186-11585 immediately after that and since then trading within this range for the last 14 sessions.
Short Term indicator Stochastics has also generated correction signal in following manner:-
1- Both lines have started to move down from over bought zone.
2- %K has intersected %d downward.
Nifty-EOD Chart Analysis
(Averages,Trend line & MACD)
Nifty-EOD Chart (18-Sep-2020):-
Technical Patterns and Formations in EOD charts
1- Corrective Wave-A completion at 7511.10 on 24-03-2020 and Wave-B beginning
2- Wave-c of Wave-B completion indications with recent top formation at 11794.3 on 31-08-2020
3- Wave-B is trading below its Trend line
4- Intermediate Term Trend decider 55-Day SMA is today at 11219
5- Long Term Trend decider 200-Day SMA is today at 10779
6- MACD line intersected Average line downward
Conclusions from EOD chart analysis
(Averages,Trend line & MACD)
As Nifty is trading below Wave-B Trend line and MACD line intersected Average line downward in MACD indicator also therefore strong signals of decisive down moves beginning which will be seen in the coming week/weeks.
Now Nifty is trading above Intermediate Term Trend decider 55-Day SMA(today at 11219) and Long Term Trend decider 200-Day SMA(today at 10779) therefore Intermediate and Long Term Trends are up and Nifty will get some supports at these 2 Averages during its downward journey which should also be watched for these 2 main trends changing confirmations.
Nifty-Last 14 Sessions
intraday charts analysis
Nifty-Intra Day Chart (Sep 01 to Sep 18,2020):-
Technical Patterns formation in last 14 Sessions intraday charts
1- Selling(Resistances) in last 14 sessions are between:-
A- 11520-11584
B- 11397-11460
2- Consolidation(Supports) in last 14 sessions are sessions:-
A- 11301-11339
B- 11186-11243
C- 11343-11357
D- Double bottom supports at 11366
3- 14 Sessions actual trading between 11186-11585
Conclusions from 14 Sessions
intra day chart analysis
Nifty crashed 406 points higher levels on 31-08-2020 and after that traded last 14 sessions of this month between 11186-11585 with higher levels selling and lower levels buying.
As both higher levels higher levels good selling and lower levels equally good buying in last 14 sessions therefore Nifty will firstly trade within last 14 sessions trading range as well as prepare in the coming week for next decisive big moves beyond this range.
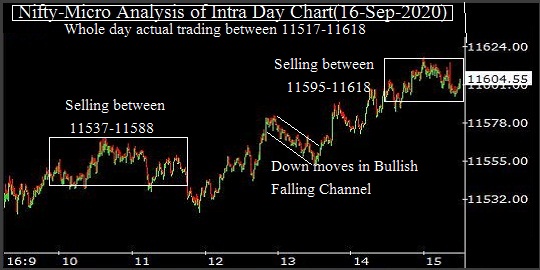
Nifty-Intra Day Chart Analysis
(18-Sep-2020)
Nifty-Intra Day Chart (18-Sep-2020):-
Technical Patterns formation in today intraday charts
1- 5 Hours selling between 11538-11584(immediate Resistances)
2- Sharp fall
3- Slow up moves and sideways trading in last hour
4- Whole day actual trading between 11447-11584
Conclusions from intra day chart analysis
As firstly 5 Hours good selling between 11538-11584 therefore sharp fall was seen. Although after that slow up moves and sideways trading in last hour but sufficient consolidation was not seen therefore more down moves are expected in the next week.
Conclusions (After Putting All Studies Together)
1- Long term trend is up and it will be down below 10779.
2- Intermediate term trend is sideways between 11186-11585 and it will be down below 11219.
3- Short term trend is has turned down in previous week.
As strongest indications of Wave-B completion and Wave-C beginning emerged on 31st Aug 2020 after 406 points sharp fall from higher levels therefore correction continuation is expected but immediately after that Nifty has turned sideways between 11186-11585 and once sustaining below it will mean huge fall because that will be Intermediate term trend turning down confirmation also after sustaining below its decider 55-Day SMA(today at 11219).
Following developments are suggesting deeper correction in the coming week/weeks:-
1- Nifty is trading below Wave-B Trend line.
2- %K has intersected %d downward in over bought zone Stochastics.
3- MACD line intersected Average line downward in MACD.
As above developments therefore correction continuation is expected in the coming week/weeks which may be deeper also.