ॐ ह्रीं श्रीं लक्ष्मीभयो नमः॥


Trading "calls" from our "Software" with more than "90% accuracy"

More than "12 years" old "only site of whole world" 
with more than "9700 accurate Outlooks" of 
"Indian Stock Markets" 

  Wave-C deeper correction confirmations from 3 levels

Technical Analysis,Research & Weekly Outlook

(Aug 10 to Aug 14,2020)

Nifty-EOD Chart Analysis

(Waves structure)

Nifty-EOD Chart (07-Aug-2020):-

Technical Patterns and Formations in EOD charts

1- Impulsive Wave-1 beginning from 6825.80 on 29-02-2016 after 1 financial year(2015-16) correction completion

2- Impulsive Wave-1 completion at 8968.70 on 07-09-2016 and corrective Wave-2 beginning

3- Corrective Wave-2 completion at 7893.80 on 26-12-2016 and impulsive Wave-3 beginning

4- Impulsive Wave-3 completion at 11171.50 on 29-01-2018 and corrective Wave-4 beginning

5- Corrective Wave-4 completion at 9951.90 on 23-03-2018 and impulsive Wave-5 beginning

6- Impulsive Wave-5 completion after new life time high formation at 12430.50 on 20-01-2020 and Wave-A of "corrective ABC Waves"  beginning

7- Corrective Wave-A completion at 7511.10 on 24-03-2020 and Wave-B beginning

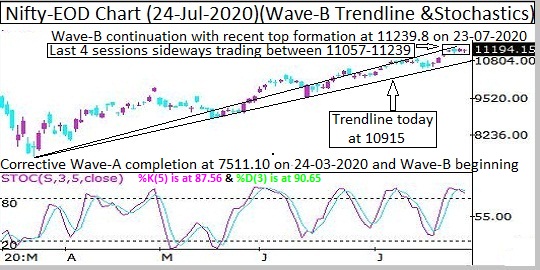
8- Wave-B continuation with recent top formation at 11341.40 on 29-07-2020

Conclusions from EOD chart analysis

(Waves structure)

Impulsive Wave-1 which started from 6825.80 on 29-02-2016 completed at 12430.50 on 20-01-2020 and its Wave-A of "corrective ABC Waves" begun. Corrective Wave-A completed at 7511.10 on 24-03-2020 and Wave-B started which is in continuation with recent top formation at 11341.40 on 29-07-2020. 

Nifty-EOD Chart Analysis 

(Wave B structure)

Nifty-EOD Chart (07-Aug-2020):-

Technical Patterns and Formations in EOD charts

1- Corrective Wave-A completion at 7511.10 on 24-03-2020 and Wave-B beginning

2- Wave-a of Wave-B(9889.05 on 30-04-2020)

3- Wave-b of Wave-B(8806.75 on 16-05-2020)

4- Wave-c of Wave-B continuation with recent top formation at 11341.40 on 29-07-2020

5- Last 15 sessions sideways trading between 10883-11341

Conclusions from EOD chart analysis (Wave B structure)

Corrective Wave-A of "ABC correction" completed at 7511.10 on 24-03-2020 and Wave-B started which is in continuation with recent top formation at 11341.40 on 29-07-2020. 

Last 15 sessions sideways trading between 10883-11341 and once sustaining below 10883 will mean first strong signals of Wave-B completion and Wave-C beginning towards and below the bottom of Wave-B(7511.10) because that will be break down confirmation of 15 sessions like big trading range.

Nifty-EOD Chart Analysis

(Average & Trendline)

Nifty-EOD Chart (07-Aug-2020):-

Technical Patterns and Formations in EOD charts

1- Corrective Wave-A completion at 7511.10 on 24-03-2020 and Wave-B beginning

2- Wave-B continuation with recent top formation at 11341.40 on 29-07-2020 

3- Wave-B Trend line at 10915

4- Long Term Trend decider 200-Day SMA is today at 10850

Conclusions from EOD chart analysis

(Average & Trendline)

Last 15 sessions lowest is at 10883 and once sustaining below it will mean break down of Wave-B Trend line also which is today at 10915 and that will be strong signal of Wave-B completion and Wave-C beginning. 

Long Term Trend decider 200-Day SMA is today at 10850 and sustaining below it will mean Long Term Trend  turning down confirmation also which will be mean decisive down moves beginning towards and below the bottom of Wave-B(7511.10) .

Nifty

Last 15 Sessions intraday charts analysis

Nifty-Intra Day Chart (Jul 20 to Aug 07,2020):-

Technical Patterns formation in last 15 Sessions intraday charts

1- Selling(Resistances) in last 15 sessions are between:- 

A- 11211-11256

B- 11244-11341

2- Consolidation(Supports) in last 15 sessions are sessions:-

A- 11027-11068

B- 10957-10998

C- 10883-10934

3- 15 Sessions actual trading between 10883-11341 

Conclusions from 15 Sessions intra day chart analysis 

Last 15 Sessions trading between 10883-11341 with lower levels supports and higher levels equally strong resistances also therefore Nifty will firstly trade and prepare for next decisive big moves within last 15 sessions trading range in next week. 

As 15 sessions like big trading range therefore finally sustaining beyond this range will certainly generate big moves which will begin in the coming week/weeks and that should be also watched for those big moves confirmations.

Nifty

Intra Day Chart Analysis(07-Aug-2020)

Nifty-Intra Day Chart (07-Aug-2020):-

Technical Patterns formation in today intraday charts

1- Sharp up after weaker opening

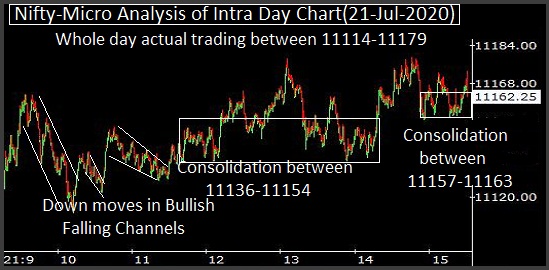
2- More than 5 hours sideways trading between 11169-11231

3- Whole day actual trading between 11143-11231

Conclusions from intra day chart analysis 

As most Asian markets were weak and some were more than 1% down last Friday morning therefore negative opening of Indian markets but sharply up after 15 minutes and after that whole day trading was sideways between 11169-11231. 

Although closing was near the higher levels of the day but clear intraday trading patterns were not seen therefore firstly sustaining beyond 11169-11231 should be watched in the coming week for first strong signal of next decisive moves beginning.

Conclusions (After Putting All Studies Together)

1- Long term trend is up.

2- Intermediate term trend is up.

3- Short term trend is sideways between 10883-11341 for the last 15 Sessions.

"ABC correction" of that rally is very much on which started from 6825.80 on 29-02-2016 completed at 12430.50 on 20-01-2020. Corrective Wave-A of this correction completed at 7511.10 and Wave-B begun which IS moving up with recent top formation at 11341.40 on 29-07-2020.

Although no confirmation of Wave-B completion yet but Nifty has turned sideways for the last 15 sessions at the top of Wave-B between 10883-11341 and finally sustaining beyond this 15 sessions trading range will decide the life of Wave-B in following manner:-     

1- Sustaining above 11341 will mean Wave-B continuation towards the top of Wave-A(12430.50)

2- Sustaining below 10883 will mean strong possibility Wave-B completion and Wave-C beginning towards and below the origin of Wave-B(7511.10)   

As both supports and resistances have been developed between 10883-11341 in the last 15 sessions therefore firstly Nifty will have to trade and prepare for those next above mentioned one sided decisive moves in the coming week. As Wave-B is more than 4 months old therefore generating a signal of time-wise correction completion also hence sustaining below 10883 and/or its forceful break down will mean much bigger down moves confirmations. 

As Wave-B seems to be mature for completion therefore finally sustaining below following 3 levels should be watched in the coming week/weeks for Wave-B completion and Wave-C beginning for deeper correction:-

1- 15 sessions trading range lowest at 10883

2- Wave-B Trend line at 10915

3- Long Term Trend decider 200-Day SMA is today at 10850 

Fresh selling will mean huge fall possibility. 

Nifty-Intra Day Chart Analysis & 

Market Outlook(07-08-2020)

Technical Patterns formation in today intraday charts

1- 3 Hours sideways trading between 11137-11188

2- Up moves after RBI Credit policy

3- Selling between 11211-11256

4- Sharp fall 

5- Slow Up moves in last hours

6- Whole day actual trading between 11128-11256

Conclusions from intra day chart analysis 

Firstly 3 Hours sideways trading and after that post RBI Credit policy Up moves but higher levels good selling therefore sharp fall after 02:15 PM. 

Although 98.5 points positive closing after slow Up moves in last hours but higher levels selling was seen within and below next resistances therefore it will be understood that follow up selling is being continuously developed at higher levels and once fresh selling tomorrow will mean huge fall possibility. 

Watch levels amid RBI Credit Policy led volatility
Post-open Outlook(06-08-2020)

As Dow Jones closed 373 points up therefore sentiment was positive today morning hence indian markets are trading in Green zone since opening. 

RBI Credit Policy at 12:00 noon today and next big moves will be according to its announcements therefore sustaining beyond following levels of Nifty and Bank Nifty should be watched today for those big moves confirmations because volatility may be high just before and after Policy announcements:-  

Bank Nifty- 21445-21920
Nifty- 11072-11224
Down moves expectations
Nifty-Intra Day Chart Analysis & 
Market Outlook(06-08-2020)
Nifty-Intra Day Chart (05-Aug-2020):-
Technical Patterns formation in today intraday charts

1- Selling between 11178-11225
2- Selling between 11103-11141
3- Sharp fall
4- Whole day actual trading between 11065-11225

Conclusions from intra day chart analysis 

Although first half hour strong 130 points rally but fresh selling was seen between 11178-11225 which was below previous resistances between 11247-11299 therefore sharp fall was seen in Mid-session. As follow up selling in last 3 hours between 11103-11141 therefore down moves are expected below today lowest(11,064.05) in the coming sessions
11075-11150 will confirm next 1% moves
Nifty-Intra Day Chart Analysis & 
Market Outlook(05-08-2020)
Nifty-Intra Day Chart (04-Aug-2020):-

Technical Patterns formation in today intraday charts

1- Whole day Up moves with downward corrections
2- Last 2 hours trading within resistance range between 11075-11112
3- Whole day actual trading between 10909-11112

Conclusions from intra day chart analysis 

As strong Global cues therefore up moves were seen after Green Opening and whole day intraday rally remain continued. Last 2 hours trading was within next resistance range(11075-11150) and finally sustaining beyond this range will confirm the life of today started rally which should be firstly watched tomorrow. 

1- Next resistances above 11150 are between 11247-11299 
2- Next supports below 11075 are between 10883-10934  

As finally sustaining beyond 11075-11150 will confirm next 1% moves towards above mentioned supports and resistances therefore should be firstly watched tomorrow.
Firstly watch 10953-11006 after strong Global Cues today 
Post-open Outlook(04-08-2020)

As all the Asian markets are strong after 0.89% positive Closing of Dow Jones yesterday therefore Indian markets are trading in Green and firstly sustaining beyond 10953-11006 should be watched today for next decisive moves confirmations.
Finally down moves continuation expectations 
Nifty-Intra Day Chart Analysis & 
Market Outlook(04-08-2020)
Nifty-Intra Day Chart (03-Aug-2020):-
Just click on chart for its enlarged view

Technical Patterns formation in today intraday charts

1- 86 Points sharp fall in first 5 minutes
2- Selling between 10953-11006(Immediate Resistances)
3- supports in last hour between 10883-10934
4- Whole day actual trading between 10883-11058

Conclusions from intra day chart analysis 

Following lines were told at 00:00 AM on 00-00-2020 in "3 Crucial levels will confirm next big corrective moves":-

down moves are expected below last Friday lowest in the beginning of next week.

Last Friday lowest was at 11026.50 and Nifty traded at 11007 within first 20 seconds today

Firstly 86 Points sharp fall was seen in first 5 minutes and after that 3 hours selling between 10953-11006 therefore down moves were seen till last half hour but minor supports at lower levels hence some up moves towards 10953 can not be ruled out tomorrow but finally correction continuation is expected below today(10883).

3 Crucial levels will confirm next big corrective moves 
Technical Analysis,Research & Weekly Outlook
(Aug 03 to Aug 07,2020)
Nifty-EOD Chart Analysis
(Corrective Waves)
Nifty-EOD Chart (31-Jul-2020):-

Technical Patterns and Formations in EOD charts

1- Impulsive Wave-5 completion at 12430.50 on 20-01-2020 and Wave-A of "corrective ABC Waves" beginning
3- Corrective Wave-A completion at 7511.10 on 24-03-2020 and Wave-B beginning
4- Wave-a of Wave-B(9889.05 on 30-04-2020)
6- Wave-b of Wave-B(8806.75 on 16-05-2020)
7- Wave-c of Wave-B continuation with recent top formation at 11341.40 on 29-07-2020
8- Last 9 sessions sideways trading between 11027-11341

Conclusions from EOD chart analysis
(Corrective Waves)

The corrective Wave-A of "ABC correction" begun from 12430.50 on 20-01-2020 completed at 7511.10 on 24-03-2020 and Wave-B started which is in continuation with recent top formation at 11341.40 on 29-07-2020. 

Last 9 sessions sideways trading between 11027-11341 and once sustaining below 11027 will mean first strong signals of deeper correction beginning.

Nifty-EOD Chart Analysis
(Average & Trendline)
Nifty-EOD Chart (31-Jul-2020):-

Technical Patterns and Formations in EOD charts

1- Corrective Wave-A completion at 7511.10 on 24-03-2020 and Wave-B beginning
2- Wave-B continuation with recent top formation at 11341.40 on 29-07-2020 
3- Wave-B Trend line today at 10915
4- Long Term Trend decider 200-Day SMA is today at 10860

Conclusions from EOD chart analysis
(Average & Trendline)

If Nifty sustains below last 9 sessions lowest(11027) then sustaining below following levels will confirm next moves:-

1- Trend line of Wave-B(today at 10915) will confirm deeper correction.
2- 200-Day SMA(today at 10862) will confirm Wave-C beginning after Wave-B completion.

Nifty-Last 9 Sessions
intraday charts analysis
Nifty-Intra Day Chart (Jul 21 to Jul 31,2020):-

Technical Patterns formation in last 9 Sessions intraday charts

1- Selling(Resistances) in last 9 sessions are between:- 
A- 11075-11150
B- 11244-11341
2- Consolidation(Supports) in last 9 sessions are sessions:-
A- 11027-11068
3- 9 Sessions actual trading between 11027-11341 

Conclusions from 9 Sessions intra day chart analysis 

As lower level minor support and higher levels good selling therefore strong indications of fresh decisive moves beginning below 11027 in the beginning of next week.

Nifty-Intra Day Chart Analysis &
Market Outlook(31-07-2020)
Nifty-Intra Day Chart (31-Jul-2020):-

Technical Patterns formation in today intraday charts

1- Selling between 11075-11150
2- Support between 11027-11068
3- Whole day actual trading between 11027-11150

Conclusions from intra day chart analysis 

Although some supports at lower levels in last hours but whole day good selling at higher levels therefore down moves are expected below last Friday lowest in the beginning of next week.

Conclusions
(After Putting All Studies Together)

1- Long term trend is up.
2- Intermediate term trend is up.
3- Short term trend is sideways between 11027-11328 for the last 9 Sessions.

Wave-B continuation with recent top formation at 11341.40 on 29-07-2020 and no confirmation of its completion yet but last 9 sessions sideways trading between 11027-11341 with higher levels good selling and lower levels minor supports therefore strong possibility of slipping below 11027 hence firstly sustaining beyond following 2 crucial levels should also be watched :-

1- Trend line of Wave-B(today at 10915) for deeper correction confirmation.
2- 200-Day SMA(today at 10862) for Wave-C beginning after Wave-B completion confirmation.

Corrective Wave-B is now mature for a deeper correction after 3817 points strong rally and above mentioned 3 crucial levels(11027/10915/10862) will confirm next big corrective moves one by one which should be watched in the coming week/weeks.
Firstly watch 11057
Nifty-Intra Day Chart Analysis & 
Market Outlook(31-07-2020)
Nifty-Intra Day Chart (30-Jul-2020):-

Technical Patterns formation in today intraday charts

1- Selling between 11247-11299(Immediate Resistances)
2- Down moves with upward corrections
3- Whole day actual trading between 11085-11299

Conclusions from intra day chart analysis 

Selling was seen between 11244-11341 yesterday and follow up selling within this range between 11247-11299 today therefore 11244-11341 will be immediate resistances of Nifty and until nifty will not sustain above 11341 after complete consolidation till then next up moves will not be seen previous multiple resistances were lying above 11244 also.

As above mentioned selling therefore down moves were seen in last 3 hours which were with upward corrections therefore more down moves are expected tomorrow also.  

As good supports are above 11057 therefore we are continuously telling its importance and once sustaining below it will mean deeper correction which should be firstly watched in the coming sessions for its confirmations.
11057 will confirm deeper correction
Nifty-Intra Day Chart Analysis &
Market Outlook(30-07-2020)
Nifty-Intra Day Chart (29-Jul-2020):-

Technical Patterns formation in today intraday charts

1- Selling between 11244-11341
2- Sideways trading between 11150-11235
3- Whole day actual trading between 11150-11341

Conclusions from intra day chart analysis 

As firstly more than 4 hours selling therefore some down moves but sharp fall was not seen and last hour sideways trading was seen between 11150-11235 therefore expected that Nifty will firstly trade within and near about this range tomorrow. 

Previous multiple resistances were lying above 11244 and fresh selling was seen within it today also. Expected that Nifty will firstly trade and prepare for next decisive moves within and near about 11057-11341 and finally sustaining beyond this range will confirm it and if fresh selling developes in the coming 2/3 sessions then deeper correction will be seen and its confirmation will be sustaining below 11057.
As not feeling well therefore Stock Market Outlook of today(29-07-2020) is not being updated but tomorrow Outlook will be posted positively.
As not feeling well therefore Stock Market Outlook of today(28-07-2020) is not being updated.
Crucial levels will firstly indicate and after that confirm deeper correction
Nifty & Bank Nifty Weekly Outlook
(Jul 27 to Jul 31,2020)
Nifty-EOD Chart Analysis 
(Wave-B Trendline & Stochastics)
Nifty-EOD Chart (24-Jul-2020):-

Technical Patterns and Formations in EOD charts

1- Corrective Wave-A completion at 7511.10 on 24-03-2020 and Wave-B beginning
2- Wave-B continuation with recent top formation at 11239.8 on 23-07-2020
3- Stochastic-%K(5) is at 87.56 & %D(3) is at 90.65
4- Last 4 sessions sideways trading between 11057-11239
5- Trend line today at 10915

Conclusions from EOD chart analysis
(Wave-B Trend line & Stochastics)

Wave-B continuation with recent top formation at 11239.8 and no confirmation of its completion yet.

As %K(5) of Short Term Indicator Stochastics has intersected downward %D(3) in overbought zone therefore emergence of Short Term correction expectations in the coming week and following levels should be watched for the life and size of expected correction:-

1- Last 4 sessions sideways trading between 11057-11239 and moving below 11057 will be first indication of correction beginning.
2- Trend line of Wave-B is today at 10915 and its valid break down will be correction confirmation.
3- 200-Day SMA is today at 10862 and sustaining below it will mean strong possibility of Wave-C beginning after Wave-B completion.

Nifty
Last 4 Sessions intraday charts analysis
Nifty-Intra Day Chart (Jul 21 to Jul 24,2020):-

Technical Patterns formation in last 4 Sessions intraday charts

1- Selling(Resistances) in last 4 sessions are between:- 
A- 11091-11146
B- 11057-11105
2- Consolidation(Supports) in last 4 sessions are sessions:-
A- 11157-11178
B- 11180-11239 
3- 4 Sessions actual trading between 11057-11239 

Conclusions from 4 Sessions intra day chart analysis 

As both lower levels supports and higher levels selling in the last 4 sessions therefore Bank Nifty will firstly trade and prepare for next decisive moves within last 4 Sessions trading range(11057-11239) in coming week,finally sustaining it beyond will confirm next big moves which should be watched in next week.

Nifty-Intra Day Chart Analysi
(24-Jul-2020)
Nifty-Intra Day Chart (24-Jul-2020):-

Technical Patterns formation in today intraday charts

1- Consolidation between 11091-11146(Immediate Supports)
2- Up moves in Bearish Rising Channel
3- Sideways trading between 11177-11208
4- Whole day actual trading between 11091-11225

Conclusions from intra day chart analysis 

As firstly lower levels consolidation therefore up moves were seen which were in Bearish Rising Channel hence some selling was also seen at higher levels and sideways trading developed between 11177-11208 in last hour. 

Both consolidation and selling was seen last Friday between 11091-11225 and expected that Nifty will firstly trade and prepare for next decisive moves within this range in the beginning of next week but expected that finally Nifty will slip below 11091 after fresh selling in next week.

Bank Nifty-EOD Chart Analysis
(Wave-B Trend line & Stochastics)
Bank Nifty-EOD Chart (24-Jul-2020):-

Technical Patterns and Formations in EOD charts

1- Corrective Wave-A completion at 16116..3 on 24-03-2020 and Wave-B beginning
2- Wave-B continuation with recent top formation at 23211.3 on 22-07-2020
3- Trendline today at 21964
4- Stochastic-%K(5) is at 74.93 & %D(3) is at 84.86
5- Last 4 sessions sideways trading between 22418-23211

Conclusions from EOD chart analysis
(Wave-B Trend line & Stochastics)

Wave-B continuation with recent top formation at 23211.3 and no confirmation of its completion yet.

As %K(5) of Short Term Indicator Stochastics has intersected downward %D(3) in overbought zone therefore emergence of Short Term correction expectations in the coming week and following levels should be watched for the life and size of expected correction:-  

1- Last 4 sessions sideways trading between 22418-23211 and moving below 22418 will be first indication of correction beginning.
2- Trend line of Wave-B is today at 21964 and its valid break down will be correction confirmation.
3- 55-Day SMA is today at 20706 and sustaining below it will mean strong possibility of Wave-C beginning after Wave-B completion.

Bank Nifty
Last 4 Sessions intraday charts analysis
Bank Nifty-Intra Day Chart (Jul 21 to Jul 24,2020):-

Technical Patterns formation in last 4 Sessions intraday charts

1- Selling(Resistances) in last 4 sessions are between:- 
A- 22628-22774
B- 22775-23211
2- Consolidation(Supports) in last 4 sessions are sessions:-
A- 22418-22565
B- 22630-22709
3- 4 Sessions actual trading between 22418-23211 

Conclusions from 4 Sessions intra day chart analysis

As both lower levels supports and higher levels selling in the last 4 sessions therefore Bank Nifty will firstly trade and prepare for next decisive moves within last 4 Sessions trading range(22418-23211) in coming week,finally sustaining it beyond will confirm next big moves which should be watched in next week.

Bank Nifty
Intra Day Chart Analysis(24-Jul-2020)
Bank Nifty-Intra Day Chart (24-Jul-2020):-

Technical Patterns formation in today intraday charts

1- Selling between 22628-22774(Immediate Resistances)
2- Down moves
3- Consolidation between 22417-22565(Immediate Supports)
4- Up moves in Bearish Rising Channel
5- Sideways trading between 22610-22704
6- Whole day actual trading between 22417-22854

Conclusions from intra day chart analysis 

As firstly selling after much weaker opening therefore more down moves were seen but lower levels some consolidation hence some up moves after 01:30 PM. Up moves in Bearish Rising Channel and Sideways trading in last hour hence good selling will be understood last Friday. 

Some consolidation was also seen at lower levels therefore expected that Nifty will firstly trade and prepare for next decisive moves  between 22417-22774 in the beginning of next week but expected that finally Nifty will slip below 11091 after fresh selling in next week. 

Conclusions
(After Putting All Studies Together)

Although Wave-B continuation with recent top formation at 11239.8 & 23211.3 and no confirmation of its completion yet but now this rally is very much mature for a deeper correction and Short Term indicators have also turned overbought therefore once sustaining below above mentioned 4 sessions lowest(11057 & 22418) will mean strong indications of that deeper correction beginning.  

All the crucial levels for next moves beginning of Nifty and Bank Nifty has been updated above in EOD Charts analysis which should be watched in the coming week/weeks for that deeper correction beginning indications/confirmations. 
11057 will confirm sharp fall
Nifty-Intra Day Chart Analysis & 
Market Outlook(24-07-2020)
Nifty-Intra Day Chart (23-Jul-2020):-
Just click on chart for its enlarged view
Technical Patterns formation in today intraday charts

1- Up moves in Bearish Rising Channel
2- Selling between 11180-11239 
3- Whole day actual trading between 11128-11239

Conclusions from intra day chart analysis 

Following lines were told yesterday in "Follow up selling will mean sharp fall possibility":-

follow up selling tomorrow and sustaining below today lowest(11057) will mean emergence of sharp fall possibility therefore be cautious.

As follow up selling was seen firstly through Up moves in Bearish Rising Channel and after that selling between 11180-11239 today therefore sustaining below 11057 should be firstly watched tomorrow for sharp fall confirmations.
Follow up selling will mean sharp fall possibility
Nifty-Intra Day Chart Analysis & 
Market Outlook(23-07-2020)
Nifty-Intra Day Chart (22-Jul-2020):-
Technical Patterns formation in today intraday charts

1- Up moves in Bearish Rising Channel
2- Down moves with upward corrections
3- Up moves in last hour
4- Whole day actual trading between 11057-11238

Conclusions from intra day chart analysis 

Following lines were told yesterday in "Firstly watch 11244 amid rally continuation expectations":-

rally will remain continued towards 11244

As was told yesterday 100% same happened today and rally will remain continued with today highest formation at 11238.10 which is just below 11244

As firstly selling was seen through Up moves in Bearish Rising Channel down moves were seen with upward corrections which means that with follow up selling. Although Up moves in last hour but good selling today therefore Nifty will not be able to move above today highest(11238) and once follow up selling tomorrow and sustaining below today lowest(11057) will mean emergence of sharp fall possibility therefore be cautious.
Firstly watch 11244 amid rally continuation expectations
Nifty-Intra Day Chart Analysis &
Market Outlook(22-07-2020)
Nifty-Intra Day Chart (21-Jul-2020):-
Just click on chart for its enlarged view
Technical Patterns formation in today intraday charts

1- Down moves in Bullish Falling Channel
2- Consolidation between 11136-11154(Immediate Supports)
3- Consolidation between 11157-11163
4- Whole day actual trading between 11114-11179

Conclusions from intra day chart analysis 

Following lines were told on 18-07-2020 in "Finally Rally towards next resistances ":-

100.0% Fibonacci Extension Target of Wave-B is at 11184.70 and and rally continuation is expected towards and just above it in next week.

Rally continuation was told towards 11184.70 and today highest was just below it at 11,179.55.

As good intraday consolidation and no selling pattern formations today therefore rally will remain continued towards 11244 but sustaining above it should be firstly watched in the coming sessions because:-

1- Gap resistances are between 11036-11244. 
2- Multiple resistances are lying above 11244.
3- Short Term indicators are about to be Overbought.
As busy therefore Stock Market Outlook of today(21-07-2020) is not being updated.
Finally Rally towards next resistances 
 Nifty & Bank Nifty Weekly Outlook
(Jul 20 to Jul 24,2020)
Nifty-EOD Chart Analysis
(Wave-B structure)
Nifty-EOD Chart (17-Jul-2020):-

Technical Patterns and Formations in EOD charts

1- Corrective Wave-A completion at 7511.10 on 24-03-2020 and Wave-B beginning
2- Wave-a of Wave-B(9889.05 on 30-04-2020)
3- Wave-a of Wave-B gained 2377.95 points
4- Wave-b of Wave-B(8806.75 on 16-05-2020)
5- Wave-c of Wave-B continuation with recent top formation at 10933.45 on 17-07-2020
6- 100% Fibonacci Extension Target of Wave-c of Wave-B is at 11184.70{8806.75+2377.95(100% of 2377.95)}

Conclusions from EOD chart analysis
(Wave-B structure)

Wave-c of Wave-B is very much on and no confirmation of its completion yet as well as its continuation is expected towards its next 100.0% Fibonacci Extension Target at 11184.70.

Nifty-EOD Chart Analysis
(Averages & Stochastics)
Nifty-EOD Chart (17-Jul-2020):-

Technical Patterns and Formations in EOD charts

1- Corrective Wave-A completion at 7511.10 on 24-03-2020 and Wave-B beginning
2- Wave-B continuation with recent top formation at 10933.45 on 17-07-2020
3- SMA(Simple Moving Averages)
A- 5-Day SMA is at 10734
B- 13-Day SMA is at 10700
C- 55-Day SMA is at 9930
D- 200-Day SMA is at 10870
4- Stochastic-%K(5) is at 53.86 & %D(3) is at 37.03

Conclusions from EOD chart analysis
(Averages & Stochastics)

Wave-B continuation with recent top formation at 10933.45 on 17-07-2020 and no indication of its completion yet. 

As %K(5) of Short Term Indicator Stochastics has intersected upward %D(3) from just above oversold zone therefore indications of more up moves in the coming week.

Short term averages are trading above longer term averages and Nifty has closed above  Long Term Trend decider 200-Day SMA(today at 10870) last Friday therefore strength will be understood in Indian markets. Although Nifty has closed above Long Term Trend decider 200-Day SMA but sustaining above it must for Long Term Trend turning up confirmations which should also be watched for further decisive up moves continuation confirmations because many times corrective rally completes near about 200-Day SMA also.

Nifty-Intra Day Chart Analysis
(17-Jul-2020)
Nifty-Intra Day Chart (17-Jul-2020):-

Technical Patterns formation in today intraday charts

1- Consolidation between 10781-10840(Immediate Supports)
2- Sharp up in last hour
3- Whole day actual trading between 10749-10933

Conclusions from intra day chart analysis 

As more than 5 hours consolidation between 10781-10840 therefore strong up moves were seen in last hour and until Nifty will not sustain below 10781 after complete selling till then decisive down moves will not be seen as well as up moves will be seen above last Friday highest(10933.45) after follow up consolidation between and near about 10840-10933.

Nifty-conclusions
(After Putting All Studies Together)

1- Signals of Long term trend turning up after Nifty closing above it last Friday.
2- Intermediate term trend is up
3- Short term trend is up

Next supports of Nifty are as follows:-

1- 10781-10840
2- 10630-10696
3- 10498-10535
4- 10400-10447
5- 10299-10358
6- 10224-10320
7- 10082-10133
8- 9866-9922

Next resistances of Nifty are as follows:-

1- 11036-11244(Gap resistance)

As Nifty closed at the top of Wave-B last Friday after lower levels good consolidation same day and no intraday selling patterns formations therefore rally continuation will be expected in next week. As very Short Term indicators have turned Overbought therefore very Short Term correction may be seen in the beginning of next week but finally up moves will remain continued after maximum 1/2 sessions corrections because short Term indicator has started to move up from just above Oversold zone.

100.0% Fibonacci Extension Target of Wave-B is at 11184.70 and and rally continuation is expected towards and just above it in next week. As next gap resistance is between 11036-11244 therefore firstly this range should be watched in next week/weeks because strong resistances are lying above it and once sustaining below 11036 after complete selling patterns on Intraday and EOD charts will mean strong signals of Wave-B completion and Wave-C beginning towards and below the origin of Wave-B(7511.10)

Bank Nifty-EOD Chart Analysis
(Wave-B structure & Stochastics)
Bank Nifty-EOD Chart (17-Jul-2020):-

Technical Patterns and Formations in EOD charts

1- Corrective Wave-A completion at 16116..3 on 24-03-2020 and Wave-B beginning
2- Wave-a of Wave-B completion at 21967.0 on 30-04-2020
3- Wave-b of Wave-B completion at 17105.0 on 22-05-2020
4- Wave-c of Wave-B continuation with recent top formation at 23080.6 on 08-07-2020
5- Stochastic-%K(5) is at 31.92 & %D(3) is at 18.74

Conclusions from EOD chart analysis
(Wave-B structure & Stochastics)

Wave-c of Wave-B continuation with recent top formation at 10631.30 and no confirmation of its completion yet.

As %K(5) of Short Term Indicator Stochastics has intersected upward %D(3) from oversold zone therefore indications of more up moves in the coming week.

Bank Nifty-Intra Day Chart Analysis
(17-Jul-2020)
Nifty-Intra Day Chart (17-Jul-2020):-

Technical Patterns formation in today intraday charts

1- Consolidation between 21551-21830(Immediate Supports)
2- Sharp up in last hour
3- Whole day actual trading between 21551-22065

Conclusions from intra day chart analysis 

As more than 5 hours consolidation between 21551-21830 therefore strong up moves were seen in last hour and until Nifty will not sustain below 21551 after complete selling till then decisive down moves will not be seen as well as up moves will be seen above last Friday highest(10933.45) after follow up consolidation between and near about 21830-22065.

Bank Nifty-conclusions
(After Putting All Studies Together)

1- Long term trend is down 
2- Intermediate term trend is sideways
3- Short term trend is sideways 

Next supports of Bank Nifty are as follows:-

1- 21551-21830
2- 21030-21341

Next resistances of Bank Nifty are as follows:-

1- 22320-22502
2- 22742-22866
3- 22970-23065

As very Short Term indicators have turned Overbought therefore very Short Term correction may be seen in the beginning of next week but finally up moves will remain continued towards above mentioned resistances after maximum 1/2 sessions corrections because short Term indicator has started to move up from Oversold zone.

Bank Nifty is completely under performing Nifty and NIFTYTIT and sideways for the last 20 sessions between 20927-23080 as well as much below Long Term trend decider 200-Day SMA(today at 26176) while  Nifty and NIFTYTIT have closed above it last Friday. As such weakness therefore remain cautious in Bank Nifty because much deeper and faster correction will be seen in it after corrective Wave-C beginning.

Conclusions
(After Putting All Studies Together)

Although firstly Very Short Term and intraday correction expectation in the beginning of next week but finally up moves of Wave-B will remain continued towards above mentioned next resistances. 

Expected that Nifty will not be able to sustain above next resistance(11244) and Bank Nifty will also not be able to sustain above next resistance(23065) and finally corrective Wave-C will begin towards and below the origin of Wave-B(7511.10 & 16116.3) after complete selling patterns formation on intradaay and EOD charts.
Break out of 10596-10827 will generate next decisive moves
Nifty-Intra Day Chart Analysis & 
Market Outlook(17-07-2020)
Nifty-Intra Day Chart Analysis(16-Jul-2020)
Just click on chart for its enlarged view
Technical Patterns formation in today intraday charts

1- Consolidation between 10596-10625(Immediate Supports)
2- Consolidation between 10630-10696(Immediate Supports)
3- Sharp up in last half hour
4- Whole day actual trading between 10596-10755

Conclusions from intra day chart analysis 

As whole day good consolidation therefore sharp up in last half hour was seen but equally good selling at higher levels between 10768-10827 yesterday hence could not move above it today. 

Last 2 sessions trading between 10596-10827 with lower levels good consolidation and higher levels good selling therefore Nifty will trade within this range tomorrow and prepare for next decisive moves within this range and finally break out this range will generate next decisive moves which should be firstly watched in the coming sessions.
Follow up selling tomorrow will mean deeper correction
Nifty-Intra Day Chart Analysis & 
Market Outlook(16-07-2020)
Nifty-Intra Day Chart (15-Jul-2020):-
Just click on chart for its enlarged view
Technical Patterns formation in today intraday charts

1- Up moves in Bearish Rising Channel
2- Selling between 10768-10827(Immediate Resistances)
3- Sharp fall in last hours
4- Whole day actual trading between 10578-10827

Conclusions from intra day chart analysis 

As strong closing of US markets yesterday and most Asian markets were also trading with good gains as well as expectations from AGM of RIL at 02:00 PM today therefore up moves were seen after strong opening but Up moves were in Bearish Rising Channel and selling developed at higher levels. 

As soon as AGM of RIL begins then sharp fall started which remain continued till last 15 Minutes because good selling was done on the back of heated sentiments which developed due to above mentioned positive developments.

As higher levels good selling today and once follow up selling tomorrow will mean correction continuation towards and below yesterday mentioned supports. Some supports was seen at lower levels(10563) yesterday and today also got supports just above it therefore firstly sustaining it beyond should be watched tomorrow for correction continuation confirmations which may be deeper also. 
Finally correction after fresh selling in the coming 1/2 selling
Nifty-Intra Day Chart Analysis & 
Market Outlook(15-07-2020)
Nifty-Intra Day Chart Analysis(14-Jul-2020)
Just click on chart for its enlarged view
Technical Patterns formation in today intraday charts

1- Selling between 10700-10741
2- Selling between 10622-10667
3- Down moves in Bullish Falling Channel
4- Sideways trading between 10595-10642
5- Whole day actual trading between 10563-10755

Conclusions from intra day chart analysis 

As all the Asian markets were weak after US markets sharp fall from higher levels therefore Indian markets slipped sharply after minor gap down opening and selling was seen in first 3 hours. Some supports was also seen at lower levels after some consolidation through Down moves in Bullish Falling Channel and sideways trading was seen in last 2 hours between 10595-10642 therefore Firstly Nifty will trade and prepare for next moves between and near about 10563-10642 tomorrow.

Next supports below today lowest are as follows:- 

1- 10498-10535
2- 10400-10447
3- 10299-10358
4- 10224-10320
5- 10082-10133
6- 9866-9922

Expected that finally correction will be seen below today lowest(10563) and towards above supports after fresh selling in the coming 1/2 selling.