As market has not shown required strength after Green opening today therefore view will start to become positive after sustaining above 5920.

ॐ ह्रीं श्रीं लक्ष्मीभयो नमः॥

Technical Analysis and Market Outlook(27-12-2012)
Nifty-Micro Analysis of 2 Sessions Intra Day Chart
(Dec 24 & Dec 27,2012)
Nifty-Intra Day Chart (Dec 24 & Dec 27,2012):- |
| Just click on chart for its enlarged view |
1- Consolidation and Support between 5846-5865 in last 2 sessions.
2- More than 3 hours mixed intraday patterns between 5900-5917 on 26-12-2012
3- 2 Sessions actual trading between 5846-5917
Conclusions from 2 Sessions intra day chart analysis
Now next moves preparation trading range is 5865-5965 in all types of sentiments and firstly trading within this range is expected in the coming couple of sessions. Let intraday charts form and show next moves preparations then will be updated accordingly in the coming Outlooks.

FII & DII trading activity in Capital Market Segment on 26-Dec-2012
| ||||||||||||||||
| ||||||||||||||||
Nifty Spot-Levels & Trading Strategy for 27-12-2012
R3 5986
R2 5951
R1 5928
Avg 5893
S1 5870
S2 5835
S3 5812
Nifty Spot-Trading Strategy
H6 5963 Trgt 2
H5 5950 Trgt 1
H4 5936 Long breakout
H3 5920 Go Short
H2 5915
H1 5910
L1 5899
L2 5894
L3 5889 Long
L4 5873 Short Breakout
L5 5859 Trgt 1
L6 5846 Trgt 2
Nifty(Dec Fut)-Levels & Trading Strategy for 27-12-2012
R3 6000
R2 5963
R1 5938
Avg 5901
S1 5876
S2 5839
S3 5814
Nifty(Dec Fut)-Trading Strategy
H6 5975 Trgt 2
H5 5961 Trgt 1
H4 5947 Long breakout
H3 5930 Go Short
H2 5924
H1 5918
L1 5907
L2 5901
L3 5895 Long
L4 5878 Short Breakout
L5 5864 Trgt 1
L6 5850 Trgt 2
Bank Nifty(Dec Fut)-Levels & Trading Strategy for 27-12-2012
R3 12826
R2 12686
R1 12597
Avg 12457
S1 12368
S2 12228
S3 12139
Bank Nifty(Dec Fut)-Trading Strategy
H6 12740 Trgt 2
H5 12687 Trgt 1
H4 12633 Long breakout
H3 12570 Go Short
H2 12549
H1 12528
L1 12487
L2 12466
L3 12445 Long
L4 12382 Short Breakout
L5 12328 Trgt 1
L6 12275 Trgt 2
Pre-Closing Outlook(26-12-2012)
Forceful up moves after more than 8 hours consolidations and last more than 3 hours mixed intraday patterns trading between 5900-5917 which is within and just below next strong resistance range 5910-5965. As last 3 hours trading with mixed intraday patterns therefore more follow up consolidation is required for valid break out of 17 sessions range(5823-5965).
Now next moves preparation trading range is 5865-5965 in all types of sentiments. Although finally rally above 5865 is expected but firstly follow up consolidations is must to cross above mentioned strong resistance.
Now next moves preparation trading range is 5865-5965 in all types of sentiments. Although finally rally above 5865 is expected but firstly follow up consolidations is must to cross above mentioned strong resistance.
Mid-session Outlook(26-12-2012)
Indian markets are more than .75% up today but it was was projected in our both previous Outlooks and following lines were told:-
1- We told in Mid-session Outlook(24-12-2012):-"lower levels supports and emergence of consolidation patterns also therefore fresh up move hopes turned alive today"
2- Today at 08:09 AM in Technical Analysis and Research For 26-12-2012:-"Lower levels supports with intraday consolidation patterns therefore fresh up move hopes turned alive on 24-12-2012"
First resistance forcefully crossed after more than 8 hours consolidations but strong resistances between 5910-5965 therefore now more follow up consolidation is required for valid break out of 17 sessions range. Sustaining above 5965 should be firstly watched now for Sub Wave-5 of Wave-3 strong rally confirmations.
Technical Analysis and Research For 26-12-2012
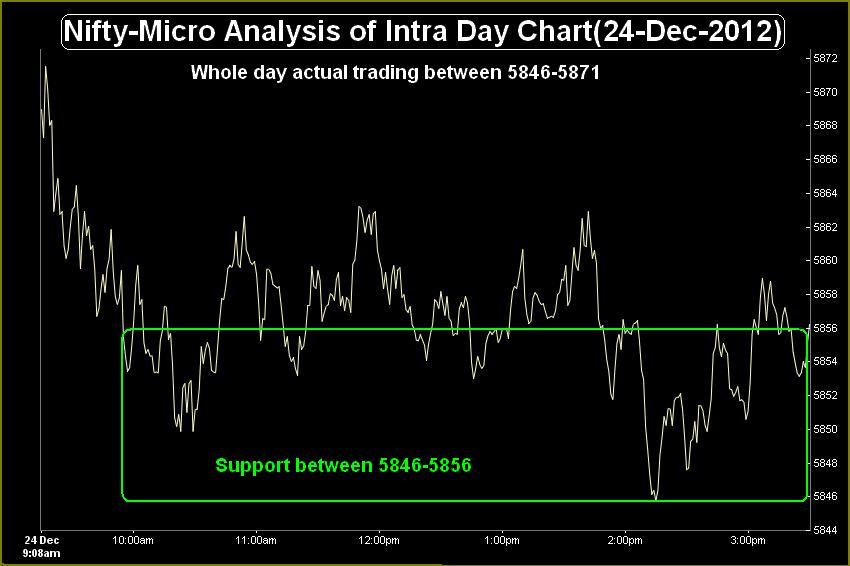
Nifty-Intra Day Chart (24-Dec-2012):-
Technical Patterns and Formations in today intraday charts
1- Support between 5846-5856
2- Whole day actual trading between 5846-5871
Lower levels supports with intraday consolidation patterns therefore fresh up move hopes turned alive on 24-12-2012 but good selling at higher levels and development of strong multiple resistances also in last 16 sessions sideways trading therefore follow up complete consolidation is required in the coming sessions and sustaining beyond next first resistance range(5868-5882) will be fresh up moves confirmation.
Long Term Trend is up,Short Term is down and Intermediate Term is sideways between(5823-5965) for the last 16 sessions with lower levels supports and higher levels resistances. Indian markets are not prepared for any side decisive trend and will firstly trade within 5823-5965. Follow up moves and valid break out of following ranges should be firstly watched for:-
1- Next trend first strong indication 5846-5882
2- Next trend first confirmations 5823-5965
 |
| Just click on chart for its enlarged view |
1- Support between 5846-5856
2- Whole day actual trading between 5846-5871
Conclusions from intra day chart analysis
Lower levels supports with intraday consolidation patterns therefore fresh up move hopes turned alive on 24-12-2012 but good selling at higher levels and development of strong multiple resistances also in last 16 sessions sideways trading therefore follow up complete consolidation is required in the coming sessions and sustaining beyond next first resistance range(5868-5882) will be fresh up moves confirmation.
Long Term Trend is up,Short Term is down and Intermediate Term is sideways between(5823-5965) for the last 16 sessions with lower levels supports and higher levels resistances. Indian markets are not prepared for any side decisive trend and will firstly trade within 5823-5965. Follow up moves and valid break out of following ranges should be firstly watched for:-
1- Next trend first strong indication 5846-5882
2- Next trend first confirmations 5823-5965

FII & DII trading activity in Capital Market Segment on 24-Dec-2012
| ||||||||||||||||
| ||||||||||||||||
Nifty Spot-Levels & Trading Strategy for 26-12-2012
Nifty Spot-Levels
R3 5896
R2 5883
R1 5869
Avg 5856
S1 5842
S2 5829
S3 5815
Nifty Spot-Trading Strategy
H6 5882 Trgt 2
H5 5875 Trgt 1
H4 5869 Long breakout
H3 5862 Go Short
H2 5859
H1 5857
L1 5852
L2 5850
L3 5847 Long
L4 5840 Short Breakout
L5 5834 Trgt 1
L6 5827 Trgt 2
Nifty(Dec Fut)-Levels & Trading Strategy for 26-12-2012
R3 5901
R2 5889
R1 5877
Avg 5865
S1 5853
S2 5841
S3 5829
Nifty(Dec Fut)-Trading Strategy
H6 5889 Trgt 2
H5 5883 Trgt 1
H4 5878 Long breakout
H3 5871 Go Short
H2 5869
H1 5867
L1 5862
L2 5860
L3 5858 Long
L4 5851 Short Breakout
L5 5846 Trgt 1
L6 5840 Trgt 2
Bank Nifty(Dec Fut)-Levels & Trading Strategy for 26-12-2012
R3 12509
R2 12453
R1 12396
Avg 12340
S1 12283
S2 12227
S3 12170
Bank Nifty(Dec Fut)-Trading Strategy
H6 12452 Trgt 2
H5 12426 Trgt 1
H4 12401 Long breakout
H3 12370 Go Short
H2 12359
H1 12349
L1 12328
L2 12318
L3 12307 Long
L4 12276 Short Breakout
L5 12251 Trgt 1
L6 12225 Trgt 2
.jpg)
Mid-session Outlook(24-12-2012)
Although all Asian markets were positive and SGX Nifty was also trading +25 but we told following lines at 08:54 AM in Pre-open Outlook(24-12-2012):-
1- good selling between 5868-5882 on 21-12-2012
2- complete consolidation is required for decisive up moves above 5882.
3- Until Nifty will not sustain above 5882 till then next up move will not be considered.
Nifty traded first more than 4 hours below 5882 and most time trading between 5850-5865 but with lower levels supports and emergence of consolidation patterns also therefore fresh up move hopes turned alive today. As good selling at higher levels and development of multiple resistances in last 15 sessions therefore more consolidation is required and sustaining above 5882 will be fresh up moves confirmation.
Pre-open Outlook(24-12-2012)
All the Asian markets are positive today morning therefore Green opening will be seen in Indian markets but good selling between 5868-5882 on 21-12-2012 and complete consolidation is required for decisive up moves above 5882. Until Nifty will not sustain above 5882 till then next up move will not be considered.
Detaied analysis has already been updated on 22-12-2012.Just click following topic link and understand Indian markets technicals:-
Detaied analysis has already been updated on 22-12-2012.Just click following topic link and understand Indian markets technicals:-
Live Proofs of profitable calls to our Paid Clients

We always talk with those proofs which no one can deny. Following proofs are being shown to prove that we understood selling well before beginning of today down moves and then updated selling patterns message in our this Blog as well as also sent Nifty Futures selling and Put Option(5900) buying SMS to our paid clients:-
1st proof is that we posted following line at 12:37 PM in Mid-session Outlook(21-12-2012)
"Selling patterns formations in first 3 hours intraday charts"
Following NIFTY Dec F&O shorting SMS was sent to our paid Clients at 12:53 PM today:-
NIFTY-Dec Fut-Sell and/or Dec Put Options(5900)-Buy-Positional-SL-5906 & TGT-5836-CMP-5883(Dec Fut-Rates are given for all trading)(Lalit39)
Following covering SMS of above call was sent to our paid Clients at 03:21 PM today:-
NIFTY Dec F&O(Shorted on 21-12-2012)-Cover and book profit immediately-CMP-5852(Lalit39)
We always send 2 SMS for each and every call and their covering messages from those fastest websites which deliver SMS within 15 seconds. Live proofs of above mentioned SMS pictures are as follows:-
1st Website- Nifty Shorting and Covering messages SMS pictures are as follows:-


1- Firstly click on above SMS picture and enlarge it.
2- If unable to read then Save picture on yours desktop and after that
3- Open and again enlarge the picture in Windows Picture Viewer.
Only 2 following information are deleted in above Picture due to official secrecy rules:-
1- Numbers of sent SMS.
2- SMS sending Website name.
Most Crucial and Next Big Trend Decider 15 Sessions Range
Technical Analysis,Research & Weekly Outlook
(Dec 24 to Dec 28,2012)
Nifty-EOD Chart (21-Dec-2012):- |
| Just click on chart for its enlarged view |
1- 4770.35 on 04-06-2012(Correctine Wave-2 completion and impulsive Wave-3 beginning)
2- 5348.55 on 10-07-2012(Sub Wave-1)
3- 5032.40 on 26-07-2012(Sub Wave-2)
4- 5815.35 on 05-10-2012(Sub Wave-3)
5- 5548.35 on 20-11-2012(Sub Wave-4)
6- 44 Sessions sideways Sub Wave-4 correction between 5549-5815 with Bullish Flag formation.
7- 44 Sessions break out above 5815 on 29-11-2012.
8- Sub Wave-5 of Wave-3 confirmation and continuation.
9- 15 Sessions sideways trading between 5823-5965.
Conclusions from EOD chart analysis
Sub Wave-5 of Wave-3 continuation after completion of 44 sessions Sub Wave-4 sideways correction between 5549-5815. Although 44 sessions trading range broken out forcefully on 29-11-2012 but no strong rally after break out and market again trapped sideways between 5823-5965 for the last 15 sessions. As last 15 sessions trading range is just above the top of previous 44 sessions trading range therefore firstly technical positions of last 15 sessions trading has to be understood.
Nifty-Micro Analysis of 15 Sessions Intra Day Chart
(Dec 03 to Dec 21,2012)
Nifty-Intra Day Chart (Dec 03 to Dec 21,2012):- |
| Just click on chart for its enlarged view |
1- Supports between 5823-5860
2- Resistances between 5870-5965
3- 15 Sessions sideways trading between 5823-5965
Conclusions from 15 Sessions intra day chart analysis
Good selling and strong resistances formations at higher levels and lower levels some supports which have weakened also in previous week.
Conclusions (After Putting All Studies Together)
All trends are up and Sub Wave-5 of Wave-3 continuation after Sub Wave-4 correction completion with Bullish Flag formation. As Sub Wave-5 did not showed strong rally and turned side ways for the last 15 sessions as well as good selling also at higher levels therefore complete consolidation is required in the coming week for break out of last 15 sessions trading range. View is cautious now because follow up selling with slipping below 5815 will mean also possibility of false break out on 29-11-2012.
As intraday supports also seen at lower levels in last 15 sessions sideways trading therefore impulsive Sub Wave-5 of Wave-3 rally hopes are still alive but follow up complete consolidation is must in the beginning of next week for decisive up moves above 5965. As last 15 sessions sideways trading range(5823-5965) is most crucial and next trend deciding therefore its valid break out should be firstly watched in the coming week/weeks for next following moves confirmations:-
1- Above 5965 will mean strong rally of Sub Wave-5 of Wave-3.
2- Below 5823 will mean Sub Wave-5 failure and reentering into 44 sessions sideways trading range with shifting of next supports above 5549.
Subscribe to:
Posts (Atom)