

ॐ ह्रीं श्रीं लक्ष्मीभयो नमः॥

FII & DII trading activity in Capital Market Segment on 24-Dec-2012
| ||||||||||||||||
| ||||||||||||||||
Nifty Spot-Levels & Trading Strategy for 26-12-2012
Nifty Spot-Levels
R3 5896
R2 5883
R1 5869
Avg 5856
S1 5842
S2 5829
S3 5815
Nifty Spot-Trading Strategy
H6 5882 Trgt 2
H5 5875 Trgt 1
H4 5869 Long breakout
H3 5862 Go Short
H2 5859
H1 5857
L1 5852
L2 5850
L3 5847 Long
L4 5840 Short Breakout
L5 5834 Trgt 1
L6 5827 Trgt 2
Nifty(Dec Fut)-Levels & Trading Strategy for 26-12-2012
R3 5901
R2 5889
R1 5877
Avg 5865
S1 5853
S2 5841
S3 5829
Nifty(Dec Fut)-Trading Strategy
H6 5889 Trgt 2
H5 5883 Trgt 1
H4 5878 Long breakout
H3 5871 Go Short
H2 5869
H1 5867
L1 5862
L2 5860
L3 5858 Long
L4 5851 Short Breakout
L5 5846 Trgt 1
L6 5840 Trgt 2
Bank Nifty(Dec Fut)-Levels & Trading Strategy for 26-12-2012
R3 12509
R2 12453
R1 12396
Avg 12340
S1 12283
S2 12227
S3 12170
Bank Nifty(Dec Fut)-Trading Strategy
H6 12452 Trgt 2
H5 12426 Trgt 1
H4 12401 Long breakout
H3 12370 Go Short
H2 12359
H1 12349
L1 12328
L2 12318
L3 12307 Long
L4 12276 Short Breakout
L5 12251 Trgt 1
L6 12225 Trgt 2
.jpg)
Mid-session Outlook(24-12-2012)
Although all Asian markets were positive and SGX Nifty was also trading +25 but we told following lines at 08:54 AM in Pre-open Outlook(24-12-2012):-
1- good selling between 5868-5882 on 21-12-2012
2- complete consolidation is required for decisive up moves above 5882.
3- Until Nifty will not sustain above 5882 till then next up move will not be considered.
Nifty traded first more than 4 hours below 5882 and most time trading between 5850-5865 but with lower levels supports and emergence of consolidation patterns also therefore fresh up move hopes turned alive today. As good selling at higher levels and development of multiple resistances in last 15 sessions therefore more consolidation is required and sustaining above 5882 will be fresh up moves confirmation.
Pre-open Outlook(24-12-2012)
All the Asian markets are positive today morning therefore Green opening will be seen in Indian markets but good selling between 5868-5882 on 21-12-2012 and complete consolidation is required for decisive up moves above 5882. Until Nifty will not sustain above 5882 till then next up move will not be considered.
Detaied analysis has already been updated on 22-12-2012.Just click following topic link and understand Indian markets technicals:-
Detaied analysis has already been updated on 22-12-2012.Just click following topic link and understand Indian markets technicals:-
Live Proofs of profitable calls to our Paid Clients

We always talk with those proofs which no one can deny. Following proofs are being shown to prove that we understood selling well before beginning of today down moves and then updated selling patterns message in our this Blog as well as also sent Nifty Futures selling and Put Option(5900) buying SMS to our paid clients:-
1st proof is that we posted following line at 12:37 PM in Mid-session Outlook(21-12-2012)
"Selling patterns formations in first 3 hours intraday charts"
Following NIFTY Dec F&O shorting SMS was sent to our paid Clients at 12:53 PM today:-
NIFTY-Dec Fut-Sell and/or Dec Put Options(5900)-Buy-Positional-SL-5906 & TGT-5836-CMP-5883(Dec Fut-Rates are given for all trading)(Lalit39)
Following covering SMS of above call was sent to our paid Clients at 03:21 PM today:-
NIFTY Dec F&O(Shorted on 21-12-2012)-Cover and book profit immediately-CMP-5852(Lalit39)
We always send 2 SMS for each and every call and their covering messages from those fastest websites which deliver SMS within 15 seconds. Live proofs of above mentioned SMS pictures are as follows:-
1st Website- Nifty Shorting and Covering messages SMS pictures are as follows:-


1- Firstly click on above SMS picture and enlarge it.
2- If unable to read then Save picture on yours desktop and after that
3- Open and again enlarge the picture in Windows Picture Viewer.
Only 2 following information are deleted in above Picture due to official secrecy rules:-
1- Numbers of sent SMS.
2- SMS sending Website name.
Most Crucial and Next Big Trend Decider 15 Sessions Range
Technical Analysis,Research & Weekly Outlook
(Dec 24 to Dec 28,2012)
Nifty-EOD Chart (21-Dec-2012):- |
| Just click on chart for its enlarged view |
1- 4770.35 on 04-06-2012(Correctine Wave-2 completion and impulsive Wave-3 beginning)
2- 5348.55 on 10-07-2012(Sub Wave-1)
3- 5032.40 on 26-07-2012(Sub Wave-2)
4- 5815.35 on 05-10-2012(Sub Wave-3)
5- 5548.35 on 20-11-2012(Sub Wave-4)
6- 44 Sessions sideways Sub Wave-4 correction between 5549-5815 with Bullish Flag formation.
7- 44 Sessions break out above 5815 on 29-11-2012.
8- Sub Wave-5 of Wave-3 confirmation and continuation.
9- 15 Sessions sideways trading between 5823-5965.
Conclusions from EOD chart analysis
Sub Wave-5 of Wave-3 continuation after completion of 44 sessions Sub Wave-4 sideways correction between 5549-5815. Although 44 sessions trading range broken out forcefully on 29-11-2012 but no strong rally after break out and market again trapped sideways between 5823-5965 for the last 15 sessions. As last 15 sessions trading range is just above the top of previous 44 sessions trading range therefore firstly technical positions of last 15 sessions trading has to be understood.
Nifty-Micro Analysis of 15 Sessions Intra Day Chart
(Dec 03 to Dec 21,2012)
Nifty-Intra Day Chart (Dec 03 to Dec 21,2012):- |
| Just click on chart for its enlarged view |
1- Supports between 5823-5860
2- Resistances between 5870-5965
3- 15 Sessions sideways trading between 5823-5965
Conclusions from 15 Sessions intra day chart analysis
Good selling and strong resistances formations at higher levels and lower levels some supports which have weakened also in previous week.
Conclusions (After Putting All Studies Together)
All trends are up and Sub Wave-5 of Wave-3 continuation after Sub Wave-4 correction completion with Bullish Flag formation. As Sub Wave-5 did not showed strong rally and turned side ways for the last 15 sessions as well as good selling also at higher levels therefore complete consolidation is required in the coming week for break out of last 15 sessions trading range. View is cautious now because follow up selling with slipping below 5815 will mean also possibility of false break out on 29-11-2012.
As intraday supports also seen at lower levels in last 15 sessions sideways trading therefore impulsive Sub Wave-5 of Wave-3 rally hopes are still alive but follow up complete consolidation is must in the beginning of next week for decisive up moves above 5965. As last 15 sessions sideways trading range(5823-5965) is most crucial and next trend deciding therefore its valid break out should be firstly watched in the coming week/weeks for next following moves confirmations:-
1- Above 5965 will mean strong rally of Sub Wave-5 of Wave-3.
2- Below 5823 will mean Sub Wave-5 failure and reentering into 44 sessions sideways trading range with shifting of next supports above 5549.

FII & DII trading activity in Capital Market Segment on 21-Dec-2012
| ||||||||||||||||
| ||||||||||||||||
Indian Stock Markets Closing Reports(21-Dec-2012)
1- All the Indices closed in Red.
2- Black Candle formations.
3- Closing near lower levels after last hours down moves.
Ratios
Index Options Put Call Ratio: 0.91
Total Options Put Call Ratio: 0.88
Nifty P/E Ratio(21-Dec-2012): 18.22
Advances & Declines
BSE Advances : 937
BSE Declines : 1,990
NSE Advances : 422
NSE Declines : 1,345
Nifty Open Interest Changed Today
Nifty- 5700 CE(Dec)- -66,900(-7.97%)
Nifty- 5700 PE(Dec)- 585,900(8.21%)
Nifty- 5800 CE(Dec)- 1,035,450(50.95%)
Nifty- 5800 PE(Dec)- -663,000(-6.98%)
Nifty- 5900 CE(Dec)- 1,521,850(22.93%)
Nifty- 5900 PE(Dec)- -2,036,800(-30.39%)
Nifty- 6000 CE(Dec)- 489,800(4.07%)
Nifty- 6000 PE(Dec)- -1,517,700(-45.09%)
Closing
Sensex- closed at 19,242.00(-211.92 Points & -1.09%)
Nifty- closed at 5,847.70(-68.70 Points & -1.16%)
CNX Midcap - closed at 8,334.40(-137.20 Points & -1.62%)
CNX Smallcap- closed at 3,663.20(-64.80 Points & -1.74%)
Nifty Spot-Levels & Trading Strategy for 24-12-2012
R3 5923
R2 5905
R1 5876
Avg 5858
S1 5829
S2 5811
S3 5782
Nifty Spot-Trading Strategy
H6 5894 Trgt 2
H5 5883 Trgt 1
H4 5872 Long breakout
H3 5859 Go Short
H2 5855
H1 5851
L1 5842
L2 5838
L3 5834 Long
L4 5821 Short Breakout
L5 5810 Trgt 1
L6 5799 Trgt 2
Nifty(Dec Fut)-Levels & Trading Strategy for 24-12-2012
R3 5947
R2 5926
R1 5889
Avg 5868
S1 5831
S2 5810
S3 5773
Nifty(Dec Fut)-Trading Strategy
H6 5911 Trgt 2
H5 5897 Trgt 1
H4 5884 Long breakout
H3 5868 Go Short
H2 5863
H1 5858
L1 5847
L2 5842
L3 5837 Long
L4 5821 Short Breakout
L5 5808 Trgt 1
L6 5794 Trgt 2
Bank Nifty(Dec Fut)-Levels & Trading Strategy for 24-12-2012
R3 12586
R2 12530
R1 12438
Avg 12382
S1 12290
S2 12234
S3 12142
Bank Nifty(Dec Fut)-Trading Strategy
H6 12495 Trgt 2
H5 12461 Trgt 1
H4 12428 Long breakout
H3 12387 Go Short
H2 12374
H1 12360
L1 12333
L2 12319
L3 12306 Long
L4 12265 Short Breakout
L5 12232 Trgt 1
L6 12198 Trgt 2
Nifty Spot-Weekly Levels & Trading Strategy(Dec 24 to Dec 28,2012)
R3 6032
R2 5985
R1 5916
Avg 5869
S1 5800
S2 5753
S3 5684
Nifty Spot-Weekly Trading Strategy
H6 5963 Trgt 2
H5 5937 Trgt 1
H4 5910 Long breakout
H3 5878 Go Short
H2 5868
H1 5857
L1 5836
L2 5825
L3 5815 Long
L4 5783 Short Breakout
L5 5756 Trgt 1
L6 5730 Trgt 2
Bank Nifty Spot-Weekly Levels & Trading Strategy(Dec 24 to Dec 28,2012)
R3 12900
R2 12736
R1 12525
Avg 12361
S1 12150
S2 11986
S3 11775
Bank Nifty Spot-Weekly Trading Strategy
H6 12693 Trgt 2
H5 12607 Trgt 1
H4 12521 Long breakout
H3 12418 Go Short
H2 12383
H1 12349
L1 12280
L2 12246
L3 12211 Long
L4 12108 Short Breakout
L5 12022 Trgt 1
L6 11936 Trgt 2
Technical Analysis and Market Outlook(21-12-2012)
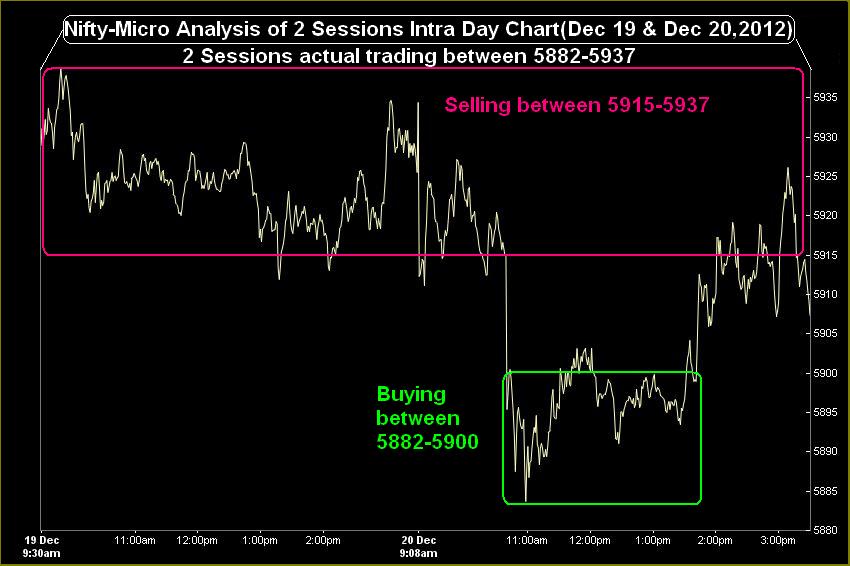
Nifty-Intra Day Chart (Dec 19 & Dec 20,2012):-
Technical Patterns and Formations in last 2 Sessions intraday charts
1- Selling between 5915-5937
2- Buying between 5882-5900
3- 2 Sessions actual trading between 5882-5937
Sub Wave-5 of Wave-3 continuation with upward Long and Intermediate term trends but sideways Short term trend for the last 15 sessions between 5823-5965. As 15 sessions sideways market therefore its valid break out will have sufficient strength to decide next strong moves,technical positions of last 15 sessions are as follows:-
1- Strong supports are between 5839-5860.
2- Strong resistances are between 5915-5965.
Pre-open Outlook(21-12-2012)
As Dow's Futures is 188 points down and all the Asian markets are in Red therefore sentiment is weak today morning and gap down opening will be seen in Indian markets. Nifty will firstly trade and prepare for next moves between 5860-5915 today because strong resistances above and strong supports below this range.
As Long and Intermediate term trends are up and Indian markets are Bullish therefore expected that finally 15 sessions range valid break out will be seen above 5965 but market will take its own time and will trade some more sessions between 5823-5965.
 |
| Just click on chart for its enlarged view |
1- Selling between 5915-5937
2- Buying between 5882-5900
3- 2 Sessions actual trading between 5882-5937
Conclusions from 2 Sessions intra day chart analysis
Sub Wave-5 of Wave-3 continuation with upward Long and Intermediate term trends but sideways Short term trend for the last 15 sessions between 5823-5965. As 15 sessions sideways market therefore its valid break out will have sufficient strength to decide next strong moves,technical positions of last 15 sessions are as follows:-
1- Strong supports are between 5839-5860.
2- Strong resistances are between 5915-5965.
Pre-open Outlook(21-12-2012)
As Dow's Futures is 188 points down and all the Asian markets are in Red therefore sentiment is weak today morning and gap down opening will be seen in Indian markets. Nifty will firstly trade and prepare for next moves between 5860-5915 today because strong resistances above and strong supports below this range.
As Long and Intermediate term trends are up and Indian markets are Bullish therefore expected that finally 15 sessions range valid break out will be seen above 5965 but market will take its own time and will trade some more sessions between 5823-5965.
Subscribe to:
Posts (Atom)