ॐ ह्रीं श्रीं लक्ष्मीभयो नमः॥


Trading "calls" from our "Software" with more than "90% accuracy"

More than "12 years" old "only site of whole world" 
with more than "9700 accurate Outlooks" of 
"Indian Stock Markets" 

Indian Stock Markets Closing Reports(20-Sep-2012)

Main features of today trading are as follows

1- All the Indices closed in Red except IT and FMCG.
2- Inverted Hammer Candle formation.
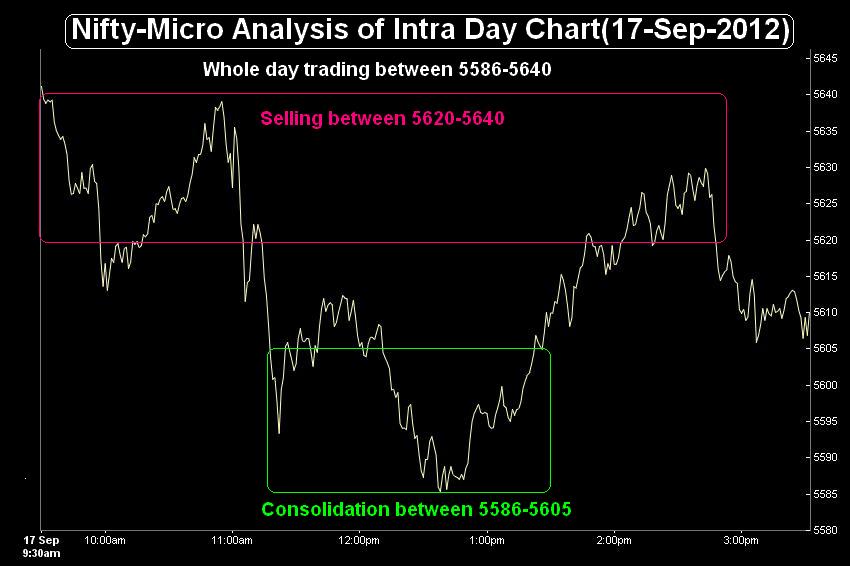
3- Most of the time sideways market with intraday selling patterns.

Ratios

Nifty Put Call Ratio: 1.24
Nifty P/E Ratio(01-Aug-2012): 17.63

Advances & Declines

BSE Advances : 1155
BSE Declines : 1639
NSE Advances :  490
NSE Declines :  945

Nifty Open Interest Changed Today

Nifty- 5300 CE(Aug)- -66,650(-3.67%)
Nifty- 5300 PE(Aug)- -486,200(-5.78%)

Nifty- 5400 CE(Aug)- -147,350(-5.96%)
Nifty- 5400 PE(Aug)-  226,500(2.89%)

Nifty- 5500 CE(Aug)- 287,450(7.77%)
Nifty- 5500 PE(Aug)- 398,950(5.56%)

Nifty- 5600 CE(Aug)- 636,250(10.09%)
Nifty- 5600 PE(Aug)- -548,450(-9.13%)

Nifty- 5700 CE(Aug)- 252,500(3.57%)
Nifty- 5700 PE(Aug)- -356,750(-20.89%)

Closing 

Nifty- closed at 5,554.25(-45.80 Points & -0.82%)
Sensex- closed at 18,349.25(-146.76 Points & -0.79% )
CNX Midcap - closed at 7,510.65(-52.90 Points & -0.70%)
BSE SMLcap- closed at 6,710.97(-35.69 Points & -0.53%)

Nifty Spot-Levels & Trading Strategy for 21-09-2012

Nifty Spot-Levels

R3 5625
R2 5603
R1 5578
Avg 5556
S1 5531
S2 5509
S3 5484

Nifty Spot-Trading Strategy

H6  5601    Trgt 2
H5  5590    Trgt 1
H4  5579    Long breakout
H3  5566    Go Short
H2  5562
H1  5558
L1  5549
L2  5545
L3  5541   Long
L4  5528   Short Breakout
L5  5517   Trgt 1
L6  5506   Trgt 2

Nifty(Sep Fut)-Levels & Trading Strategy for 21-09-2012

Nifty(Sep Fut)-Levels

R3 5636
R2 5615
R1 5593
Avg 5572
S1 5550
S2 5529
S3 5507

Nifty(Sep Fut)-Trading Strategy

H6 5614     Trgt 2
H5 5604    Trgt 1
H4 5594     Long breakout
H3 5582     Go Short
H2 5578
H1 5574
L1 5657
L2 5563
L3 5559     Long
L4 5547    Short Breakout
L5 5537     Trgt 1
L6 5527     Trgt 2

Bank Nifty(Sep Fut)-Levels & Trading Strategy for 21-09-2012

Bank Nifty(Sep Fut)-Levels

R3 11166
R2 11106
R1 11029
Avg 10969
S1 10892
S2 10832
S3 10755

Bank Nifty(Sep Fut)-Trading Strategy

H6  11089    Trgt 2
H5  11058    Trgt 1
H4  11027    Long breakout
H3  10989    Go Short
H2  10977
H1  10964
L1  10939
L2  10926
L3  10914    Long
L4  10876    Short Breakout
L5  10845    Trgt 1
L6  10814    Trgt 2

Pre-Closing Outlook(20-09-2012)

Whole day trading between 5562-5581 with intraday selling patterns therefore correction continuation possibility turning higher today.

Mid-session Outlook(20-09-2012)

Higher levels selling between 5586-5640 and correction through gap down opening after negative political news flow. As political uncertainity will remain continued and Indian markets will react also accordingly as well as volatility will remain high and trader's stop losses will also trigger therefore cautious approach is required.

As strong up moves in previous weeks therefore its correction was required and being seen today on the back of political uncertainity. Next support is at 5527 and this levels should be watched for correction completion confirmation. 

Nifty-Micro Analysis of Intra Day Chart For 20-09-2012

Nifty-Intra Day Chart (18-Sep-2012):-
Just click on chart for its enlarged view
Technical Patterns and Formations in today intraday charts

1- Whole day slow down moves in Falling Channel.
2- Whole day acual trading between 5593-5619

Conclusions from intra day chart analysis 

Whole day slow down moves in Falling Channel and it is consolidation formation but political uncertainity today and rolling back of possibility of previous week reform decisions therefore correction possibility is also turning alive because intraday higher levels selling was also seen on 17-09-2012.

Last 2 sessions trading between 5586-5640 with confirm higher levels selling. As yesterday intraday charts are showing consolidation indications therefore correction beginning confirmation is required through sustaining below 5586 after above mentioned negative news flow. 

FII Trading Data in Derivatives Segment on 18-Sep-2012


FII & DII trading activity in Capital Market Segment on 18-Sep-2012

FII trading activity on NSE and BSE in Capital Julket Segment(In Rs. Crores)
CategoryDateBuy ValueSell ValueNet Value
FII18-Sep-20123764.112714.941049.17

DII trading activity on NSE and BSE in Capital Julket Segment(In Rs. Crores)
CategoryDateBuy ValueSell ValueNet Value
DII18-Sep-20121506.032176.75-670.72

Indian Stock Markets Closing Reports(18-Sep-2012)

Main features of today trading are as follows

1- Benchmark Indtces closed in Red with minor loss but MIDCAP and SMALLCAP Indices closed positive with sufficient gains.
2- Doji Candle formation.
3- Whole day narrow range trading.

Ratios

Nifty Put Call Ratio: 1.18
Nifty P/E Ratio(01-Aug-2012): 17.76

Advances & Declines

BSE Advances : 1676
BSE Declines : 1221
NSE Advances :  898
NSE Declines :  553

Nifty Open Interest Changed Today

Nifty- 5300 CE(Aug)- -184,550(-9.22%)
Nifty- 5300 PE(Aug)- -91,250(-1.07%)

Nifty- 5400 CE(Aug)- -342,300(-12.17%)
Nifty- 5400 PE(Aug)-  297,700(3.96%)

Nifty- 5500 CE(Aug)- -110,500(-2.90%)
Nifty- 5500 PE(Aug)-  941,150(15.09%)

Nifty- 5600 CE(Aug)- -457,550(-6.77%)
Nifty- 5600 PE(Aug)-  274,600(4.79%)

Nifty- 5700 CE(Aug)-  885,950(14.31%)
Nifty- 5700 PE(Aug)-  154,100(9.92%)

Closing 

Nifty- closed at 5,600.05(-9.95 Points & -0.18%)
Sensex- closed at 18,496.01(-46.30 Points & -0.25% )
CNX Midcap - closed at 7,563.55(98.40 Points & 1.32%)
BSE SMLcap- closed at 6,746.66(49.00 Points & 0.73%)

Nifty Spot-Levels & Trading Strategy for 20-09-2012

Nifty Spot-Levels

R3 5652
R2 5636
R1 5618
Avg 5602
S1 5584
S2 5568
S3 5550

Nifty Spot-Trading Strategy

H6  5634    Trgt 2
H5  5626    Trgt 1
H4  5618    Long breakout
H3  5609    Go Short
H2  5606
H1  5603
L1  5596
L2  5593
L3  5590    Long
L4  5581    Short Breakout
L5  5573    Trgt 1
L6  5565    Trgt 2

Nifty(Sep Fut)-Levels & Trading Strategy for 20-09-2012

Nifty(Sep Fut)-Levels

R3 5658
R2 5644
R1 5628
Avg 5614
S1 5598
S2 5584
S3 5568

Nifty(Sep Fut)-Trading Strategy

H6 5642     Trgt 2
H5 5635     Trgt 1
H4 5628     Long breakout
H3 5620     Go Short
H2 5617
H1 5614
L1 5609
L2 5606
L3 5603     Long
L4 5595     Short Breakout
L5 5588     Trgt 1
L6 5581     Trgt 2

Bank Nifty(Sep Fut)-Levels & Trading Strategy for 20-09-2012

Bank Nifty(Sep Fut)-Levels

R3 11315
R2 11202
R1 11132
Avg 11019
S1 10949
S2 10836
S3 10766

Bank Nifty(Sep Fut)-Trading Strategy

H6 11247     Trgt 2
H5 11205     Trgt 1
H4 11162     Long breakout
H3 11112     Go Short
H2 11095
H1 11078
L1 11045
L2 11028
L3 11011     Long
L4 10961     Short Breakout
L5 10918     Trgt 1
L6 10876     Trgt 2

Technical Analysis and Market Outlook(18-09-2012)

Nifty-Intra Day Chart (17-Sep-2012):-
Just click on chart for its enlarged view
Technical Patterns and Formations in today intraday charts

1- Selling between 5620-5640
2- Consolidation between 5586-5605
3- Whole day trading between

Conclusions from intra day chart analysis 

Whole day sideways intraday trading yesterday between 5586-5640 with higher levels selling patterns between 5620-5640 and minor consolidation between 5586-5605 . Follow up selling today and sustaining below 5586 will be very short term correction confirmation. As daily indicators are overbought also therefore mentioned correction possibility turned higher yesterday. 

All trends are up and Indian markets are in the hands of Bulls but very short term correction possibility after strong gains in previous sessions. As both lower levels buying and higher levels intraday selling yesterday therefore Nifty will firstly trade and prepare for next decisive moves between yesterday intraday trading range(5586-5640),its break out will decide for further rally without correction or after correction.

FII Trading Data in Derivatives Segment on 17-Sep-2012


FII & DII trading activity in Capital Market Segment on 17-Sep-2012

FII trading activity on NSE and BSE in Capital Julket Segment(In Rs. Crores)
CategoryDateBuy ValueSell ValueNet Value
FII17-Sep-20125889.333637.162252.17

DII trading activity on NSE and BSE in Capital Julket Segment(In Rs. Crores)
CategoryDateBuy ValueSell ValueNet Value
DII17-Sep-20122248.963086.68-837.72

Indian Stock Markets Closing Reports(17-Sep-2012)

Main features of today trading are as follows

1- Benchmark Indices closed in Green.
2- Black Candle formation.
3- Sideways market with higher levels sleling.

Ratios

Nifty Put Call Ratio: 0.98
Nifty P/E Ratio(01-Aug-2012): 17.80

Advances & Declines

BSE Advances : 1613
BSE Declines : 1288
NSE Advances :  864
NSE Declines :  594

Nifty Open Interest Changed Today

Nifty- 5400 CE(Aug)- -695,300(-19.82%)
Nifty- 5400 PE(Aug)- -6,200(-0.08%)

Nifty- 5500 CE(Aug)- -1,514,600(-28.44%)
Nifty- 5500 PE(Aug)-  899,100(16.84%)

Nifty- 5600 CE(Aug)- -1,398,550(-17.14%)
Nifty- 5600 PE(Aug)-  1,108,050(23.94%)

Nifty- 5700 CE(Aug)- 771,300(14.23%)
Nifty- 5700 PE(Aug)- 884,750(132.30%)

Closing 

Nifty- closed at 5,610.00(32.35 Points & 0.58%)
Sensex- closed at 18,542.31(78.04 Points & 0.42% )
CNX Midcap - closed at 7,470.85(125.15 Points & 1.71%)
BSE SMLcap- closed at 6,697.66(74.54 Points & 1.13%)

Nifty Spot-Levels & Trading Strategy for 18-09-2012

Nifty Spot-Levels

R3 5713
R2 5682
R1 5646
Avg 5615
S1 5579
S2 5548
S3 5512

Nifty Spot-Trading Strategy

H6  5677    Trgt 2
H5  5662    Trgt 1
H4  5646    Long breakout
H3  5628    Go Short
H2  5622
H1  5616
L1  5603
L2  5597
L3  5591    Long
L4  5573    Short Breakout
L5  5557    Trgt 1
L6  5542    Trgt 2

Nifty(Sep Fut)-Levels & Trading Strategy for 18-09-2012

Nifty(Sep Fut)-Levels

R3 5736
R2 5703
R1 5659
Avg 5626
S1 5582
S2 5549
S3 5505

Nifty(Sep Fut)-Trading Strategy

H6 5693     Trgt 2
H5 5675     Trgt 1
H4 5658     Long breakout
H3 5637     Go Short
H2 5630
H1 5623
L1 5608
L2 5601
L3 5594     Long
L4 5573    Short Breakout
L5 5556     Trgt 1
L6 5538     Trgt 2

Bank Nifty(Sep Fut)-Levels & Trading Strategy for 18-09-2012

Bank Nifty(Sep Fut)-Levels

R3 11353
R2 11199
R1 11088
Avg 10934
S1 10823
S2 10669
S3 10558

Bank Nifty(Sep Fut)-Trading Strategy

H6  11246    Trgt 2
H5  11184    Trgt 1
H4  11122    Long breakout
H3  11049   Go Short
H2  11025
H1  11001
L1  10952
L2  10928
L3  10904    Long
L4  10831    Short Breakout
L5  10769    Trgt 1
L6  10707    Trgt 2

Pre-Closing Outlook(17-09-2012)

Whole day sideways intraday trading between 5586-5640 with higher levels selling patterns between 5620-5640. Follow up selling tomorrow and sustaining below 5586 will be very short term correction confirmation. As daily indicators are overbought also therefore mentioned correction possibility turning higher today.