

ॐ ह्रीं श्रीं लक्ष्मीभयो नमः॥

FII & DII trading activity in Capital Market Segment on 18-Sep-2012
| ||||||||||||||||
| ||||||||||||||||
Indian Stock Markets Closing Reports(18-Sep-2012)
Main features of today trading are as follows
1- Benchmark Indtces closed in Red with minor loss but MIDCAP and SMALLCAP Indices closed positive with sufficient gains.
2- Doji Candle formation.
3- Whole day narrow range trading.
Ratios
Nifty Put Call Ratio: 1.18
Nifty P/E Ratio(01-Aug-2012): 17.76
Advances & Declines
BSE Advances : 1676
BSE Declines : 1221
NSE Advances : 898
NSE Declines : 553
Nifty Open Interest Changed Today
Nifty- 5300 CE(Aug)- -184,550(-9.22%)
Nifty- 5300 PE(Aug)- -91,250(-1.07%)
Nifty- 5400 CE(Aug)- -342,300(-12.17%)
Nifty- 5400 PE(Aug)- 297,700(3.96%)
Nifty- 5500 CE(Aug)- -110,500(-2.90%)
Nifty- 5500 PE(Aug)- 941,150(15.09%)
Nifty- 5600 CE(Aug)- -457,550(-6.77%)
Nifty- 5600 PE(Aug)- 274,600(4.79%)
Nifty- 5700 CE(Aug)- 885,950(14.31%)
Nifty- 5700 PE(Aug)- 154,100(9.92%)
Closing
Nifty- closed at 5,600.05(-9.95 Points & -0.18%)
Sensex- closed at 18,496.01(-46.30 Points & -0.25% )
CNX Midcap - closed at 7,563.55(98.40 Points & 1.32%)
BSE SMLcap- closed at 6,746.66(49.00 Points & 0.73%)
Nifty Spot-Levels & Trading Strategy for 20-09-2012
Nifty Spot-Levels
R3 5652
R2 5636
R1 5618
Avg 5602
S1 5584
S2 5568
S3 5550
Nifty Spot-Trading Strategy
H6 5634 Trgt 2
H5 5626 Trgt 1
H4 5618 Long breakout
H3 5609 Go Short
H2 5606
H1 5603
L1 5596
L2 5593
L3 5590 Long
L4 5581 Short Breakout
L5 5573 Trgt 1
L6 5565 Trgt 2
R3 5652
R2 5636
R1 5618
Avg 5602
S1 5584
S2 5568
S3 5550
Nifty Spot-Trading Strategy
H6 5634 Trgt 2
H5 5626 Trgt 1
H4 5618 Long breakout
H3 5609 Go Short
H2 5606
H1 5603
L1 5596
L2 5593
L3 5590 Long
L4 5581 Short Breakout
L5 5573 Trgt 1
L6 5565 Trgt 2
Nifty(Sep Fut)-Levels & Trading Strategy for 20-09-2012
Nifty(Sep Fut)-Levels
R3 5658
R2 5644
R1 5628
Avg 5614
S1 5598
S2 5584
S3 5568
Nifty(Sep Fut)-Trading Strategy
H6 5642 Trgt 2
H5 5635 Trgt 1
H4 5628 Long breakout
H3 5620 Go Short
H2 5617
H1 5614
L1 5609
L2 5606
L3 5603 Long
L4 5595 Short Breakout
L5 5588 Trgt 1
L6 5581 Trgt 2
R3 5658
R2 5644
R1 5628
Avg 5614
S1 5598
S2 5584
S3 5568
Nifty(Sep Fut)-Trading Strategy
H6 5642 Trgt 2
H5 5635 Trgt 1
H4 5628 Long breakout
H3 5620 Go Short
H2 5617
H1 5614
L1 5609
L2 5606
L3 5603 Long
L4 5595 Short Breakout
L5 5588 Trgt 1
L6 5581 Trgt 2
Bank Nifty(Sep Fut)-Levels & Trading Strategy for 20-09-2012
Bank Nifty(Sep Fut)-Levels
R3 11315
R2 11202
R1 11132
Avg 11019
S1 10949
S2 10836
S3 10766
Bank Nifty(Sep Fut)-Trading Strategy
H6 11247 Trgt 2
H5 11205 Trgt 1
H4 11162 Long breakout
H3 11112 Go Short
H2 11095
H1 11078
L1 11045
L2 11028
L3 11011 Long
L4 10961 Short Breakout
L5 10918 Trgt 1
L6 10876 Trgt 2
R3 11315
R2 11202
R1 11132
Avg 11019
S1 10949
S2 10836
S3 10766
Bank Nifty(Sep Fut)-Trading Strategy
H6 11247 Trgt 2
H5 11205 Trgt 1
H4 11162 Long breakout
H3 11112 Go Short
H2 11095
H1 11078
L1 11045
L2 11028
L3 11011 Long
L4 10961 Short Breakout
L5 10918 Trgt 1
L6 10876 Trgt 2
Technical Analysis and Market Outlook(18-09-2012)
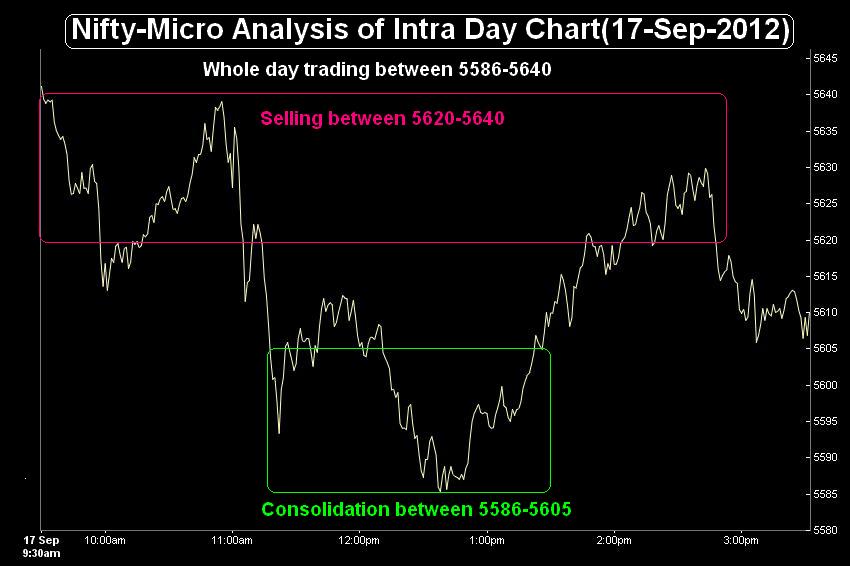
Nifty-Intra Day Chart (17-Sep-2012):-
Technical Patterns and Formations in today intraday charts
1- Selling between 5620-5640
2- Consolidation between 5586-5605
3- Whole day trading between
Whole day sideways intraday trading yesterday between 5586-5640 with higher levels selling patterns between 5620-5640 and minor consolidation between 5586-5605 . Follow up selling today and sustaining below 5586 will be very short term correction confirmation. As daily indicators are overbought also therefore mentioned correction possibility turned higher yesterday.
All trends are up and Indian markets are in the hands of Bulls but very short term correction possibility after strong gains in previous sessions. As both lower levels buying and higher levels intraday selling yesterday therefore Nifty will firstly trade and prepare for next decisive moves between yesterday intraday trading range(5586-5640),its break out will decide for further rally without correction or after correction.
 |
| Just click on chart for its enlarged view |
1- Selling between 5620-5640
2- Consolidation between 5586-5605
3- Whole day trading between
Conclusions from intra day chart analysis
Whole day sideways intraday trading yesterday between 5586-5640 with higher levels selling patterns between 5620-5640 and minor consolidation between 5586-5605 . Follow up selling today and sustaining below 5586 will be very short term correction confirmation. As daily indicators are overbought also therefore mentioned correction possibility turned higher yesterday.
All trends are up and Indian markets are in the hands of Bulls but very short term correction possibility after strong gains in previous sessions. As both lower levels buying and higher levels intraday selling yesterday therefore Nifty will firstly trade and prepare for next decisive moves between yesterday intraday trading range(5586-5640),its break out will decide for further rally without correction or after correction.

FII & DII trading activity in Capital Market Segment on 17-Sep-2012
| ||||||||||||||||
| ||||||||||||||||
Indian Stock Markets Closing Reports(17-Sep-2012)
Main features of today trading are as follows
1- Benchmark Indices closed in Green.
2- Black Candle formation.
3- Sideways market with higher levels sleling.
Ratios
Nifty Put Call Ratio: 0.98
Nifty P/E Ratio(01-Aug-2012): 17.80
Advances & Declines
BSE Advances : 1613
BSE Declines : 1288
NSE Advances : 864
NSE Declines : 594
Nifty Open Interest Changed Today
Nifty- 5400 CE(Aug)- -695,300(-19.82%)
Nifty- 5400 PE(Aug)- -6,200(-0.08%)
Nifty- 5500 CE(Aug)- -1,514,600(-28.44%)
Nifty- 5500 PE(Aug)- 899,100(16.84%)
Nifty- 5600 CE(Aug)- -1,398,550(-17.14%)
Nifty- 5600 PE(Aug)- 1,108,050(23.94%)
Nifty- 5700 CE(Aug)- 771,300(14.23%)
Nifty- 5700 PE(Aug)- 884,750(132.30%)
Closing
Nifty- closed at 5,610.00(32.35 Points & 0.58%)
Sensex- closed at 18,542.31(78.04 Points & 0.42% )
CNX Midcap - closed at 7,470.85(125.15 Points & 1.71%)
BSE SMLcap- closed at 6,697.66(74.54 Points & 1.13%)
Nifty Spot-Levels & Trading Strategy for 18-09-2012
Nifty Spot-Levels
R3 5713
R2 5682
R1 5646
Avg 5615
S1 5579
S2 5548
S3 5512
Nifty Spot-Trading Strategy
H6 5677 Trgt 2
H5 5662 Trgt 1
H4 5646 Long breakout
H3 5628 Go Short
H2 5622
H1 5616
L1 5603
L2 5597
L3 5591 Long
L4 5573 Short Breakout
L5 5557 Trgt 1
L6 5542 Trgt 2
R3 5713
R2 5682
R1 5646
Avg 5615
S1 5579
S2 5548
S3 5512
Nifty Spot-Trading Strategy
H6 5677 Trgt 2
H5 5662 Trgt 1
H4 5646 Long breakout
H3 5628 Go Short
H2 5622
H1 5616
L1 5603
L2 5597
L3 5591 Long
L4 5573 Short Breakout
L5 5557 Trgt 1
L6 5542 Trgt 2
Nifty(Sep Fut)-Levels & Trading Strategy for 18-09-2012
Nifty(Sep Fut)-Levels
R3 5736
R2 5703
R1 5659
Avg 5626
S1 5582
S2 5549
S3 5505
Nifty(Sep Fut)-Trading Strategy
H6 5693 Trgt 2
H5 5675 Trgt 1
H4 5658 Long breakout
H3 5637 Go Short
H2 5630
H1 5623
L1 5608
L2 5601
L3 5594 Long
L4 5573 Short Breakout
L5 5556 Trgt 1
L6 5538 Trgt 2
R3 5736
R2 5703
R1 5659
Avg 5626
S1 5582
S2 5549
S3 5505
Nifty(Sep Fut)-Trading Strategy
H6 5693 Trgt 2
H5 5675 Trgt 1
H4 5658 Long breakout
H3 5637 Go Short
H2 5630
H1 5623
L1 5608
L2 5601
L3 5594 Long
L4 5573 Short Breakout
L5 5556 Trgt 1
L6 5538 Trgt 2
Bank Nifty(Sep Fut)-Levels & Trading Strategy for 18-09-2012
Bank Nifty(Sep Fut)-Levels
R3 11353
R2 11199
R1 11088
Avg 10934
S1 10823
S2 10669
S3 10558
Bank Nifty(Sep Fut)-Trading Strategy
H6 11246 Trgt 2
H5 11184 Trgt 1
H4 11122 Long breakout
H3 11049 Go Short
H2 11025
H1 11001
L1 10952
L2 10928
L3 10904 Long
L4 10831 Short Breakout
L5 10769 Trgt 1
L6 10707 Trgt 2
R3 11353
R2 11199
R1 11088
Avg 10934
S1 10823
S2 10669
S3 10558
Bank Nifty(Sep Fut)-Trading Strategy
H6 11246 Trgt 2
H5 11184 Trgt 1
H4 11122 Long breakout
H3 11049 Go Short
H2 11025
H1 11001
L1 10952
L2 10928
L3 10904 Long
L4 10831 Short Breakout
L5 10769 Trgt 1
L6 10707 Trgt 2
Pre-Closing Outlook(17-09-2012)
Whole day sideways intraday trading between 5586-5640 with higher levels selling patterns between 5620-5640. Follow up selling tomorrow and sustaining below 5586 will be very short term correction confirmation. As daily indicators are overbought also therefore mentioned correction possibility turning higher today.
Participation in Fed triggered Global Markets Rally
Technical Analysis,Research & Weekly Outlook
(Sep 17 to Sep 21,2012)
Nifty-Intra Day Chart (14-Sep-2012):- |
| Just click on chart for its enlarged view |
1- Consolidation between 5545-5570
2- Whole day trading between 5528-5585
Conclusions from intra day chart analysis
Most time intraday consolidations and on going rally continuation is expected.
Nifty-EOD Chart (14-Sep-2012):-
 |
| Just click on chart for its enlarged view |
1- 4531.15 on 20-12-2011
2- Wave-1(5629.95 on 22-02-2012)
3- Wave-2(4770.35 on 04-06-2012)
4- Sub Wave-1(5348.55 ON 10-07-2012)
5- Sub Wave-2(5032.40 on 26-07-2012)
6- Sub Wave-3(5448.40 on 23-08-2012)
7- Sub Wave-4(5215.70 on 05-09-2012)
8- Sub Wave-5 of Wave-3 is on
Conclusions (After Putting All Studies Together)
All trends are up and participation in Fed triggered Global markets rally through 80 points huge gap up opening on 14-09-2012. As previous session up moves with intraday consolidation patterns therefore rally continuation is expected in the coming week as well as new top of 2012 will also be seen.
FII & DII trading activity in Capital Market Segment on 14-Sep-2012
| ||||||||||||||||
| ||||||||||||||||
Indian Stock Markets Closing Reports(14-Sep-2012)
Main features of today trading are as follows
1- All the Indices closed in Green except FMCG.
2- Participation in Global Stock markets blasting rally with huge gap up opening.
3- White Candle formation.
Ratios
Nifty Put Call Ratio: 1.07
Nifty P/E Ratio(01-Aug-2012): 17.74
Advances & Declines
BSE Advances : 1480
BSE Declines : 1456
NSE Advances : 775
NSE Declines : 659
Nifty Open Interest Changed Today
Nifty- 5300 CE(Aug)- -953,800(-27.93%)
Nifty- 5300 PE(Aug)- -1,503,750(-15.02%)
Nifty- 5400 CE(Aug)- -2,405,900(-40.68%)
Nifty- 5400 PE(Aug)- 345,750(4.81%)
Nifty- 5500 CE(Aug)- 345,100 (6.80%)
Nifty- 5500 PE(Aug)- 3,036,500(131.92%)
Nifty- 5600 CE(Aug)- -1,513,500(-15.64%)
Nifty- 5600 PE(Aug)- 4,126,600(823.43%)
Closing
Nifty- closed at 5,577.65(142.30 Points & 2.62%)
Sensex- closed at 18,464.27(443.11 Points & 2.46% )
CNX Midcap - closed at 7,340.00(69.00 Points & 0.95%)
BSE SMLcap- closed at 6,623.12(29.58 Points & 0.45%)
Nifty Spot-Levels & Trading Strategy for 17-09-2012
Nifty Spot-Levels
R3 5660
R2 5623
R1 5600
Avg 5563
S1 5540
S2 5503
S3 5480
Nifty Spot-Trading Strategy
H6 5637 Trgt 2
H5 5623 Trgt 1
H4 5610 Long breakout
H3 5593 Go Short
H2 5588
H1 5582
L1 5571
L2 5566
L3 5560 Long
L4 5544 Short Breakout
L5 5530 Trgt 1
L6 5516 Trgt 2
R3 5660
R2 5623
R1 5600
Avg 5563
S1 5540
S2 5503
S3 5480
Nifty Spot-Trading Strategy
H6 5637 Trgt 2
H5 5623 Trgt 1
H4 5610 Long breakout
H3 5593 Go Short
H2 5588
H1 5582
L1 5571
L2 5566
L3 5560 Long
L4 5544 Short Breakout
L5 5530 Trgt 1
L6 5516 Trgt 2
Nifty(Sep Fut)-Levels & Trading Strategy for 17-09-2012
Nifty(Sep Fut)-Levels
R3 5677
R2 5637
R1 5610
Avg 5570
S1 5543
S2 5503
S3 5476
Nifty(Sep Fut)-Trading Strategy
H6 5651 Trgt 2
H5 5636 Trgt 1
H4 5620 Long breakout
H3 5602 Go Short
H2 5596
H1 5590
L1 5577
L2 5571
L3 5565 Long
L4 5547 Short Breakout
L5 5531 Trgt 1
L6 5516 Trgt 2
R3 5677
R2 5637
R1 5610
Avg 5570
S1 5543
S2 5503
S3 5476
Nifty(Sep Fut)-Trading Strategy
H6 5651 Trgt 2
H5 5636 Trgt 1
H4 5620 Long breakout
H3 5602 Go Short
H2 5596
H1 5590
L1 5577
L2 5571
L3 5565 Long
L4 5547 Short Breakout
L5 5531 Trgt 1
L6 5516 Trgt 2
Bank Nifty(Sep Fut)-Levels & Trading Strategy for 17-09-2012
Bank Nifty(Sep Fut)-Levels
R3 11633
R2 11316
R1 10983
Avg 10666
S1 10333
S2 10016
S3 9683
Bank Nifty(Sep Fut)-Trading Strategy
H6 11318 Trgt 2
H5 11163 Trgt 1
H4 11007 Long breakout
H3 10828 Go Short
H2 10769
H1 10709
L1 10590
L2 10530
L3 10471 Long
L4 10292 Short Breakout
L5 10136 Trgt 1
L6 9981 Trgt 2
R3 11633
R2 11316
R1 10983
Avg 10666
S1 10333
S2 10016
S3 9683
Bank Nifty(Sep Fut)-Trading Strategy
H6 11318 Trgt 2
H5 11163 Trgt 1
H4 11007 Long breakout
H3 10828 Go Short
H2 10769
H1 10709
L1 10590
L2 10530
L3 10471 Long
L4 10292 Short Breakout
L5 10136 Trgt 1
L6 9981 Trgt 2
Nifty Spot-Weekly Levels & Trading Strategy(Sep 17 to Sep 21,2012)
Nifty Spot-Weekly Levels
R3 5918
R2 5752
R1 5664
Avg 5498
S1 5410
S2 5244
S3 5156
Nifty Spot-Weekly Trading Strategy
H6 5842 Trgt 2
H5 5779 Trgt 1
H4 5716 Long breakout
H3 5646 Go Short
H2 5623
H1 5600
L1 5553
L2 5530
L3 5507 Long
L4 5437 Short Breakout
L5 5374 Trgt 1
L6 5311 Trgt 2
R3 5918
R2 5752
R1 5664
Avg 5498
S1 5410
S2 5244
S3 5156
Nifty Spot-Weekly Trading Strategy
H6 5842 Trgt 2
H5 5779 Trgt 1
H4 5716 Long breakout
H3 5646 Go Short
H2 5623
H1 5600
L1 5553
L2 5530
L3 5507 Long
L4 5437 Short Breakout
L5 5374 Trgt 1
L6 5311 Trgt 2
Subscribe to:
Posts (Atom)