Intraday selling seen above 5200 today

ॐ ह्रीं श्रीं लक्ष्मीभयो नमः॥

Pull Back Rally,Intraday Volatilty & Correction continuation
Nifty-Intra Day Chart (23-Apr-2012):-
Technical Patterns and Formations in today intraday charts
1- More than 2 hours selling between 5288-5310
2- Continuous down moves
3- More down moves after minor up moves.
4- Whole day trading between 5188-5310
All the Benchmark Indices closed more than 1.50% down on 23-04-2012 and proved our following following projections 100% accurate:-
1- We told in Pre-Closing Outlook on 20-04-2012:-
"more down moves are expected now."
2- We told in Correction continuation & Supports Testing in Next Week at 05:45:00 AM on 23-04-2012;-
"more down moves are expected in the coming sessions"
"more down moves as well as testing of above mentioned next supports are possible in the coming week"
(1st support at 5184 was given in above outlook and lowest was at 5187.15 on 23-04-2012)
3- We told in Mid-session Outlook on 23-04-2012:-
"more down moves can not be ruled out"
Correction is very much on from 22-02-2012 and its detailed analysis and next possibilities have already been updated yesterday with EOD chart. Yesterday mentioned 1st support(5184) has almost been tested yesterday. As 2nd Support(5136) testing possibility can not been ruled out also and 200-Day SMA is lying today at 5137 therefore importance of this level has already been updated in following topic today. Just click following topic link and understand understand most crucial levels;-
Next Trend decider & Most Crucial 200-Day SMA
Intraday indicatiors are oversold after yesterday sharp fall therefore Pull Back rally and intraday volatility is possible today. Market require complete consolidations and base formations before the beginning of any decisive up move and rally,let it happen then fresh up moves after correction completion will be considered.
Strong resistances above 5288 and next supports are between 5136 and 5184. Expected that next trend story will be written between 5136-5288 and volatile market with next moves preparation within this range will be seen in the coming sessions.
 |
| Just click on chart for its enlarged view |
1- More than 2 hours selling between 5288-5310
2- Continuous down moves
3- More down moves after minor up moves.
4- Whole day trading between 5188-5310
Conclusions from intra day chart analysis
All the Benchmark Indices closed more than 1.50% down on 23-04-2012 and proved our following following projections 100% accurate:-
1- We told in Pre-Closing Outlook on 20-04-2012:-
"more down moves are expected now."
2- We told in Correction continuation & Supports Testing in Next Week at 05:45:00 AM on 23-04-2012;-
"more down moves are expected in the coming sessions"
"more down moves as well as testing of above mentioned next supports are possible in the coming week"
(1st support at 5184 was given in above outlook and lowest was at 5187.15 on 23-04-2012)
3- We told in Mid-session Outlook on 23-04-2012:-
"more down moves can not be ruled out"
Correction is very much on from 22-02-2012 and its detailed analysis and next possibilities have already been updated yesterday with EOD chart. Yesterday mentioned 1st support(5184) has almost been tested yesterday. As 2nd Support(5136) testing possibility can not been ruled out also and 200-Day SMA is lying today at 5137 therefore importance of this level has already been updated in following topic today. Just click following topic link and understand understand most crucial levels;-
Next Trend decider & Most Crucial 200-Day SMA
Intraday indicatiors are oversold after yesterday sharp fall therefore Pull Back rally and intraday volatility is possible today. Market require complete consolidations and base formations before the beginning of any decisive up move and rally,let it happen then fresh up moves after correction completion will be considered.
Strong resistances above 5288 and next supports are between 5136 and 5184. Expected that next trend story will be written between 5136-5288 and volatile market with next moves preparation within this range will be seen in the coming sessions.
Next Trend decider & Most Crucial 200-Day SMA
Technical Analysis and Research For 24-04-2012
Nifty-EOD Chart (23-Apr-2012):-
 |
| Just click on chart for its enlarged view |
1- Corrective wave begun on 05-11-2010 from 6338.
2- Long term correction confirmation after 200-Day SMA broken down.
3- Three times resistance at 200-Day SMA in correction.
4- 5th impulsive wave begun on 20-12-2011 from 4532.
5- Long term correction completion confirmation after 200-Day SMA broken out.
6- 5th wave gained 1098.80 Nifty Points in 45 sessions.
7- Correction of 5th Wave beginning on 22-02-2012 from 5629.
8- Two times support at 200-Day SMA in on going correction.
Conclusions from EOD chart analysis
200-Day SMA proved Long term Trend decider and posed resistance in Bear market as well gave supports in Bull markets. Correction is on and yesterday mentioned 1st support(5184) has almost been tested yesterday as well as 2nd support(5136) testing possibility can not been ruled out also. As Long term trend decider 200-Day SMA is also lying today at 5137 therefore following levels have become most crucial;-
1- 5136
2- 5137
As 200-Day SMA is most crucial now therefore specially this topic has been posted to update its importance. Correction is very much on and its testing as well as slipping below it also can not be ruled out in the coming sessions but until Nifty will not sustain below 200-Day SMA till then Bullish market possibility will remain alive after correction completion.
Expected that finally Indian markets will remain Bullish without sustaining below 200-Day SMA.

FII & DII trading activity in Capital Market Segment on 23-Apr-2012
| ||||||||||||||||
| ||||||||||||||||
Indian Stock Markets Closing Reports(23-Apr-2012)
Main features of today trading are as follows
1- All the Indices closed in Red.
2- Black Candle.
3- Closing at the lowest of the day.
Ratios
Nifty Put Call Ratio: 1.11
Nifty P/E Ratio(23-Apr-2012): 18.26
Advances & Declines
BSE Advances : 964
BSE Declines : 1841
NSE Advances : 330
NSE Declines : 1116
Nifty Open Interest Changed Today
Nifty- 5000 CE(Apr)- -55900(-11.55%)
Nifty- 5000 PE(Apr)- +692950(+11.63%)
Nifty- 5100 CE(Apr)- +266400(+85.26%)
Nifty- 5100 PE(Apr)- +238700(+3.65%)
Nifty- 5200 CE(Apr)- +1619300(+70.08%)
Nifty- 5200 PE(Apr)- -490900(-7.05%)
Nifty- 5300 CE(Apr)- +1571300(+37.66%)
Nifty- 5300 PE(Apr)- -1003450(-23.49%)
Closing
Nifty- closed at 5,200.60(-90.25 Points & -1.71%)
Sensex- closed at 17,096.68(-277.16 Points & -1.60% )
CNX Midcap - closed at 7,509.10(-117.30 Points & -1.54%)
BSE Smallcap- closed at 6,794.56(-106.02 Points & -1.54%)
Nifty Spot-Levels & Trading Strategy for 24-04-2012
Nifty Spot-Levels
R3 5400
R2 5355
R1 5277
Avg 5232
S1 5154
S2 5109
S3 5031
Nifty Spot-Trading Strategy
H6 5323 Trgt 2
H5 5295 Trgt 1
H4 5267 Long breakout
H3 5233 Go Short
H2 5222
H1 5211
L1 5188
L2 5177
L3 5166 Long
L4 5132 Short Breakout
L5 5104 Trgt 1
L6 5076 Trgt 2
R3 5400
R2 5355
R1 5277
Avg 5232
S1 5154
S2 5109
S3 5031
Nifty Spot-Trading Strategy
H6 5323 Trgt 2
H5 5295 Trgt 1
H4 5267 Long breakout
H3 5233 Go Short
H2 5222
H1 5211
L1 5188
L2 5177
L3 5166 Long
L4 5132 Short Breakout
L5 5104 Trgt 1
L6 5076 Trgt 2
Nifty(Apr Fut)-Levels & Trading Strategy for 24-04-2012
Nifty(Apr Fut)-Levels
R3 5412
R2 5363
R1 5280
Avg 5231
S1 5148
S2 5099
S3 5016
Nifty(Apr Fut)-Trading Strategy
H6 5330 Trgt 2
H5 5300 Trgt 1
H4 5270 Long breakout
H3 5234 Go Short
H2 5222
H1 5210
L1 5185
L2 5173
L3 5161 Long
L4 5125 Short Breakout
L5 5095 Trgt 1
L6 5065 Trgt 2
R3 5412
R2 5363
R1 5280
Avg 5231
S1 5148
S2 5099
S3 5016
Nifty(Apr Fut)-Trading Strategy
H6 5330 Trgt 2
H5 5300 Trgt 1
H4 5270 Long breakout
H3 5234 Go Short
H2 5222
H1 5210
L1 5185
L2 5173
L3 5161 Long
L4 5125 Short Breakout
L5 5095 Trgt 1
L6 5065 Trgt 2
Bank Nifty(Apr Fut)-Levels & Trading Strategy for 24-04-2012
Bank Nifty(Apr Fut)-Levels
R3 10764
R2 10648
R1 10442
Avg 10326
S1 10120
S2 10004
S3 9798
Bank Nifty(Apr Fut)-Trading Strategy
H6 10559 Trgt 2
H5 10486 Trgt 1
H4 10414 Long breakout
H3 10325 Go Short
H2 10296
H1 10266
L1 10207
L2 10177
L3 10148 Long
L4 10059 Short Breakout
L5 9987 Trgt 1
L6 9914 Trgt 2
R3 10764
R2 10648
R1 10442
Avg 10326
S1 10120
S2 10004
S3 9798
Bank Nifty(Apr Fut)-Trading Strategy
H6 10559 Trgt 2
H5 10486 Trgt 1
H4 10414 Long breakout
H3 10325 Go Short
H2 10296
H1 10266
L1 10207
L2 10177
L3 10148 Long
L4 10059 Short Breakout
L5 9987 Trgt 1
L6 9914 Trgt 2
Live Proofs of our Accuracy
Following lines were told in Correction continuation & Supports Testing in Next Week at 05:45:00 AM today;-
Following 2 supports were also mentioned:-
4- 1st Support at 5184
5- 2nd Support at 5136
more down moves as well as testing of above mentioned next supports are possible in the coming week.
Following 2 supports were also mentioned:-
4- 1st Support at 5184
5- 2nd Support at 5136
Above mentioned 1st support of 5184 has been almost tested today because today lowest is at 5187.15.
Pre-Closing Outlook(23-04-2012)
Our both previous outlooks are live proofs of this fact that We only told for down moves and correction continuations for today as well as cautioned also for minor up moves possibility only because people starts to buy at lower and cheaper rates.
Correction is on and following 2 supports with its testing possibility have already been updated in Correction continuation & Supports Testing in Next Week at 05:45:00 AM today;-
4- 1st Support at 5184
5- 2nd Support at 5136
Mid-session Outlook(23-04-2012)
Following lines were told in Correction continuation & Supports Testing in Next Week at 05:45:00 AM today;-
1- more down moves are expected in the coming sessions.
2- more down moves as well as testing of above mentioned next supports are possible in the coming week.
Nifty is more than 50 points down today and our above projection proved 100% accurate. Firstly selling at higher levels and then down moves seen today and more down moves can not be ruled out but intraday charts are oversold therefore minor up moves may be seen today after getting some intraday support.
Correction continuation & Supports Testing in Next Week
Technical Analysis,Research & Weekly Outlook
(Apr 23 to Apr 27,2012)
Nifty-EOD Chart (20-Apr-2012):-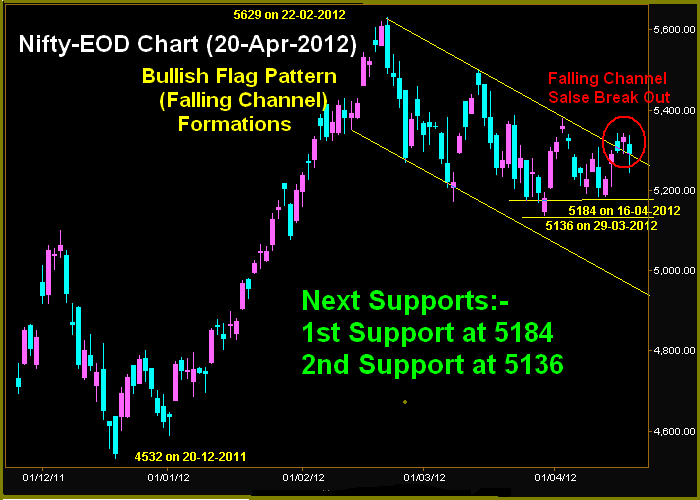 |
| Just click on chart for its enlarged view |
1- Bullish Flag Pattern(Falling Channel) in on going Correction
2- Bullish Flag Pattern(Falling Channel) Formations
3- Falling Channel false Break Out
4- 1st Support at 5184
5- 2nd Support at 5136
Conclusions from EOD chart analysis
Falling Channel false Break Out was technically most crucial formation of previous week and firstly its impact will be seen in next week through more down moves
Nifty-Intra Day Chart (Apr 18 to Apr 20,2012):-
 |
| Just click on chart for its enlarged view |
1- Genuine selling between 5330-5341 on 18-04-2012.
2- Mixed Patterns(selling also) between 5325-5338 on 19-04-2012
3- Almost 5 hours genuine selling between 5318-5336 on 20-04-2012
Nifty-Intra Day Chart (20-Apr-2012):-
 |
| Just click on chart for its enlarged view |
1- Almost 5 hours genuine selling between 5318-5336
2- Sharp 70 points crash in 7 minutes.
3- Whole day trading between 5246-5336.
Conclusions from intra day charts analysis
Although 70 Points crash after 02:20 PM but we clearly projected selling at 10:47:00 AM in Post-open Outlook(20-04-2012). Almost 5 hours genuine selling between 5318-5336 therefore market require complete consolidations for any move above 5336.
Sharp 70 points crash in 7 minutes on 20-04-2012 after 3 sessions selling and specially almost 5 hours genuine selling on 20-04-2012 therefore market requires complete consolidations for any move above 5336. Until complete consolidations will not happen minimum on intraday charts till then any rally above 5336 will not be considered.
As almost 5 hours huge selling is proved through genuine intraday selling patterns on 20-04-2012 therefore more down moves are expected in the coming sessions.
Conclusions (After Putting All Studies Together)
Corretion is on in Falling Channel and market crashed after forming 3rd lower top in last week therefore technical possibility of fresh bottom below 5136 should be kept in mind. In this regard following topic with EOD Chary was posted on 15-04-2012
Lower Tops and Lower Bottoms Formation In On Going Correction
(Just click above topic link and go through)
As third time resistance at falling trend line as well as 3 days intraday selling patterns near about it therefore sharp fall seen last Friday and more down moves as well as testing of above mentioned next supports are possible in the coming week.
correction completion confirmations will be after sustaining above 5341 and Nifty will firstly trade between 5175-5318 in the beginning of next week. Firstly sideways market within 5136-5341 and sustaining it beyond will give next trend confirmations.

FII & DII trading activity in Capital Market Segment on 20-Apr-2012
| ||||||||||||||||
| ||||||||||||||||
Indian Stock Markets Closing Reports(20-Apr-2012)
Main features of today trading are as follows
1- Black Candle.
2- Red closing.
3- Sharp down after almost 5 hours genuine selling.
Ratios
Nifty Put Call Ratio:1.10
Nifty P/E Ratio(20-Apr-2012): 18.58
Advances & Declines
BSE Advances : 1153
BSE Declines : 1655
NSE Advances : 505
NSE Declines : 952
Nifty Open Interest Changed Today
Nifty- 5100 CE(Apr)- -66300(-17.50%)
Nifty- 5100 PE(Apr)- +550450(+9.18%)
Nifty- 5200 CE(Apr)- -138650(-5.66%)
Nifty- 5200 PE(Apr)- -879450(-11.22%)
Nifty- 5300 CE(Apr)- -422500(-9.20%)
Nifty- 5300 PE(Apr)- -1160800(-21.37%)
Nifty- 5400 CE(Apr)- -376300(-5.38%)
Nifty- 5400 PE(Apr)- -592900(-20.35%)
Closing
Nifty- closed at 5,290.85(-41.55 Points & -0.78%)
Sensex- closed at 17,373.84(-129.87 Points & -0.74% )
CNX Midcap - closed at 7,626.40(-71.25 Points & -0.93%)
BSE Smallcap- closed at 6,900.58(-32.25 Points & -0.47%)
Nifty Spot-Levels & Trading Strategy for 23-04-2012
Nifty Spot-Levels
R3 5427
R2 5381
R1 533
Avg 5290
S1 5245
S2 5199
S3 5154
Nifty Spot-Trading Strategy
H6 5382 Trgt 2
H5 5361 Trgt 1
H4 5341 Long breakout
H3 5316 Go Short
H2 5307
H1 5299
L1 5282
L2 5274
L3 5265 Long
L4 5240 Short Breakout
L5 5220 Trgt 1
L6 5199 Trgt 2
R3 5427
R2 5381
R1 533
Avg 5290
S1 5245
S2 5199
S3 5154
Nifty Spot-Trading Strategy
H6 5382 Trgt 2
H5 5361 Trgt 1
H4 5341 Long breakout
H3 5316 Go Short
H2 5307
H1 5299
L1 5282
L2 5274
L3 5265 Long
L4 5240 Short Breakout
L5 5220 Trgt 1
L6 5199 Trgt 2
Nifty(Apr Fut)-Levels & Trading Strategy for 23-04-2012
Nifty(Apr Fut)-Levels
R3 5463
R2 5408
R1 5355
Avg 5300
S1 5247
S2 5192
S3 5139
Nifty(Apr Fut)-Trading Strategy
H6 5411 Trgt 2
H5 5386 Trgt 1
H4 5361 Long breakout
H3 5331 Go Short
H2 5321
H1 5311
L1 5292
L2 5282
L3 5272 Long
L4 5242 Short Breakout
L5 5217 Trgt 1
L6 5192 Trgt 2
R3 5463
R2 5408
R1 5355
Avg 5300
S1 5247
S2 5192
S3 5139
Nifty(Apr Fut)-Trading Strategy
H6 5411 Trgt 2
H5 5386 Trgt 1
H4 5361 Long breakout
H3 5331 Go Short
H2 5321
H1 5311
L1 5292
L2 5282
L3 5272 Long
L4 5242 Short Breakout
L5 5217 Trgt 1
L6 5192 Trgt 2
Bank Nifty(Apr Fut)-Levels & Trading Strategy for 23-04-2012
Bank Nifty(Apr Fut)-Levels
R3 10814
R2 10712
R1 10589
Avg 10487
S1 10364
S2 10262
S3 10139
Bank Nifty(Apr Fut)-Trading Strategy
H6 10692 Trgt 2
H5 10641 Trgt 1
H4 10589 Long breakout
H3 10527 Go Short
H2 10507
H1 10486
L1 10445
L2 10424
L3 10404 Long
L4 10342 Short Breakout
L5 10290 Trgt 1
L6 10239 Trgt 2
R3 10814
R2 10712
R1 10589
Avg 10487
S1 10364
S2 10262
S3 10139
Bank Nifty(Apr Fut)-Trading Strategy
H6 10692 Trgt 2
H5 10641 Trgt 1
H4 10589 Long breakout
H3 10527 Go Short
H2 10507
H1 10486
L1 10445
L2 10424
L3 10404 Long
L4 10342 Short Breakout
L5 10290 Trgt 1
L6 10239 Trgt 2
Nifty Spot-Weekly Levels & Trading Strategy(Apr 23 to Apr 27,2012)
Nifty Spot-Weekly Levels
R3 5518
R2 5430
R1 5360
Avg 5272
S1 5202
S2 5114
S3 5044
Nifty Spot-Weekly Trading Strategy
H6 5452 Trgt 2
H5 5415 Trgt 1
H4 5377 Long breakout
H3 5334 Go Short
H2 5319
H1 5305
L1 5276
L2 5262
L3 5247 Long
L4 5204 Short Breakout
L5 5166 Trgt 1
L6 5129 Trgt 2
R3 5518
R2 5430
R1 5360
Avg 5272
S1 5202
S2 5114
S3 5044
Nifty Spot-Weekly Trading Strategy
H6 5452 Trgt 2
H5 5415 Trgt 1
H4 5377 Long breakout
H3 5334 Go Short
H2 5319
H1 5305
L1 5276
L2 5262
L3 5247 Long
L4 5204 Short Breakout
L5 5166 Trgt 1
L6 5129 Trgt 2
Bank Nifty Spot-Weekly Levels & Trading Strategy(Apr 23 to Apr 27,2012)
Bank Nifty Spot-Weekly Levels
R3 11049
R2 10847
R1 10652
Avg 10450
S1 10255
S2 10053
S3 9858
Bank Nifty Spot-Weekly Trading Strategy
H6 10862 Trgt 2
H5 10768 Trgt 1
H4 10675 Long breakout
H3 10566 Go Short
H2 10529
H1 10493
L1 10420
L2 10384
L3 10347 Long
L4 10238 Short Breakout
L5 10145 Trgt 1
L6 10051 Trgt 2
R3 11049
R2 10847
R1 10652
Avg 10450
S1 10255
S2 10053
S3 9858
Bank Nifty Spot-Weekly Trading Strategy
H6 10862 Trgt 2
H5 10768 Trgt 1
H4 10675 Long breakout
H3 10566 Go Short
H2 10529
H1 10493
L1 10420
L2 10384
L3 10347 Long
L4 10238 Short Breakout
L5 10145 Trgt 1
L6 10051 Trgt 2
Subscribe to:
Posts (Atom)