ॐ ह्रीं श्रीं लक्ष्मीभयो नमः॥


Trading "calls" from our "Software" with more than "90% accuracy"

More than "12 years" old "only site of whole world" 
with more than "9700 accurate Outlooks" of 
"Indian Stock Markets" 

Rally Continuation in next week after Consolidations


Technical Analysis,Research & Weekly Outlook 
(Jan 16 to Jan 20, 2012)

Nifty-Intra Day Chart(13-Jan-2011):-
Just click on chart for its enlarged view
Technical Patterns and Formations in today intraday charts

1- Support between 4835-4860
2- Mixed Patterns between 4875-4897
3- Whole day trading between 4835-4898

Conclusions from intra day chart analysis 

Good support at lower levels but mixed intraday patterns at higher levels therefore more consolidation is required for crossing and sustaining above 4900.

Nifty-EOD Chart(13-Jan-2011):-
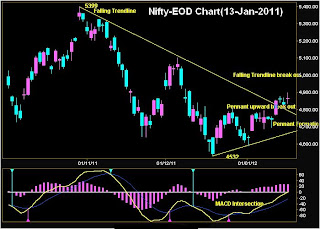
Just click on chart for its enlarged view

Technical Patterns and Formations in EOD charts

1- Pennant Formation
2- Pennant upward break out on 10-01 2011
3- Falling Trendline
4- Falling Trendline break out on 10-01 2011
5- Positive MACD
6- Doji Candle in 3 previous sessions.
7- MACD up ward intersected average line

Conclusions (After Putting All Studies Together)

Long term and Intermediate term trends are down and short term trend is up at the bottom of 14 months long Corrective Wave 'C'. 4 Sub waves of corrective Wave 'C' has been completed and 5th Sub wave was extended in 5 Waves as well as its completion signal after beginning of rally on 20-12-2011 from 4531.15.

Rally is on after lower levels consolidations and showed strengh after Pennant and Falling Trendline break out on 10-01 2011 but correction also seen after selling on 11-01 2011.  Technicals of 3 previous sessions are as follows:-

1- 3 Doji Candle formation 
2- Both higher levels selling and lower levels buying in 3 previous sessions.
3- 3 days sideways trading between 4804-4898.

As both higher levels selling and lower levels buying in 3 previous session therefore markets are not prepared for anyside decisive moves and will firstly trade and prepare for next moves between last 3 days trading range(4804-4898) in the beginning of next week

As multiple resistances at higher levels therefore consolidation is required before any up move and it is going on for the last 3 sessions. Expected that on going Rally will remain continued after follow up consolidation in next week.

Rally Continuation after Trend Reversal Patterns

Nifty-EOD Chart(13-Jan-2011):-
Just click on chart for its enlarged view
Technical Patterns and Formations in EOD charts

1- 5 Waves OF Wave A correction completed in 2008
2- 'ABC' up moves of Wave B
3- 5th Wave of Wave c is extended
4- 5th Wave of Wave c completion signals at 4531.15 on 20-12-2011

Conclusions from EOD chart analysis 

As per Elliot Wave Theory:-


"The bottom of wave 4 should not dip below the top of wave 1 of the same degree,at least on a closing price level"


Top of wave 1 was at 4693 and Nifty closed below it 5 days therefore wave 1 validity is doubtful therefore recalculation of waves on long charts is required. It has been concluded that correction of 11 years rally begun in Jan 2008 and Corrective Wave 'C' is on at present.

Short term up moves commenced within it from 21-12-2011 but Wave 'C' termination confirmation is required yet. Indian markets remained sideways for 10 years(1992-2001) and after that more than 6 years rally was seen therefore market will take its own time in consolidation and after that fresh strong rally will be seen to form new highs.

Latest bottom is at 4531.15 and if Nifty sustains above it then Fresh rally wil be considered after crossing of crucial resistances and up trend deciding levels.


Nifty-EOD Chart(13-Jan-2011):-
Just click on chart for its enlarged view
As following developments therefore hopes of fresh rally are alive from 4531.15:-

1- 13 is a Fibonacci number and on going up move started in Dec 2011 which is 13th month of Wave 'C' correction.
2- Trend Reversal Broadening Pattern at the bottom of 13 months correction is still intact
3- 109 Sessions sideways market between 4720-5229 and its break out will mean beginning of strong moves..


15 Years Waves Structure in Long Charts

Nifty-Monthly Chart(13-Jan-2011):-
Just click on chart for its enlarged view
Technical Patterns and Formations in Monthly charts

1- Upward Trend in long chart is intact
2- Wave C is on termination confirmation is required yet

Waves Structure of 15 years as follows:-

775.45 on 31-12-1996            
Wave 1- 1818.15 on 29-02-2000  
Wave 2-  849.95 on 28-09-2001  
Wave 3- 3774.15 on 31-05-2006  
Wave 4- 2595.65 on 30-06-2006
Wave 5- 6357.10 on 31-01-2008        
Wave A- 2252.75 on 31-10-2008      
Wave B- 6338.50 on 30-11-2010  
Wave C- 4531.15 on 30-12-2011(termination confirmation is required yet)  

Conclusions from Monthly chart analysis 

Indian markets are Bullish in Long Charts and correcting since Jan 2008 after 11 years rally. Corrective Wave 'C' is on and short term up moves begun within it from Dec 2011 but Wave 'C' termination confirmation is required yet.

As market is well above rising trendline therefore up trend in Indian markets is vert much intact and expected that strong rally will be seen after the completion of Wave 'C'.

Fibonacci Retracement Levels of Wave 'B' are as follows(6338-2252):-

13.0%- 5806
23.6%- 5373
27.0%- 5234
38.2%- 4777
50.0%- 4295
61.8%- 3812
70.7%- 3449
76.4%- 3216
78.6%- 3126
88.6%- 2717

FII Trading Data in Derivatives Segment on 13-Jan-2012


FII & DII trading activity in Capital Market Segment on 13-Jan-2012

FII trading activity on NSE and BSE in Capital Julket Segment(In Rs. Crores)
CategoryDateBuy ValueSell ValueNet Value
FII13-Jan-20122508.072214.56293.51


DII trading activity on NSE and BSE in Capital Julket Segment(In Rs. Crores)
CategoryDateBuy ValueSell ValueNet Value
DII13-Jan-20121198.431375.69-177.26

Indian Stock Markets Closing Reports(01-Jan-2012)

Main features of today trading are as follows

1- Most Indices closed in Green.
2- Volatile market.
3- Intraday consolidation at lower levels.
4- Doji Candle formation

Ratios

Nifty Put Call Ratio: 1.06
Nifty P/E Ratio(01-Jan-2012): 17.50

Advances & Declines

BSE Advances : 1892
BSE Declines : 922
NSE Advances : 1027
NSE Declines : 449

Nifty Open Interest Changed Today

Nifty- 4700 CE(Jan)- -20650(-0.88%)
Nifty- 4700 PE(Jan)- +793500(+11.76%)

Nifty- 4800 CE(Jan)- +1400(+0.04%)
Nifty- 4800 PE(Jan)- +1287650(+27.66%)

Nifty- 4900 CE(Jan)- -37400(-0.65%)
Nifty- 4900 PE(Jan)- +572600(+25.82%)

Closing

Nifty- closed at 4,866.00(+34.75 Points & +0.72%)
Sensex- closed at 16,154.62(+117.11 Points & +0.73% )
CNX Midcap - closed at 6,653.55(+62.45 Points & +0.95%)
BSE Smallcap- closed at 6,171.75(+87.48 Points & +1.44%)

Nifty Spot-Levels & Trading Strategy for 16-01-2012

Nifty Spot-Levels

R3 4962
R2 4930
R1 4898
Avg 4866
S1 4834
S2 4802
S3 4770

Nifty Spot-Trading Strategy

H6 4930     Trgt 2
H5 4915     Trgt 1
H4 4901     Long breakout
H3 4883     Go Short
H2 4877
H1 4871
L1 4860
L2 4854
L3 4848     Long
L4 4830     Short Breakout
L5 4816     Trgt 1
L6 4801     Trgt 2

Nifty(Jan Fut)-Levels & Trading Strategy for 16-01-2012

Nifty(Jan Fut)-Levels

R3 4988
R2 4952
R1 4915
Avg 4879
S1 4842
S2 4806
S3 4769

Nifty(Jan Fut)-Trading Strategy

H6 4951     Trgt 2
H5 4934     Trgt 1
H4 4918     Long breakout
H3 4898     Go Short
H2 4891
H1 4884
L1 4871
L2 4864
L3 4857     Long
L4 4837     Short Breakout
L5 4821     Trgt 1
L6 4804     Trgt 2

Bank Nifty(Jan Fut)-Levels & Trading Strategy for 16-01-2012

Bank Nifty(Jan Fut)-Levels

R3 9237
R2 9155
R1 9056
Avg 8974
S1 8875
S2 8793
S3 8694

Bank Nifty(Jan Fut)-Trading Strategy

H6 9140     Trgt 2
H5 9098     Trgt 1
H4 9057     Long breakout
H3 9007     Go Short
H2 8991
H1 8974
L1 8941
L2 8924
L3 8908     Long
L4 8858     Short Breakout
L5 8817     Trgt 1
L6 8775     Trgt 2

Nifty Spot-Weekly Levels & Trading Strategy(Jan 16 to Jan 20,2012)

Nifty Spot-Weekly Levels

R3 5147
R2 5022
R1 4944
Avg 4819
S1 4741
S2 4616
S3 4538

Nifty Spot-Weekly Trading Strategy 

H6 5076     Trgt 2
H5 5027     Trgt 1
H4 4977     Long breakout
H3 4921     Go Short
H2 4903
H1 4884
L1 4847
L2 4828
L3 4810     Long
L4 4754     Short Breakout
L5 4704     Trgt 1
L6 4655     Trgt 2

Bank Nifty Spot-Weekly Levels & Trading Strategy(Jan 16 to Jan 20,2012)

Bank Nifty Spot-Weekly Levels

R3 9998
R2 9535
R1 9255
Avg 8792
S1 8512
S2 8049
S3 7769

Bank Nifty Spot-Weekly Trading Strategy 

H6 9775     Trgt 2
H5 9579     Trgt 1
H4 9383     Long breakout
H3 9179     Go Short
H2 9111
H1 9043
L1 8906
L2 8838
L3 8770     Long
L4 8566     Short Breakout
L5 8370     Trgt 1
L6 8174     Trgt 2

Pre-Closing Outlook(13-01-2012)

Up moves above 4876 was expected and it was seen also but Nifty moves down and trading below 4876 also. Some news about Ambani brothers in Business News Channels therefore today intraday moves moves and volatility may be result of this news also.

As today intraday support between 4835-4853 today and yesterday support between Buying between 4805-4830 therefore until Nifty will not sustain below 4805 till then any decisive down move will not be considered.

Although Nifty is trading near the the lows of today but expected that consolidation will remain continued and finally Nifty will sustain above 4876 and rally will remain continued in next week.

Live Proof of our Accurate predictions

We told following line at 01:04:00 AM today:-

"Nifty will finally sustain above 4876 in the coming sessions"

Nifty is trading at 4897 at this moment

Mid-session Outlook-2 (13-01-2012)

We told following line at 12:00:00 PM today:-

"Possibility of trading above 4876 turned high now"

When Nifty was at 4854 then above projection was posted and at present Nifty is trading above 4876 with intraday high at 4886.20

Today up moves after intraday consolidations therefore will remain continued.

Mid-session Outlook(13-01-2012)

As support again developed at lower levels today after yesterday lower levels supports and it is intra day consolidation confirmation also therefore upward break out possibility of last 3 sessions range(4876) has increased.  Possibility of trading above 4876 turned high now.

Post-open Outlook(13-01-2012)

Following lines were told for today market at 1:04:00 AM today:-

As selling and buying both are seen in two previous sessions between 4804-4876 therefore Nifty will firstly trade and prepare for next decisive moves as well as sustaining beyond this range will be next moves confirmations.

As was told same is being seen between 4834.20-4868.35 today.

Intraday selling seen at higher levels today but supports also seen between mentioned range yesterday. Let market prepare within mentioned range then next moves final conclusions will be drawn from intraday charts formations and will be updated accordingly.

Next decisive move confirmation will be sustaining beyond 4804-4876 and should be watched.

Rally in Next Week after Some More Consolidations


Technical Analysis and Research For 13-01-2012

Nifty-EOD Chart(12-Jan-2011):-
Just click on chart for its enlarged view
Technical Patterns and Formations in EOD charts

1- Pennant Formation
2- Pennant upward break out on 10-01 2011
3- Falling Trendline
4- Falling Trendline break out on 10-01 2011
5- Positive MACD
6- Doji Candle in 2 previous sessions.
7- MACD up ward intersected average line

Conclusions from EOD chart analysis 

Rally is on after lower levels consolidations and showed strengh after Pennant and Falling Trendline break out on 10-01 2011 but today down moves after intraday selling on 11-01 2011. As soon as selling developed then we immediately updated down movws projections during and after trading hours on 11-01 2011 in following manner:-

1- We clearly told during and after trading hours  on 11-01 2011 that down moves will be considered after INFY quarterly results on 12-01 2011.

2- We also clearly told that until Nifty will not sustain above 4876 till then upmoves will not be considered and highest on 12-01 2011 was at 4869.20

135 Points upmoves in two sessions and its correction yesterday. Technicals of 2 previous sessions are as follows:-

1- Two Doji Candle formation
2- Both higher levels selling and lower levels buying.

Nifty-Intra Day Chart(12-Jan-2011):-
Just click on chart for its enlarged view
Technical Patterns and Formations in today intraday charts

1- Selling between 4843-4868
2- Buying between 4805-4830
3- Intraday pattern is showing consolidation formation.
4- Whole day trading between 4804-4869

Nifty-Intra Day Chart(Jan 11 & Jan 12,2012):-
Just click on chart for its enlarged view
Technical Patterns and Formations in last 2 sessions intraday charts

1- Selling between 4857-4876
2- Buying between 4805-4830
3- Two days trading between 4804-4876

Conclusions (After Putting All Studies Together)

Although slow but rally is on and short term trend is up as well as its very short term correction has begun after good selling at higher levels on 11-01-2012 and confirmation of support also between 4812-4728 on 12-01-2012

On going rally has not shown so much strength that we should immediately consider strong rally and on the other hand only one day selling is not suffiient to say for termination of rally.

As selling and buying both are seen in two previous sessions between 4804-4876 therefore Nifty will firstly trade and prepare for next decisive moves as well as sustaining beyond this range will be next moves confirmations.

Although good selling on 10-01-2012 but expected that follow up consolidation will develop in the coming sessions and Nifty will finally sustain above 4876 in the coming sessions and rally begun on 21-12-20110 will remain continued in next week.

Indian Stock Markets Closing Reports(12-Jan-2012)

Main features of today trading are as follows

1- All the Indices closed with minor gains or loss except IT Index which closed with big loss.
2- Doji Candle formation.
3- INFY results.IIP numbers and Inflation data news led volatile market.

Ratios

Nifty Put Call Ratio: 0.97
Nifty P/E Ratio(12-Jan-2012): 17.50

Advances & Declines

BSE Advances : 1433
BSE Declines : 1317
NSE Advances : 719
NSE Declines : 724

Nifty Open Interest Changed Today

Nifty- 4700 CE(Jan)- -68800(-2.79%)
Nifty- 4700 PE(Jan)- +439800(+6.54%)

Nifty- 4800 CE(Jan)- +377850(+10.45%)
Nifty- 4800 PE(Jan)- -160100(-3.25%)

Nifty- 4900 CE(Jan)- +380150(+6.64%)
Nifty- 4900 PE(Jan)- -53800(-2.37%)

Closing 

Nifty- closed at 4,831.25(-29.70 Points & -0.61%)
Sensex- closed at 16,037.51-138.35 Points & -0.86%)
CNX Midcap - closed at 6,591.10(+43.95 Points & +0.67%)
BSE Smallcap- closed at 6,075.43(+78.95 Points & +1.32%)

FII Trading Data in Derivatives Segment on 12-Jan-2012


FII & DII trading activity in Capital Market Segment on 12-Jan-2012

FII trading activity on NSE and BSE in Capital Julket Segment(In Rs. Crores)
CategoryDateBuy ValueSell ValueNet Value
FII12-Jan-20122538.652031.85506.8

DII trading activity on NSE and BSE in Capital Julket Segment(In Rs. Crores)
CategoryDateBuy ValueSell ValueNet Value
DII12-Jan-2012944.071940.98-996.91

Down Moves predictions After INFY Results only in this Blog

When whole India was confused and speculating on Indian market moves after Infosys results then only we told again and again for down moves in Indian market after INFY results.

We told for today down moves between and after trading hours yesterday. When no one can even imagine for today down moves then we told      again and again.

For Live Proofs of above facts just click following link and verify all the proofs on yours own:-

http://enjoydailyprofits.blogspot.com/2012/01/live-proofs-of-down-moves-predictions.html