ॐ ह्रीं श्रीं लक्ष्मीभयो नमः॥


Trading "calls" from our "Software" with more than "90% accuracy"

More than "12 years" old "only site of whole world" 
with more than "9700 accurate Outlooks" of 
"Indian Stock Markets" 

Bulls Will Welcome In Next Week


Technical Analysis,Research & Weekly Outlook 
(Jan 07 to Jan 13,2012)

Following technical points are very well established:-

All trends are down after 14 months falling trendline correction and following 2 formations after huge gap down opening on 05-08-2011 at the bottom of correction:-

1- 103 sessions sideways moment between 4720-5229 and intact at present.
2- As 103 sessions range once broken out and several times broken down therefore trend reversal Broadening Pattern formation at the bottom of 14 months correction and it is also still intact.
3- As Nifty slipped below 4693 therefore 36 months waves structure was also at stake in previous weeks but it is also safe at present and impulsive Wave 5 possibility is still alive after completion of Wave 4.

Sustaining beyond 103 sessions trading range(4720-5229) will mean huge moves towards breaking out direction. As Nifty closed within range therefore Indian markets are poised for any side break out. Now we shall try to explore the break out direction of mentioned range and understand immediate next moves through analysis of following charts;-.

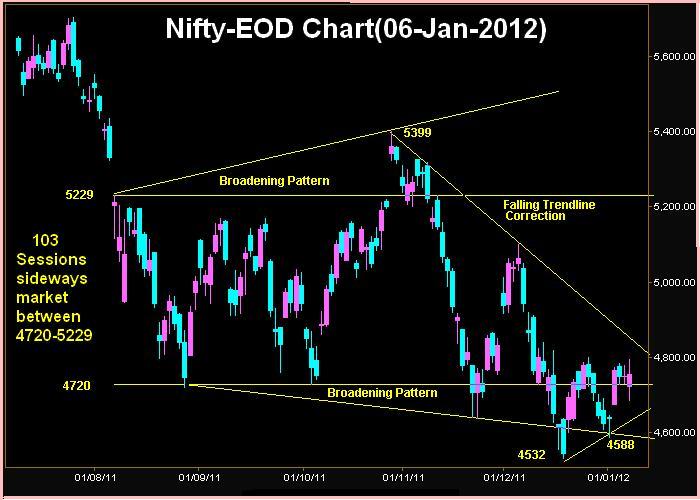
Nifty-EOD Chart(06-Jan-2012):-
Just click on chart for its enlarged view
Technical Patterns and Formations in EOD charts

1- Trend Reversal Broadening Pattern at the bottom of 14 months correction is intact.
2- 103 Sessions sideways market between 4720-5229 is intact.
3- Falling Trendline Correction from the top of Broadening Pattern(5399)
4- Very short term up move from 4532 which got support at 4588 as well as higher bottom confirmation.

Conclusions from EOD chart analysis 

Both above patterns(1st & 2nd) broken down during the last half of previous month but again all are intact after the beginning of 2012. Very short term upmove begun from 4532 and it got higher bottom support on the first day of 2012 at 4588 therefore impulsive Wave 5 commencement possibility is also still alive after completion of Wave 4.

Last 3 sessions firstly sideways and then volatile market between 4688-4788 therefore too much has been riped between this 100 points trading range and its break out will give big moves to Indian markets therefore technical positions within this range will be understood because only that will give first indication of next trend:-

Nifty-Micro Analysis of Intra Day Chart(06-Jan-2011):-
Just click on chart for its enlarged view
Technical Patterns and Formations in today intraday charts

1- Support between 4688-4720
2- Sharp 75 points surge in 15 minutes
3- Consolidation patterns between 4738-4758 in last 40 minutes
4- Whole day trading between 4687-4795

Conclusions from intra day chart analysis(06-Jan-2011) 

Confirm support at lower levels and also consolidation patterns in last 40 minutes therefore today begun upmoves from intraday lower levels will remain continued in the coming sessions.

Nifty-Micro Analysis of Intra Day Chart(05-Jan-2011):-
Just click on chart for its enlarged view
Technical Patterns and Formations in today intraday charts

1- Selling between 4765-4778.
2- Rising channel broken down.
3- Support between 4731-4742
4- Whole day trading between 4731-4779

Conclusions from intra day chart analysis(05-Jan-2011) 

Good selling between 4765-4778 therefore fresh consolidation is required for any upmoves as well as sustaining above 4778.

Nifty-Micro Analysis of Intra Day Chart(04-Jan-2011):


 Technical Patterns and Formations in today intraday charts

1- Consolidation between 4735-4756
2- Rounding bottom support formation
3- Whole day consolidation patterns only
4- Whole day trading between 4730-4780

Conclusions from intra day chart analysis(04-Jan-2011)

Good support at lower levels and whole day consolidation pattern formations also therefore rally continuation expectation emerged from intraday charts formations.


Conclusions (After Putting All Studies Together)

Firstly 2008 sharp fall and after that more than 4 months range bound market was seen before 3600 Nifty points rally. In the same manner Now 103 sessions range bound(4720-5229) market after Diwali-2010 sharp fall therefore susch huge upmoves possibility is very much alive after this range break out. As trend reversal Broadening Pattern also developed in thelast 103 sessions therefore 14 months down trend reversal and fresh rally possibility is very much high after 103 sessions range upward break out.

December 2011 was 13th month of Long term correction correction and on going upmove begun on 21-12-2011 from 4532. As 13 is a Fibonacci number therefore correction completion as well as trend reversal possibility in 13th corrective month is very much alive.

Although selling seen at higher levels but good consolidation at lower levels also felt in last 3 sessions as well as more consolidation patterns formations therefore expected that Nifty will finally sustain above last 3 sessions range(4687-4795).

Both intraday and EOD Charts are suggesting for more up moves after very short term correction completion in last 3 sessions. Although up moves may be slow because of following 8 resistances but expected that consolidation process and rally continuation will progress simultaneously in the coming week.

1- 4780-4838
2- 4880-4905
3- 4950-4980
4- 5070-5098
5- 5130-5225
6- 5260-5310
7- 5240-5265
8- 5340-5375

FII Trading Data in Derivatives Segment on 06-Jan-2012


FII & DII trading activity in Capital Market Segment on 06-Jan-2012

FII trading activity on NSE and BSE in Capital Julket Segment(In Rs. Crores)
CategoryDateBuy ValueSell ValueNet Value
FII06-Jan-20121852.481842.0410.44


DII trading activity on NSE and BSE in Capital Julket Segment(In Rs. Crores)
CategoryDateBuy ValueSell ValueNet Value
DII06-Jan-2012618.95817.83-198.88

Indian Stock Markets Closing Reports(06-Jan-2012)

Main features of today trading are as follows

1- Benchmark Indices closed flat amid highly volatile market.
2- All the Indices closed with small gains/loss.
3- White Candle.

Ratios

Nifty Put Call Ratio: 1.03
Nifty P/E Ratio(06-Jan-2012): 17.22

Advances & Declines

BSE Advances : 1443
BSE Declines : 1300
NSE Advances : 691
NSE Declines : 724

Nifty Open Interest Changed Today

Nifty- 4600 CE(Jan)- -27250(-1.76%)
Nifty- 4600 PE(Jan)- +416000(+8.10%)

Nifty- 4700 CE(Jan)- +618650(+22.02%)
Nifty- 4700 PE(Jan)- +202350(+3.90%)

Nifty- 4800 CE(Jan)- +216050(+5.43%)
Nifty- 4800 PE(Jan)- +100700(+4.90%)

Nifty- 4900 CE(Jan)- +113750(+2.51%)
Nifty- 4900 PE(Jan)- +124450(+11.28%)

Closing 

Nifty- closed at 4,754.10(+4.15 Points & +0.09%)
Sensex- closed at 15,867.73(+10.65 Points & +0.07%)
CNX Midcap - closed at 6,245.30(-18.50 Points & -0.30%)
BSE Smallcap- closed at 5,704.32(+1.10 Points & +0.02%)

Nifty Spot-Levels & Trading Strategy for 07-01-2012

Nifty Spot-Levels

R3 4911
R2 4852
R1 4803
Avg 4744
S1 4695
S2 4636
S3 4587

Nifty Spot-Trading Strategy

H6 4863     Trgt 2
H5 4838     Trgt 1
H4 4813     Long breakout
H3 4783     Go Short
H2 4773
H1 4763
L1 4744
L2 4734
L3 4724     Long
L4 4694     Short Breakout
L5 4669     Trgt 1
L6 4644     Trgt 2

Nifty(Jan Fut)-Levels & Trading Strategy for 07-01-2012

Nifty(Jan Fut)-Levels

R3 4959
R2 4890
R1 4830
Avg 4761
S1 4701
S2 4632
S3 4572

Nifty(Jan Fut)-Trading Strategy

H6 4902     Trgt 2
H5 4872     Trgt 1
H4 4841     Long breakout
H3 4806     Go Short
H2 4794
H1 4782
L1 4759
L2 4747
L3 4735     Long
L4 4700     Short Breakout
L5 4669     Trgt 1
L6 4639     Trgt 2

Bank Nifty(Jan Fut)-Levels & Trading Strategy for 07-01-2012

Bank Nifty(Jan Fut)-Levels

R3 8955
R2 8776
R1 8632
Avg 8453
S1 8309
S2 8130
S3 7986


Bank Nifty(Jan Fut)-Trading Strategy

H6 8819     Trgt 2
H5 8742     Trgt 1
H4 8665     Long breakout
H3 8576     Go Short
H2 8547
H1 8517
L1 8458
L2 8428
L3 8399     Long
L4 8310     Short Breakout
L5 8233     Trgt 1
L6 8156     Trgt 2

Pre-Closing Outlook(06-01-2012)

Sharp up move begun at 02:25 PM today but well before the beginning of this up move we told for Indian markets support at 1:46:00 PM today and following projection was updated:-

"intraday support seen at lower levels between 4688-4700 today therefore until Nifty will not slip below it till then next down move will not be considered"

Highly volatile market today but lower level support also and view is bullish but finally sustaining beyond 3 sessions achual trading range(4688-4790) will give next trend confirmation and that should be firstly watched for confirmations.

Mid-session Outlook(06-01-2012)

Nifty traded in this week between 4690-4778,crucial supports and resistances within this range are as follows:-

1- Support between 4590-4625(02-01-2012)
2- Resistance between 4765-4778(05-01-2012)

As soon as selling developed yesterday then it was updated at 11:29:00 AM yesterday and down moves were seen after that also.Nifty traded above 4730 in last 2 sessions but slipped below it because news based and weaker global cues based led down moves today.

Sudden fall in Euro led news fall in Indian and global markets and today intraday moves will depend on the continuation or reversion of these 2 news therefore sustaining below 4730 should be watched..

As intraday support seen at lower levels between 4688-4700 today therefore until Nifty will not slip below it till then next down move will not be considered.

Post-open Outlook-2(06-01-2012)

Negative news of sudden fall in Euro triggered down moves in Global markets and more down moves are possible in Indian markets also. High possibility of testing of previous week supports.

Post-open Outlook(06-01-2012)

All the Asian markets are in Red and some are more than 1% down therefore Indian markets opened weak and Nifty is hovering around the lower levels(4730) of last 2 sessions. Sustaining beyond 4730 will decide next big trend therefore should be firstly watched in first session of today for confirmations.

4730-4780 break out will trigger Big Moves

Nifty-Micro Analysis of Intra Day Chart For 06-01-2012

Nifty-Intra Day Chart(05-Jan-2011):-
Just click on chart for its enlarged view
Technical Patterns and Formations in today intraday charts

1- Selling between 4765-4778.
2- Rising channel broken down.
3- Support between 4731-4742
4- Whole day trading between 4731-4779

Nifty-Micro Analysis of 2 days Intra Day Chart(Jan 04 & Jan 05,2012)

Nifty-Intra Day Chart(Jan 04 & Jan 05,2012):-
Just click on chart for its enlarged view
Technical Patterns and Formations in last 2 sessions intraday charts

1- Selling at higher levels
2- Buying at lower levels
3- Last 2 days trading between 4730-4780

Nifty-Micro Analysis of 3 days Intra Day Chart(Jan 03 to Jan 05,2012)

Nifty-Intra Day Chart(Jan 03 to Jan 05,2012):-
Just click on chart for its enlarged view
Technical Patterns and Formations in last 3 sessions intraday charts

1- Strong rally on 03-01-2012
2- Last 2 days mixed intraday patterns between 4730-4780

Conclusions from last 3 sessions intra day chart analysis 

Strong rally on 03-01-2012 and after that 2 days of its correction with mixed intraday patterns within 4730-4780. It is confirm that market is preparing for next decisive moves within 50 points range and its break out confirmation will form next short term trend and may lay the foundation of next big moves also.

As more consolidation patterns in last 2 sessions therefore its upside break out possibility is more but confirmation is also must through sustaining beyond or forceful break out of this range.

Riping too much between 4730-4780 and its break out will trigger big moves therefore should be watched first.

FII Trading Data in Derivatives Segment on 05-Jan-2012


FII & DII trading activity in Capital Market Segment on 05-Jan-2012

FII trading activity on NSE and BSE in Capital Julket Segment(In Rs. Crores)
CategoryDateBuy ValueSell ValueNet Value
FII05-Jan-20122247.611866.19381.42


DII trading activity on NSE and BSE in Capital Julket Segment(In Rs. Crores)
CategoryDateBuy ValueSell ValueNet Value
DII05-Jan-2012795.651084.86289.21

Indian Stock Markets Closing Reports(05-Jan-2012)

Main features of today trading are as follows

1- All the Indices closed with minor gains or minor loss.
2- Whole day sideways trading.
3- Today trading range(4730-4780) break out will open the gate of next strong move.

Ratios

Nifty Put Call Ratio: 1.11
Nifty P/E Ratio(05-Jan-2012): 17.20

Advances & Declines

BSE Advances : 1464
BSE Declines : 1238
NSE Advances : 775
NSE Declines : 648

Nifty Open Interest Changed Today

Nifty- 4600 CE(Jan)- -23900(-1.52%)
Nifty- 4600 PE(Jan)- +336800(+6.83%)

Nifty- 4700 CE(Jan)- -74250(-2.56%)
Nifty- 4700 PE(Jan)- +594600(+12.69%)

Nifty- 4800 CE(Jan)- +502450(+14.21%)
Nifty- 4800 PE(Jan)- +35200(+1.72%)

Closing 

Nifty- closed at 4,749.95(+0.30 Points & +0.01%)
Sensex- closed at 15,857.08(-25.56 Points & -0.16% )
CNX Midcap - closed at 6,263.80(+2.05 Points & +0.03%)
BSE Smallcap- closed at 5,691.37(+5.60 Points & +0.10%)

Nifty Spot-Levels & Trading Strategy for 06-01-2012

Nifty Spot-Levels

R3 4824
R2 4801
R1 4775
Avg 4752
S1 4726
S2 4703
S3 4677

Nifty Spot-Trading Strategy

H6 4798     Trgt 2
H5 4787     Trgt 1
H4 4775     Long breakout
H3 4762     Go Short
H2 4757
H1 4753
L1 4744
L2 4740
L3 4735     Long
L4 4722     Short Breakout
L5 4710     Trgt 1
L6 4699     Trgt 2

Nifty(Jan Fut)-Levels & Trading Strategy for 06-01-2012

Nifty(Jan Fut)-Levels

R3 4837
R2 4814
R1 4786
Avg 4763
S1 4735
S2 4712
S3 4684

Nifty(Jan Fut)-Trading Strategy

H6 4809     Trgt 2
H5 4797     Trgt 1
H4 4786     Long breakout
H3 4772     Go Short
H2 4767
H1 4762
L1 4753
L2 4748
L3 4743     Long
L4 4729     Short Breakout
L5 4718     Trgt 1
L6 4706     Trgt 2

Bank Nifty(Jan Fut)-Levels & Trading Strategy for 06-01-2012

Bank Nifty(Jan Fut)-Levels

R3 8666
R2 8592
R1 8509
Avg 8435
S1 8352
S2 8278
S3 8195

Bank Nifty(Jan Fut)-Trading Strategy

H6 8584     Trgt 2
H5 8548     Trgt 1
H4 8512     Long breakout
H3 8469     Go Short
H2 8454
H1 8440
L1 8411
L2 8397
L3 8382     Long
L4 8339     Short Breakout
L5 8303     Trgt 1
L6 8267     Trgt 2

Pre-Closing Outlook(05-01-2012)

Following lines were told yesterday in Rally is On Despite Red Closing Today

Expected that Nifty will firstly hover around today trading range(4730-4780) but will not sustain below 4730 and finally cross and sustain above 4730 as well as rally will remain continued in the coming sessions.

100% Accuracy proofs of above projection are as follows;-

1- 4730-4780 was given yesterday and today trading range is 4730.15-4779.80
2- Told that will not sustain below 4730 and whole day trading above 4730 today.
3- Told that sustain above 4730 and whole day trading above 4730 today.

100% Accuracy proofs of today projection is as follows;-

"selling patterns also seen at higher levels' was told at 11:29:00 AM today and Nifty could not sustain at higher levels.

Selling was told at 11:29:00 AM and new intraday low was formed in last 45 minutes today.

Although market could not sustain at higher levels and today selling patterns are also seen today but more consolidation patterns in last 2 sessions therefore upside break out possibilities of last 2 sessions range(4730-4780) are more in the coming sessions.

Mid-session Outlook-2(05-01-2012)

Following line was told regarding 4730-4790 in Mid-session Outlook at 11:26:00 AM yesterday

Nifty will prepare for next immediate moves between 4730-4790 and sustaining beyond this range will be next moves confirmation.

Nifty is trading between this range since the posting time. Last 2 sessions trading within above mentioned range and decisive next trend after its break out as well as technical positions within this range have also been explained in last 2 days. As soon as selling patterns were seen then that was also updated at 11:29:00 AM today.

Just watch sustaining beyond 4730-4790 for next decisive trend confirmation.

Mid-session Outlook(05-01-2012)

Following lines were told yesterday:-

Expected that Nifty will firstly hover around today trading range(4730-4780) but will not sustain below 4730 and finally cross and sustain above 4730 as well as rally will remain continued in the coming sessions.

Nifty is trading within above mentioned range since opening today but minor selling patterns also seen at higher levels in first two hours. Although confirmations are required but break out of mentioned range(4730-4780) should be kept in mind for next moves confirmations.