ॐ ह्रीं श्रीं लक्ष्मीभयो नमः॥


Trading "calls" from our "Software" with more than "90% accuracy"

 This is the "Oldest & Only Website" of whole World
which is updating Nifty & Indian Stock Markets
"Daily and Weekly accurate Outlooks" 
with "Intraday Charts Analysis"for the 
last more than "14 years" means from "2010"
For its live Proofs just see "Archive"
in the "bottom of this Website".

Fuel price hike news led Down Moves today

As Fuel price hike news on Business News Channels therefore sentiment weakened and Indian markets slipped after higher levels selling today. Intraday down moves of today are again negative news generated but Indian markets are showing Bullish Falling Channel formation also therefore rally continuation above 6026 hopes are very much alive.

As continuous 2 days market is negative news led and tomorrow INFY Quaterly financial results as well as IIP numbers announcement also therefore high volatility can not be ruled out and trading should be done with strict Stop Loss. Although expected that finally rally will be seen above 6026 after follow up consolidations but sustaining beyond 5965 should also be firstly watched for next trend confirmation.

Mid-session Outlook(10-01-2013)

Although strong opening today but selling development at intraday higher levels and under performance than Global markets also. Most crucial level for deciding next trend is 5965 and sustaining it beyond should be firstly watched now for next trend confirmation. 

Post-open Outlook-2(10-01-2013)

Again selling seen today and view is cautious,sustaining beyond 5965 should be firstly watched today for next trend confirmation. 

Post-open Outlook(10-01-2013)

Although sharp fall in last hour yesterday but we told following conclusive lines yesterday in Sideways market between 5965-6026 on 10-01-2013:-

1- today last hour fall was only negative news led panic bottom formation
2-  Until Nifty will not give 100% confirmation of sustaining below 5965 till then any down move will not be considered
3- rally continuation above 5965 will be expected.

Nifty is trading between strong resistance range(6000-6026) after positive opening but complete consolidation is required for decisive break out above 6026 and also expected that 

finally break out above 6026 will be seen within couple of sessions after follow up consolidations. 

Sideways market between 5965-6026 on 10-01-2013

Nifty-Intra Day Chart (Jan 02 to Jan 092013):-
Just click on chart for its enlarged view
Technical Patterns and Formations in last 6 Sessions intraday charts

1- Buying between 5965-5995 in last 6 sesions.
2- Selling between 6000-6026 in last 6 sesions.
3- 6 Sessions actual trading between 5960-6026.

Conclusions from 6 Sessions intra day chart analysis 

Long and Intermediate term trends are up and Short term trend is sideways for the last 6 sessions between 5960-6026 with both higher levels selling and lower levels buying. Sharp fall in last hour today but before that Rising Wedge Bearish formation was seen and as soon as we got Bearish pattern formation confirmation then immediately cautioned in Mid-session Outlook-2(09-01-2013) and told following line:-

Rising Wedge Bearish formation in last 40 minutes therefore view turned cautious

Importance of 5965 has already been updated in following topic on 07-01-2013


Nifty moved below 5965 in last 2 sessions and its today break down was negative news of Rail tariff rise generated and closing was above 5965 in both sessions also therefore no breaking down confirmation and sideways market continuation between 5960-6026.

As per our view today last hour fall was only negative news led panic bottom formation. Until Nifty will not give 100% confirmation of sustaining below 5965 till then any down move will not be considered and rally continuation above 5965 will be expected.

Sideways market and next moves preparation between 5965-6026 will be seen on 10-01-2013.

FII Trading Data in Derivatives Segment on 09-Jan-2013


FII & DII trading activity in Capital Market Segment on 09-Jan-2013

FII trading activity on NSE and BSE in Capital Market Segment(In Rs. Crores)
CategoryDateBuy ValueSell ValueNet Value
FII09-Jan-20133784.622935.67848.95

DII trading activity on NSE and BSE in Capital Market Segment(In Rs. Crores)
CategoryDateBuy ValueSell ValueNet Value
DII09-Jan-20131111.151629.45-518.3

Indian Stock Markets Closing Reports(09-Jan-2013)

Main features of today trading are as follows

1- Benchmark Indices closed in Red.
2- Negative news led sharp fall in last hour.
3- Long Black candle formation.

Ratios

Index Options Put Call Ratio: 0.90
Total Options Put Call Ratio: 0.85
Nifty P/E Ratio(09-Jan-2013): 18.78

Advances & Declines

BSE Advances : 1,386
BSE Declines : 1,589 
NSE Advances :   733
NSE Declines : 1,029 

Nifty Open Interest Changed Today

Nifty- 5800 CE(Jan)- -5,950(-0.59%)
Nifty- 5800 PE(Jan)-  59,400(0.84%)

Nifty- 5900 CE(Jan)- -40,650(-1.87%)
Nifty- 5900 PE(Jan)-  222,500(3.50%)

Nifty- 5000 CE(Jan)-  67,300 (1.45%)
Nifty- 5000 PE(Jan)- -362,300(-7.46%)

Nifty- 6100 CE(Jan)-  621,750(10.78%)
Nifty- 6100 PE(Jan)-  -84,400(-4.63%)

Closing 

Sensex- closed at 19,666.59(-75.93 Points & -0.38%)
Nifty- closed at 5,971.50(-30.20 Points & -0.50%)
CNX Midcap - closed at 8,742.05(-49.00 Points & -0.56%)
CNX Smallcap- closed at 3,862.15(-18.60 Points & -0.48%)

Nifty Spot-Levels & Trading Strategy for 10-01-2013

Nifty Spot-Levels

R3 6070
R2 6045
R1 6008
Avg 5983
S1 5946
S2 5921
S3 5884

Nifty Spot-Trading Strategy

H6 6033     Trgt 2 
H5 6019     Trgt 1
H4 6005     Long breakout 
H3 5988     Go Short 
H2 5982
H1 5976
L1 5965
L2 5959
L3 5953     Long 
L4 5936     Short Breakout 
L5 5922     Trgt 1 
L6 5908     Trgt 2

Nifty(Jan Fut)-Levels & Trading Strategy for 10-01-2013

Nifty(Jan Fut)-Levels

R3 6104
R2 6076
R1 6037
Avg 6009
S1 5970
S2 5942
S3 5903

Nifty(Jan Fut)-Trading Strategy

H6  6065    Trgt 2 
H5  6050    Trgt 1
H4  6034    Long breakout 
H3  6016    Go Short 
H2  6010
H1  6004
L1  5991
L2  5985
L3  5979    Long 
L4  5961    Short Breakout 
L5  5945    Trgt 1 
L6  5930    Trgt 2

Bank Nifty(Jan Fut)-Levels & Trading Strategy for 10-01-2013

Bank Nifty(Jan Fut)-Levels

R3 12971
R2 12920
R1 12846
Avg 12795
S1 12721
S2 12670
S3 12596

Bank Nifty(Jan Fut)-Trading Strategy

H6 12897     Trgt 2 
H5 12869     Trgt 1
H4 12840     Long breakout 
H3 12806     Go Short 
H2 12794
H1 12783
L1 12760
L2 12749
L3 12737     Long 
L4 12703     Short Breakout 
L5 12674     Trgt 1 
L6 12646     Trgt 2

Pre-Closing Outlook-2(09-01-2013)

As per Business Channels that huge rise Rail tariff may be announced by Railway Minister today therefore sharp fall seen in Indian markets.

Rising Wedge Bearish formation was updated well in advance by us. Although Nifty slipped below 5965 but today down moves are negative news generated therefore sustaining below 5965 will be firstly watched tomorrow for down trend confirmation.

Pre-Closing Outlook(09-01-2013)

As soon as Rising Wedge Bearish formation was seen then it was immediately updated and Nifty slipped after that as well as formed new intraday lows. As 5 Sessions trading between 5965-6026 with mixed intraday patterns(Higher levels selling and lower levels) therefore following lines were told in almost all previous Outlooks and being repeated:-

Strong resistance formation between 6000-6026 therefore complete consolidation is required for decisive rally above 6026 and sustaining beyond 5965-6026 will be firstly watched now for next moves confirmations.

Mid-session Outlook-2(09-01-2013)

Although Nifty recovered from lower levels and traded again above 6000 also but development of Rising Wedge Bearish formation in last 40 minutes therefore view turned cautious and sustaining beyond 5965-6026 will be firstly watched now for next moves confirmations because mixed intraday patterns seen today.

Mid-session Outlook(09-01-2013)

Firstly emergence of consolidation indications and then minor up moves also seen but not sustaining at higher levels and loosing of all intraday gains as well as now trading near today intraday lower levels below 6000 but up moves continuation hopes above 6026 is still alive after follow up complete consolidations firstly between 5974-6000 and after that between 6000-6026.

Now next trend confirmation range is 5965-6026.

Post-open Outlook-2(09-01-2013)

As good selling and strong resistance formation between 6000-6026 in previous 4 sessions therefore complete consolidation is required for decisive rally above 6026. Nifty is trading within mentioned resistance range between 6006-6015 and preparing for next moves. As emergence of consolidation indications therefore hopes of rally above 6026 turned alive but valid break out of 6000-6026 should also be watched for next immediate moves confirmation.

Post-open Outlook(09-01-2013)

Although Nifty Jan Fut. is trading in Red today but intraday charts have not shown selling formations yet. Nifty is trading in Green but between resistance range(6000-6026) after positive opening and firstly sustaining beyond this range will be watched today for next immediate moves confirmation. 
Rally toward 6239.95 after support at 5965

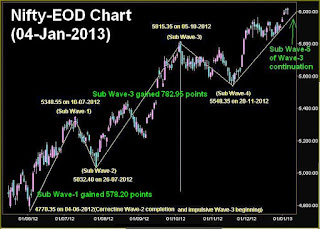
Following Nifty-EOD Chart (04-Jan-2013) was updated on 05-01-2013 in Nifty Target at 8616.90 and it was shown that at present Sub Wave-5 of Wave-3 is continued,now its waves structure and next target will be understood:-

Nifty-EOD Chart (04-Jan-2013):-
Just click on chart for its enlarged view
Sub Wave-5 of Wave-3 in Nifty-EOD Chart (08-Jan-2013):-
Just click on chart for its enlarged view
Technical Patterns and Formations in EOD charts

1- Sub Wave-4 completion(5548.35 on 20-11-2012).
2- Sub Wave-5 of Wave-3 continuation.
3- Sub Wave-1 of Sub Wave-5(5965.15 on 11-12-2012)
4- Sub Wave-1 of Sub Wave-5 gained 416.80 points.
5- Sub Wave-2 of Sub Wave-5(5823.15 on 18-12-2012).
6- Sub Wave-3 of Sub Wave-5 is on.

Conclusions from EOD chart analysis 

As per   Elliot Wave theory Wave-3 of any degree should never be shorter than both Wave-1 and Sub Wave-5 of that degree. Sub Wave-1 gained 416.80 points and as per theory Sub Wave-3 will gain minimum 416.80 points which started from 5823.15 and its minimum target will be:-

5823.15+416.80=6239.95 

Nifty-Intra Day Chart (08-Jan-2013):-
Just click on chart for its enlarged view
Technical Patterns and Formations in today intraday charts

1- Consolidation between 5965-5974.
2- Bounce back after lower levels consolidations.
3- Whole day actual trading between 5965-6006.

Conclusions from intra day chart analysis 

When Nifty was trading near 5965 and all the Global market were in Red then we told following lines today at 12:25 PM in Mid-session Outlook(08-01-2013):-

we are expecting support getting and rally beginning after yesterday started correction completion near 5965.

Bounce back after consolidation between 5965-5974 was seen today and importance of 5965 was updated in following topic yesterday:-


Technical positions of last 4 Sessions have already been updated in intraday chart of above mentioned topic and it is clear that good selling and resistance development between 6000-6026 in last 4 sessions and firstly requirement of complete consolidation in the coming sessions for decisive rally above 6026. 

Good support at 5965 today and expected that finally on going rally will remain continued toward above mentioned target of 6239.95.

FII Trading Data in Derivatives Segment on 08-Jan-2013


FII & DII trading activity in Capital Market Segment on 08-Jan-2013

FII trading activity on NSE and BSE in Capital Market Segment(In Rs. Crores)
CategoryDateBuy ValueSell ValueNet Value
FII08-Jan-20133177.072289.69887.38

DII trading activity on NSE and BSE in Capital Market Segment(In Rs. Crores)
CategoryDateBuy ValueSell ValueNet Value
DII08-Jan-2013735.41763.52-1028.12

Indian Stock Markets Closing Reports(08-Jan-2013)

Main features of today trading are as follows

1- Benchmark Indices closed in Green. 
2- Strong recovery after getting support at 5965.
3- White Candle formation.

Ratios

Index Options Put Call Ratio: 1.04
Total Options Put Call Ratio: 0.98
Nifty P/E Ratio(08-Jan-2013):18.84

Advances & Declines

BSE Advances : 1,433
BSE Declines : 1,505 
NSE Advances :   634 
NSE Declines :   811

Nifty Open Interest Changed Today

Nifty- 5800 CE(Jan)- 8,100(0.78%)
Nifty- 5800 PE(Jan)- 787,950(12.49%)

Nifty- 5900 CE(Jan)- -90,300(-3.94%)
Nifty- 5900 PE(Jan)-  250,650(4.04%)

Nifty- 6000 CE(Jan)- 65,900(1.42%)
Nifty- 6000 PE(Jan)- 479,800(10.77%)

Nifty- 6100 CE(Jan)- 381,000(6.89%)
Nifty- 6100 PE(Jan)- 111,850 (6.44%)

Closing 

Sensex- closed at 19,742.52(51.10 Points & 0.26%)
Nifty- closed at 6,001.70(13.30 Points & 0.22%)
CNX Midcap - closed at 8,791.05(23.00 Points & 0.26%)
CNX Smallcap- closed at 3,880.75(-7.95 Points & -0.20%)