ॐ ह्रीं श्रीं लक्ष्मीभयो नमः॥


Trading "calls" from our "Software" with more than "90% accuracy"

More than "12 years" old "only site of whole world" 
with more than "9700 accurate Outlooks" of 
"Indian Stock Markets" 

Technical Analysis and Market Outlook(01-01-2014)

Nifty-Intra Day Chart (31-Dec-2013):-
Just click on chart for its enlarged view
Technical Patterns and Formations in today intraday charts

1- Selling patterns between 6305-6317
2- Selling patterns between 6300-6305
3- Whole day actual trading between 6287-6317

Conclusions from intra day chart analysis 

Almost whole day positive zone trading but selling patterns formation above 6300 therefore expected that Nifty will not sustain above it and finally slip below 6300 despite today closing at 6304 today.

Intraday support between 6274-6287 yesterday and selling patterns formation between 6314-6324 on 27-12-2013 therefore mixed technical positions in last 3 sessions and firstly Nifty has to prepare for next decisive moves between  6274- 6324. It is clear that sustaining beyond 6274- 6324 will give next immediate moves confirmation and finally sustaining beyond 6130-6415 will give next big trend confirmation and should be firstly watched in the coming sessions. 

Pre-closing Outlook(31-12-2013)

Most time narrow range trading within 23 points between 6292-6315 with selling indications therefore finally down moves are expected in the coming sessions.

Technical Analysis and Market Outlook(31-12-2013)

Nifty-Intra Day Chart (30-Dec-2013):-
Just click on chart for its enlarged view
Technical Patterns and Formations in today intraday charts

1- Higher levels selling immediately after opening.
2- Most time trading in first 5 hours between 6290-6309.
3- Selling patterns formation between 6300-6309.
4- Bullish Falling Channel pattern formation.
5- Down moves without required force.
6- Support between 6274-6287.
7- Whole day actual trading between 6274-6344.

Conclusions from intra day chart analysis 

As intraday selling patterns formation between 6314-6324 last Friday therefore slipping below 6304 was told same day and it was seen today after follow up selling at higher levels today but Bullish pattern formation and lower levels supports also seen today therefore sustaining beyond today trading range should be firstly watched for next immediate moves confirmations because:-

1- Both intraday buying and selling patterns formation seen today.
2- Although selling in previous week but buying patterns seen above those selling levels today.

All trends are up,impulsive Wave-3 is on and Bull markets consolidate also at higher levels therefore firstly sustaining beyond today trading range(6274-6344) will give next immediate moves confirmation and finally sustaining beyond 6130-6415 will give next big trend confirmation. Follow up intraday moves in the coming sessions will be watched for first indication of next moves and will be updated in Mid-session Outlooks as being done for the last more than 3 years.

Pre-closing Outlook(30-12-2013)

Most time trading between 6274-6309 with mixed intraday patterns formations because higher levels selling but down moves without required force and with lower levels supports also therefore firstly sustaining beyond mentioned range should be watched for next immediate moves confirmations.

Mid-session Outlook-2(30-12-2013)

Most time trading between 6290-6309 with intraday selling patterns formations and slipped below 6290 also but not forcefully and consolidation indications also developing in today intraday charts therefore mixed formations and sustaining below 6290 should be firstly watched for next immediate moves confirmations.

Mid-session Outlook(30-12-2013)

As Nifty traded most time between 6304-6319 with selling patterns formations on 27-12-2013 therefore slipped below this range within first half hour today and since then trading between 6290-6309 with intraday selling patterns formations and expected that Nifty will slip below today lowest as well.

Post-open Outlook(30-12-2013)

Following lines were told:-

1- In Pre-closing Outlook on 27-12-2013:- "Nifty will firstly slip below 6304 in next week"
2- In Firstly Down Moves towards Next Strong Supports on 29-12-2013:- "firstly slip below 6304/6289/6260/6130 and sustaining beyond 6130 will be watched to understand next trend"

Now Nifty is trading below 6304 and should be kept in mind that fast down moves are possible after valid breaking down of 6260 because that will be confirmation of last 4 sessions selling.
Firstly Down Moves towards Next Strong Supports

Technical Analysis,Research & Weekly Outlook
(Dec 30 to Jan 03,2014)
Nifty-EOD Chart (27-Dec-2013):-
Just click on chart for its enlarged view
Technical Patterns and Formations in EOD charts

1- Bottom formation at 5118.85 on 28-08-2013 and Wave-1 beginning
2- Wave-1(6142.50 on 19-09-2013)
3- Wave-2(5700.95 on 01-10-2013)
4- Wave-i of Wave-3(6342.95 on 03-11-2013)
5- Wave-ii of Wave-3(5972.45 on 13-11-2013)
6- Wave-iii of Wave-3(6415.25 on 09-12-2013)
7- Wave-iv of Wave-3(6129.95 on 18-12-2013)
8- Wave-v of Wave-3 continuation with recent top formation at 6324.90 on 27-12-2013.  

Conclusions from EOD chart analysis 

All Trends were up and Wave-3 continuation towards minimum target of Nifty at 6724.60. Its calculation has already been updated in following topic on 21-10-2013:-


It must be kept in mind that it is price vice target and not time vice therefore market will take its own time to achieve it.

Nifty-Intra Day Chart (Dec 09 to Dec 27,2013):-
Just click on chart for its enlarged view
Technical Patterns and Formations in last 14 Sessions intraday charts

1- Strong support range 6130-6180
2- Resistance between 6360-6387
3- Resistance between 6330-6355
4- Sideways trading between 6260-6324 within only 64 points with higher levels selling in previous week.
5- 14 Sessions actual trading between 6130-6415 

Conclusions from 14 Sessions intra day chart analysis 

Multiple resistances between 6330-6387 and just below it previous week sideways trading with higher levels selling therefore emergence of down moves possibility.

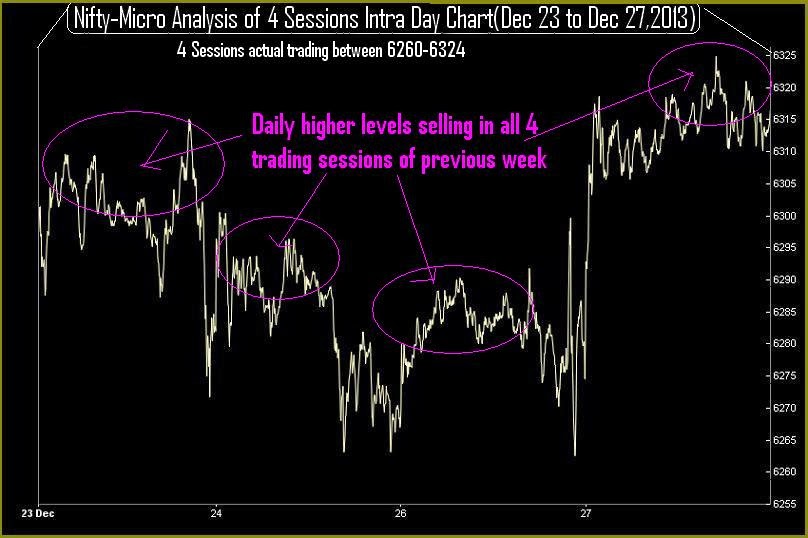
Nifty-Intra Day Chart (Dec 23 to Dec 27,2013):-
Just click on chart for its enlarged view
Technical Patterns and Formations in last 4 sessions intraday charts

1- Daily higher levels selling in all 4 trading sessions of previous week.
3- 4 Sessions actual trading between 6260-6324 

Conclusions from 4 Sessions intra day chart analysis 

Previous whole week sideways trading within only 64 points therefore sustaining beyond this range will give big moves. As most time selling patterns seen in last 4 sessions therefore finally down moves are expected in the coming week despite previous week closing near weekly highest levels. 

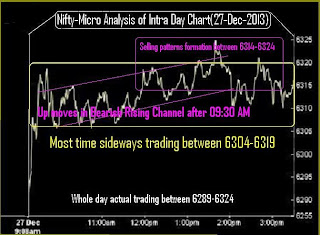
Nifty-Intra Day Chart (27-Dec-2013):-
Just click on chart for its enlarged view
Technical Patterns and Formations in today intraday charts

1- Up moves in Bearish Rising Channel after 09:30 AM.
2- Most time sideways trading between 6304-6319.
3- Selling patterns formation between 6314-6324.
4- Whole day actual trading between 6289-6324.

Conclusions from intra day chart analysis 

Most time sideways trading between 6304-6319 with Bearish Rising Channel and higher levels selling patterns formation therefore down moves below 6304 are expected in next week. 

Conclusions (After Putting All Indicators Together)

Impulsive Wave-v of impulsive Wave-3 is on with closing near the weekly highest last Friday but most time selling patterns seen in all last 4 sessions of previous week therefore firstly down moves are expected in next week. As strong supports above 6130 also developed in last 14 sessions therefore Nifty will not easily slip below it. 
Expected that finally Nifty will sustain above 6415 and move towards minimum 6724.60 but firstly slip below 6304/6289/6260/6130 and sustaining beyond 6130 will be watched to understand next trend but high possibility of up trend beginning after fresh consolidations near about 6130. 

As Indian markets are in Bullish phase therefore expected that Nifty will remain range bound in broader range of last 14 sessions 6130-6415 and prepare for next big trend in the coming weeks.

Pre-closing Outlook(27-12-2013)

Following conclusions from today charts were told in both previous Outlooks:-

1- up moves since 09:30 AM are in Bearish Rising Channel therefore next rally confirmation is must through sustaining above 6319
2- Next moves confirmations through sustaing beyond 6304-6319 was told 

Although Nifty moves above 6319 but could not sustain and slipped and now trading within mentioned range at 6312 after high formation at 6324.90 because Bearish Rising Channel and expected that Nifty will firstly slip below 6304 in next week
   

Mid-session Outlook-2(27-12-2013)

Although strong market today but up moves since 09:30 AM are in Bearish Rising Channel therefore next rally confirmation is must through sustaining above 6319.

Mid-session Outlook(27-12-2013)

As selling yesterday and consolidation was must for decisive up moves therefore sideways trading between 6304-6319 after strong break out of last 3 sessions range. Sustaing beyond this range will be confirmation of:-

1- Valid break out of last 3 sessions range above 6319 and resultant strong rally in next week.
2- False break out of last 3 sessions range below 6304 and resultant firstly down moves and deeper correction confirmation will be below 6260.

Post-open Outlook(27-12-2013)

Forceful  break out of last 3 sessions range does mean  high possibility of rally continuation after 3 sessions sideways correction completion and confirmation will be after sustaining above 6302 and should be firstly watched today.

Technical Analysis and Market Outlook(27-12-2013)

Nifty-Intra Day Chart (26-Dec-2013):-
Just click on chart for its enlarged view
Technical Patterns and Formations in today intraday charts

1- High volatility
2- First 2 hours trading with with Bearish Rising Channel.
3- Selling between 6284-6292 
4- Whole day trading between 6260-6302

Conclusions from intra day chart analysis 

First 2 hours trading with with Bearish Rising Channel and selling patterns formations also between 6284-6292 therefore following lines were told in Mid-session Outlook at 01:01 PM today:-

1- now trading also near the highest levels of today but some indications of selling today
2- next up moves confirmations will be after valid break out above 6292.

As selling therefore Nifty could not sustain above 6292 and closed below it at 6,278.90. Until Nifty will not sustain above 6292 till then next up move will not be considered and valid break out of today trading range(6260-6302) should also be firstly watched for next immediate moves confirmations because technical positions reversed also in today like highly volatile markets.

Pre-closing Outlook(26-12-2013)

As selling at higher levels today therefore Nifty did not sustaining at higher levels and slipped but high volatility today and until Nifty will not sustaining above 6292 till then next up move will not be considered because selling seen just below it today and selling was updated also in previous Outlook at 01:01 PM today.

Mid-session Outlook(26-12-2013)

Positive zone trading since opening and now trading also near the highest levels of today but some indications of selling today therefore next up moves confirmations will be after valid break out above 6292.

Technical Analysis and Market Outlook(26-12-2013)

Nifty-Intra Day Chart (24-Dec-2013):-
Just click on chart for its enlarged view
Technical Patterns and Formations in today intraday charts

1- More than 4 hours trading between 6281-6301.
2- Down moves in Bullish Falling Channel.
3- Whole day actual trading between 6262-6301.

Conclusions from intra day chart analysis 

Whole day range bound trading between 39 points with firstly more than 4 hours trading between 6281-6301 and without as such selling patterns formations despite  afterward down moves and closing near the lowest levels of the day. As down moves in Bullish Falling Channel and first 4 hours trading is also not showing as such intraday selling patterns therefore generation of  consolidation signals also in a negaive zone closing day. 

Indian markets are not prepared for any side decisive moves and will have to prepare for next trend between 6230-6380 in the coming sessions for next huge moves. Let market prepare for next trend then will be updated according to the confirmations from the intraday charts formations and for confirmations sustaining beyond following ranges should be watched:-

1- 6230-6380(For first strong indications of next trend)
2- 6130-6380(For the confirmations of next trend)

Mid-session Outlook(24-12-2013)

Following lines were told yesterday in Technical Analysis and Market Outlook(24-12-2013):-

1- Indian markets are not prepared for any side decisive moves and 
2- will firstly prepared for next trend between 6230-6380 in the coming sessions for next huge moves. 

As was told same happened and markets traded and preparing for next decisive moves within mentioned range since opening today. Although Nifty slipped from higher levels but not showing as such selling patterns and is a signal of consolidation as well. Now sustaining beyond following ranges should be watched:-

1- 6230-6380(For first strong indications of next trend)
2- 6130-6380(For the confirmations of next trend)

Technical Analysis and Market Outlook(24-12-2013)

Nifty-Intra Day Chart (23-Dec-2013):-
Just click on chart for its enlarged view
Technical Patterns and Formations in today intraday charts

1- Selling between 6267-6315
2- Sharp down moves in last hour. 
3- Whole day actual trading between 6272-6315

Conclusions from intra day chart analysis 

Although  intraday correction through sharp down moves in last hour but its possibility was updated well before its happening and following line was told at 11:56 AM in Mid-session Outlook:-

some indications of profit booking today therefore emergence of minor intraday correction possibility

Next strong resistances are between 6350-6380 and follow up selling seen below this range between 6267-6315 today but impulsive Wave-3 continuation and all trends are up as well as market is not prepared for deeper correction because only one day today selling after good consolidations in previous week. 

As complete selling is also required for any big correction and more consolidation is also required for sustaining above 6315 and 6380 therefore Indian markets are not prepared for any side decisive moves and will firstly prepared for next trend between 6230-6380 in the coming sessions for next huge moves. 

Expected that finally Nifty will sustain above 6380 and decisive strong rally will be seen after follow up consolidations in the coming sessions/week. Let market prepare then will be updated according to the completion of intraday charts formations in the same manner as being done for the last more than 4 years.

Mid-session Outlook-3(23-12-2013)

Following lines were told at 11:56 AM in Mid-session Outlook:-

1- More than 2 hours positive zone trading between 6288-6310
2- some indications of profit booking today therefore emergence of minor intraday correction possibility

As some indications of profit booking today therefore Nifty slipped below 6288 and if sustains below it only then very Short Term correction will be considered.

Mid-session Outlook-2(23-12-2013)

Quiet range bound market between 6288-6310 since opening and preparing for next blast today because next strong resistances are between 6350-6380 and market require complete consolidations for decisive and strong rally above 6380 as well as complete selling is also required for any big correction. Let market prepare then will be updated according to the completion of intraday charts formations and valid break out of 6288-6310 will be very Short Term trend first signal therefore should be firstly watched now.
    

Mid-session Outlook(23-12-2013)

More than 2 hours positive zone trading between 6288-6310 with some indications of profit booking today therefore emergence of minor intraday correction possibility and valid break out of this range will be very Short Term trend first signal.

Rally continuation towards 6724.60
Technical Analysis,Research & Weekly Outlook
(Dec 23 to Dec 27,2013)
Nifty-EOD Chart (20-Dec-2013):-
Just click on chart for its enlarged view
Technical Patterns and Formations in EOD charts

1- Rally beginning after 13 Months Wave-2 correction completion at 4531.15 on 20-12-2011.
2- Wave-1(5629.95 on 22-02-2012)
3- Wave-2(4770.35 on 04-06-2012)
4- Wave-3(6111.80 on 29-01-2013)
5- Wave-4(5477.20 on 10-04-2012)
6- Wave-5(6229.45 on 20-05-2013)('ABC'Correction beginning after 17 Months Rally completion)
7- Wave-A(5566.25 on 24-06-2013)
8- Wave-B(6093.35 on 23-07-2013)
9- Wave-C(5118.85 on 28-08-2013)('ABC'Correction completion after 3 Months correction completion)
10- Strong Rally continuation and new all time high formation at 6415.25 on 09-12-2013.

Conclusions from EOD chart analysis 

Strong Rally is on after ABC'Correction completion on 28-08-2013,Waves structure of this rally with following conclusions has already been updated 15-12-2013 in "Nifty at Most Crucial and Strong Support Range";-

1- 6141-6156 has become most crucial strong support range and consolidation pattern formation just above it on 13-12-2013
2- emergence of correction completion possibility near about mentioned range 

As was told on 15-12-2013 all that proved 100% accurate in previous week and Nifty reversed from 6129.95 after getting support just below 6141 and weekly closing was at the highest of the week after correction completion.

Nifty-EOD Chart (20-Dec-2013):-
Just click on chart for its enlarged view
Technical Patterns and Formations in EOD charts

1- Bottom formation at 5118.85 on 28-08-2013 and Wave-1 beginning
2- Wave-1(6142.50 on 19-09-2013)
3- Wave-2(5700.95 on 01-10-2013)
4- Wave-i of Wave-3(6342.95 on 03-11-2013)
5- Wave-ii of Wave-3(5972.45 on 13-11-2013)
6- Wave-iii of Wave-3(6415.25 on 09-12-2013)
7- Wave-iv of Wave-3(6129.95 on 18-12-2013)
8- Wave-v of Wave-3 continuation with recent top formation at 6274.25 on 20-12-2013.  

Conclusions from EOD chart analysis 

Long and Intermediate Term Trends were up and Short Term turned up after correction completion confirmation on 20-12-2013. Now all trends are up and Wave-3 continuation towards minimum target of Nifty at 6724.60. Its calculation has already been updated in following topic on 21-10-2013:-
 

Conclusions (After Putting All Indicators Together)

Strong rally last Friday after good consolidation above 6130 in previous week therefore until complete selling will not happen till then Nifty will not slip below 6130.As no selling seen at higher levels in previous week therefore no risk of immediate down moves but some resistances up to all time high(6415.25) therefore follow up consolidation is required in next week for sustaining above it.

Rally continuation towards 6724.60 is expected in the coming weeks after follow up consolidations.

Pre-closing Outlook(20-12-2013)

Although Nifty closed at the lowest of the day after loosing 50 points but we were Bullish and posted following topic yesterday:-


As was told 100% same happened and Nifty is now trading 115 points up. and rally continuation is expected in the coming sessions after follow up consolidations because some resistances are higher levels.

Mid-session Outlook-2(20-12-2013)

Good up moves after lower levels supports and consolidation patterns formations but some resistances also seen between 6227-6236 therefore firstly sustaining beyond this range should be watched for next immediate moves confirmations. Now Nifty is trading at 6226.

Mid-session Outlook(20-12-2013)

Sideways trading since opening with lower levels supports and consolidation patterns formations.

Post-open Outlook(20-12-2013)

Positive zone trading since opening today,sustaining above 6203 will be first strong signal of rally after Correction Completion and sustaining beyond 6141-6270 should be firstly for next trend confirmations.
Fresh Up Moves Possibility after Correction Completion
Nifty-Intra Day Chart (19-Dec-2013):-
Just click on chart for its enlarged view
Technical Patterns and Formations in today intraday charts

1- Sharp down moves in first 6 minutes and after that whole day range bound market between 6150-6203.
2- Up moves in Bearish Rising Channels
3- Down moves showing good intraday correction
4- Lower levels Rising trend line supports.
5- Most time actual trading between 6150-6203

Conclusions from intra day chart analysis 

Long and Intermediate Term Trends are up and Short Term turned down after correction beginning from 6415.25 on 09-12-2013. Last 6 sessions trading between 6141-6270 and sustaining beyond this range should be firstly watched in the coming sessions for next big trend confirmations because lower levels consolidations between 6141-6156 and higher levels selling between 6258-6270 as well as  both big news news of RBI Credit policy and FOMC tapering reaction within this range. 

Sharp down immediate after opening today and most time trading 6150-6203 and closing near the lower levels of the day but both bullish and bearish patterns seen as well as news based high volatility was also seen in last 2 sessions therefore technically final conclusions can not be drawn mere from intraday charts formations.

As intraday charts of last 5 sessions are showing most time consolidation and lower levels Rising trend line supports also seen today therefore emergence of correction completion and fresh up moves possibility in the coming sessions and weeks after Short Term Trend turning up. As no confirmation yet therefore firstly sustaining above 6141 and finally sustaining above 6270 should be watched for Wave-3 continuation after Short Term correction completion. 

Post-open Outlook(19-12-2013)

As last 4 hours trading between 6198-6230 with mixed patterns also seen yesterday therefore sustaining beyond 6141-6270 was told in all the previous 3 Outlooks and should be firstly watched after news based highly volatile markets today and yesterday.

Pre-open Outlook(19-12-2013)

As 10% tapering by FOMC therefore Global markets strong rally and Indian markets will also participate through gap up opening but next resistance between 6258-6270 and sustaining above 6270 will mean strong rally after correction completion confirmation and only sustaining above 6270 should be firstly watched in the coming sessions.

Just Watch 6141-6270 for next trend confirmations
Technical Analysis and Market Outlook
(19-12-2013)
Nifty-Intra Day Chart (18-Dec-2013):-
Just click on chart for its enlarged view
Technical Patterns and Formations in today intraday charts

1- Consolidation between 6144-7177.
2- Sharp up after RBI Credit Policy.
3- Last 4 hours trading between 6198-6230 with lower levels supports and higher levels selling patterns formations.
4- Whole day actual trading between 6144-6230

Conclusions from intra day chart analysis

Long and Intermediate Term Trends are up and Short Term turned down after correction beginning from 6415.25 on 09-12-2013. Nifty got support near about most crucial and strong support range(6141-6156) in last 2 sessions and strong recovery seen today after RBI Credit Policy but last 4 hours trading between 6198-6230 with mixed patterns also seen today therefore valid break out of mentioned range should be firstly watched tomorrow for following next immediate moves confirmations:-

1- Above 6230 will mean next up moves up to next resistance(6258-6270) and sustaining above 6270 will be fresh rally confirmation after sustaining above 6270. Although today closing at the highest of the day but view will be Bullish after sustaining above 6270 despite whatsoever QE-3 tapering decision by FOMC tonight.
2- Below 6198 will mean down moves towards next  strong support range(6141-6156) and deeper correction confirmation will be after sustaining below 6141.

Finally sustaining beyond 6141-6270 should be watched for next trend confirmations in the coming sessions after RBI Credit policy today and expected QE-3 tapering decision by FOMC tonight.

Pre-closing Outlook(18-12-2013)

Last 4 hours trading between 6198-6236 with slow up moves within this range which is a minor selling indication but lower levels supports also seen therefore valid break out of mentioned range should be firstly watched tomorrow for next immediate moves confirmations. 

Mid-session Outlook(18-12-2013)

Strong recovery after RBI Credit Policy and after that last 3 hours trading between 6198-6236 with slow up moves within this range which is a minor selling indication therefore valid break out of mentioned range should be watched for next immediate move confirmations. 

Live Proofs of Indian Stock Markets 100% Accurate Predictions

When most Business News Channels and Websites were confused for next moves after RBI Credit Policy today then we told for today up moves after Credit Policy in following lines in both previous Outlooks yesterday:-

1- In Pre-closing Outlook(17-12-2013):- "Now trading near the lows of the day after loosing all intraday gains but supports also seen at lower levels therefore up moves hopes after RBI Credit policy is still alive"

2- Technical Analysis and Market Outlook(18-12-2013):- "last hours down moves in Bullish Falling Channel therefore up moves expectation after correction completion is very much alive"

Not only yesterday and today but 'Archive' with 'more than 6500 posts' at the bottom of Blog' is live proof of "many hundreds" such accurate and miraculous predictions in last 4 years. Anyone can verify this facts anytime from the Blog 'Archive'.

Technical Analysis and Market Outlook(18-12-2013)

Nifty-Intra Day Chart (17-Dec-2013):-
Just click on chart for its enlarged view
Technical Patterns and Formations in today intraday charts

1- Higher levels mixed patterns formations
2- Down moves in Bullish Falling Channel within strong support range(6141-6156) in last hours.
3- Whole day actual trading between 6134-6190

Conclusions from intra day chart analysis 

Strong opening but not sustaining at higher levels and closing near the  lowest levels does not mean that coming sessions will be weak. As higher levels mixed patterns formations and without genuine selling patterns as well as last hours down moves in Bullish Falling Channel therefore up moves expectation after correction completion is very much alive.

Although strong support range(6141-6156) broken down but mentioned Bullish Falling Channel consolidation pattern also seen within and below 6141 therefore its breaking down confirmation is still left. As follow up consolidation seen within mentioned strong support range(6141-6156) therefore up moves hopes after RBI Credit policy is still alive and sustaining beyond 6141 should be firstly watched tomorrow for next trend confirmations. 

Pre-closing Outlook(17-12-2013)

Now trading near the lows of the day after loosing all intraday gains but supports also seen at lower levels therefore up moves hopes after RBI Credit policy is still alive and sustaining beyond 6141 should be firstly watched tomorrow for next trend confirmations. 

Post-open Outlook(17-12-2013)

Following lines were told in previous Outlook yesterday:-

1- up moves expectation after correction completion is still alive
2- sustaining beyond 6141-6183 should be firstly watched in the coming sessions for next trend confirmations.

Nifty is trading more than .50% up above 6183, sustaining it beyond should be firstly watched today for the confirmation of fresh up moves after correction completion.

Technical Analysis and Market Outlook(17-12-2013)

Nifty-Intra Day Chart (16-Dec-2013):-
Just click on chart for its enlarged view
Technical Patterns and Formations in today intraday charts

1- Higher levels mixed patterns formations
2- Whole day actual trading between 6147-6183

Conclusions from intra day chart analysis 

Most of the time flat to negative zone narrow range trading between 6147-6183 and closing near the lower level after slipping but higher levels mixed patterns formations and genuine selling not seen therefore up moves expectation after correction completion is still alive. 

Strong support range (6141-6156) not broken down despite increase in WPI data therefore some supports and consolidation will also be understood today and sustaining beyond 6141-6183 should be firstly watched in the coming sessions for next trend confirmations.

Mid-session Outlook-2(16-12-2013)

Sharp fall immediate after WPI announcement but next most crucial strong support range (6141-6156) not broken down and hovering around 6156. Market is preparing for next moves on 18-12-2013(after RBI Credit policy) on 19-12-2013(after FOMC) and length of on going correction will be decided according to the announcements of these events. Correction continuation and sustaining beyond mentioned strong support range should be firstly watched for its continuation / completion.

Mid-session Outlook(16-12-2013)

Although most Asian markets are trading in negative and some are in deep Red as well as Dow's Futures is more than 60 points down but Indian markets are flat to minor negative therefore outperforming global cues today. As most time trading above next most crucial strong support range (6141-6156) therefore correction completion hopes are alive. Follow up moves in the coming hours and sustaining beyond mentioned range should be firstly watched.
Nifty at Most Crucial and Strong Support Range

Technical Analysis,Research & Weekly Outlook
(Dec 16 to Dec 20,2013)

Nifty-EOD Chart (13-Dec-2013):-
Just click on chart for its enlarged view
Technical Patterns and Formations in EOD charts

1- Bottom formation at 5118.85 on 28-08-2013 and Wave-1 beginning
2- Wave-1(6142.50 on 19-09-2013)
3- Wave-2(5700.95 on 01-10-2013)
4- Wave-i of Wave-3(6342.95 on 03-11-2013)
5- Wave-ii of Wave-3(5972.45 on 13-11-2013)
6- Wave-iii of Wave-3(6415.25 on 09-12-2013)
7- Wave-iv of Wave-3 continuation with recent bottom formation at 6161.40 on 13-12-2013.  

Conclusions from EOD chart analysis 

Corrective Wave-iv of Wave-3 continuation and following supports should be firstly watched for its completion:-

1- 6156
2- 6032
3- 5972

Following retracement levels should also be watched for correction completion:-

13.0%-6357(Retraced)
23.6%-6310(Retraced)
27.0%-6295(Retraced)
38.2%-6245(Retraced)
50.0%-6193(Retraced)
61.8%-6141(Crucial retracement level and just below next supports at 6156)
70.7%-6101
76.4%-6076
78.6%-6066
88.6%-6022

Crucial 61.8% retracement level is at 6141 and  next support is just above at 6156 as well as recent bottom formation at 6161.40 in previous trading session therefore range of 6141-6156 become most crucial strong support and next trend deciding range.

Nifty-Intra Day Chart (13-Dec-2013):-
Just click on chart for its enlarged view
Technical Patterns and Formations in today intraday charts

1- Whole day down moves in Bullish Falling Channels.
3- Whole day actual trading between 6161-6206

Conclusions from intra day chart analysis 

Whole day down moves in Bullish Falling Channels on 13-12-2013 therefore generations of first signal of on going correction completion but follow up consolidation is must in the beginning of next week.

Conclusions (After Putting All Indicators Together)

6141-6156 has become most crucial strong support range and consolidation pattern formation just above it on 13-12-2013 therefore emergence of correction completion possibility near about mentioned range and firstly sustaining beyond this range should be watched in next week for corrective Wave-iv of Wave-3 continuation / completion.

Mid-session Outlook(13-12-2013)

 Correction continuation after gap down opening but in Bullish Falling Channel with recent low formation at 6171 and firstly sustaining beyond next support(6156) will watched for correction continuation / completion because next week will react on following events and market has to prepare for that also:-

1- WPI DATA
2- RBI Credit Policy
3- FOMC meet with fear of tapering

Pre-open Outlook(13-12-2013)

As US markets closed with sufficient losses after negative news of CPI and IIP numbers therefore sentiment is depressed today morning and Gap down opening will be seen. Correction continuation and sustaining beyond next support(6156) should be watched now for correction continuation / completion.

Technical Analysis and Market Outlook(13-12-2013)

Nifty-Intra Day Chart (12-Dec-2013):-
Just click on chart for its enlarged view
Technical Patterns and Formations in today intraday charts

1- More than 5 hours trading between 6254-6270 with consolidation indications.
2- Sharp down in last half hour.
3- Whole day actual trading between 6232-6270

Conclusions from intra day chart analysis 

Although Sharp down in last half hour and closing near the lows of the day despite consolidation indications from intraday charts between 6254-6270. As today down moves were without as such selling therefore sustaining below 6254 should be firstly watched tomorrow for next trend confirmations because Indian and all Global markets were down today on the back of QE-3 tapering fear in FOMC meet in next week.

Pre-closing Outlook(12-12-2013)

Although consolidation indications and emergence of up moves expectations but sharp fall also seen therefore correction continuation and until complete consolidation will not seen till then up moves will not seen because all the Global markets are in Red and fear of tapering in FOMC meet in next week.

Mid-session Outlook(12-12-2013)

Although most time negative zone trading between 6254-6270 but intraday charts are showing consolidation indications and emergence of up moves expectations.

Post-open Outlook(12-12-2013)

As all Asian markets turned negative after Red closing of US markets therefore weak Indian markets and trading below 6280 despite good consolidation above it yesterday. Today down moves are depressed sentiment affected and sustaining below 6280 should be firstly watched for next down moves confirmations.

Technical Analysis and Market Outlook(12-12-2013)

Nifty-Intra Day Chart (11-Dec-2013):-
Just click on chart for its enlarged view
Technical Patterns and Formations in today intraday charts

1- Down moves in Bullish Falling Channel.
2- Consolidation between 6280-6298
3- Whole day actual trading between 6280-6326

Conclusions from intra day chart analysis 

As down moves in Bullish Falling Channel and good consolidation at lower levels therefore until Nifty will not sustain below the lowest of today till next down moves will not be considered. All trends are up but very short term correction continuation after all time high formation on 09-12-2013. As lower levels good consolidations today therefore once sustaining above today lowest(6280) will mean rally continuation after very short term correction completion. 

As US markets are trading in deep Red at this moment therefore sentiment may be weak tomorrow morning and firstly sustaining beyond today lowest(6280) should be watched tomorrow for next trend confirmation but expected that rally will be seen after sustaining above 6280.

Mid-session Outlook(11-12-2013)

All trends are up but very short term correction continuation after all time high formation on 09-12-2013. As lower levels good consolidations today therefore firstly sustaining beyond today lowest(6283) should be watched for next trend confirmation.

Technical Analysis and Market Outlook(11-12-2013)

Nifty-Intra Day Chart (10-Dec-2013):-
Just click on chart for its enlarged view
Technical Patterns and Formations in today intraday charts

1- Selling between 6338-6354 
2- Lower levels supports.
2- Up moves in Bearish Rising Channel.
3- Whole day actual trading between 6308-6362

Conclusions from intra day chart analysis 

All trends are up but sentiment is heated due to all time high formations yesterday and resultant profit booking seen today. As lower levels supports also seen at lower levels therefore mixed positions formation today and sustaining beyond today trading range(6308-6362) should be firstly watched tomorrow for next immediate move confirmations.
As busy in a marriage therefore Outlooks will not be updated today.