6 Hours quiet range bound market after positive news led huge Gap up opening. As today intraday charts are showing consolidation indications therefore rally continuation is expected in the coming sessions.

ॐ ह्रीं श्रीं लक्ष्मीभयो नमः॥

Mid-session Outlook(09-12-2013)
Hugh gap up opening after BJP victory in Assembly elections yesterday and new all time high formation today. Although slipping from higher levels but it is only intraday correction and Wave-3 rally continuation is expected.
Technical Analysis and Market Outlook(09-12-2013)
Nifty-EOD Chart (06-Dec-2013):-
Technical Patterns and Formations in EOD charts
1- Bottom formation at 5118.85 on 28-08-2013 and Wave-1 beginning
2- Wave-1(6142.50 on 19-09-2013)
3- Wave-2(5700.95 on 01-10-2013)
4- Wave-3(6342.95 on 03-11-2013 and 'ABC' correction beginning)
5- Wave-A(5972.45 on 13-11-2013)
6- Wave-B(6212.40 on 19-11-2013)
7- Wave-C(5972.80 on 22-11-2013)
8- Descending Triangle formations in last 23 sessions with top formation at 6342.95 and bottom formation at 5972.45.
Wave-3 continuation after 'ABC' correction completion but Descending Triangle formations in last 23 sessions with top formation at 6342.95 and bottom formation at 5972.45. As last 23 sessions trading were under the shadow of 5 states Assembly polls with both lower levels consolidations and higher levels selling therefore sustaining beyond 5972.45-6342.95 will be next trend confirmations and should be firstly watched in next sessions after BJP big victory in Election results today.
 |
| Just click on chart for its enlarged view |
1- Bottom formation at 5118.85 on 28-08-2013 and Wave-1 beginning
2- Wave-1(6142.50 on 19-09-2013)
3- Wave-2(5700.95 on 01-10-2013)
4- Wave-3(6342.95 on 03-11-2013 and 'ABC' correction beginning)
5- Wave-A(5972.45 on 13-11-2013)
6- Wave-B(6212.40 on 19-11-2013)
7- Wave-C(5972.80 on 22-11-2013)
8- Descending Triangle formations in last 23 sessions with top formation at 6342.95 and bottom formation at 5972.45.
Conclusions from EOD chart analysis
Wave-3 continuation after 'ABC' correction completion but Descending Triangle formations in last 23 sessions with top formation at 6342.95 and bottom formation at 5972.45. As last 23 sessions trading were under the shadow of 5 states Assembly polls with both lower levels consolidations and higher levels selling therefore sustaining beyond 5972.45-6342.95 will be next trend confirmations and should be firstly watched in next sessions after BJP big victory in Election results today.
Mid-session Outlook-2 (06-12-2013)
Quiet sideways market with higher levels selling and lower levels supports also between 6231-6243 and no clear indication from today intraday charts. Next trend confirmation will be after sustaining beyond 6155-6301.
Mid-session Outlook(06-12-2013)
More than 4 hours flat sideways market with selling between 6250-6265 today and view is cautious.
Technical Analysis and Market Outlook(06-12-2013)
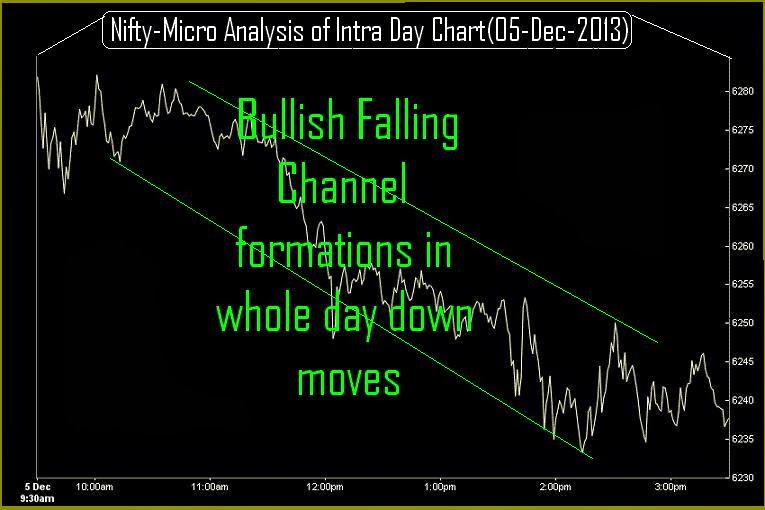
Nifty-Intra Day Chart (05-Dec-2013):-
Technical Patterns and Formations in today intraday charts
1- Bullish Falling Channel formations in whole day down moves.
2- Whole day actual trading between 6232-6300.
As Exit Poll results showed BJP victory will be with good gains on next Sunday and emergence of strong,economic growth oriented Govt.formation possibility after Parliament Election next year under the leadership of Shri Narendra Modi therefore huge gap up opening today. Good selling in previous 3 sessions below 6228 therefore consolidation was required and it was seen today through higher levels continuous down moves in Bullish Falling Channel.
Impulsive Wave-3 is on,all trends are up and Rally continuation towards 6724.60 therefore market showed as such enthusiasm today after first strong signal of stable union Govt. possibility in 2014. As market showed higher levels consolidation after huge gap up opening therefore today started rally continuation is expected in the coming sessions and weeks.
 |
| Just click on chart for its enlarged view |
1- Bullish Falling Channel formations in whole day down moves.
2- Whole day actual trading between 6232-6300.
Conclusions from intra day chart analysis
As Exit Poll results showed BJP victory will be with good gains on next Sunday and emergence of strong,economic growth oriented Govt.formation possibility after Parliament Election next year under the leadership of Shri Narendra Modi therefore huge gap up opening today. Good selling in previous 3 sessions below 6228 therefore consolidation was required and it was seen today through higher levels continuous down moves in Bullish Falling Channel.
Impulsive Wave-3 is on,all trends are up and Rally continuation towards 6724.60 therefore market showed as such enthusiasm today after first strong signal of stable union Govt. possibility in 2014. As market showed higher levels consolidation after huge gap up opening therefore today started rally continuation is expected in the coming sessions and weeks.
Mid-session Outlook-2(05-12-2013)
As Exit Poll results showed BJP victory will be with good gains on next Monday and emergence of strong Govt.formation possibility after Parliament Elections in next year under the leadership of economic growth oriented Prime Minister Modi therefore huge gap up opening today. Good selling in previous 3 sessions below 6228 therefore higher levels consolidation through continuous down moves in Bullish Falling Channel and recent lowest formation at 6232.
As higher levels consolidation seen today therefore today started rally continuation is expected.
Mid-session Outlook(05-12-2013)
Modi factor works and huge gap up opening seen after 1st strong indication of BJP clear victory possibility in 4 states and 2014 Lok Sabha Election from Exit Poll results yesterday. Not only gap up opening but sustaining at higher levels and consolidating also therefore today started rally continuation is expected.
Pre-open Outlook(05-12-2013)
As emergence of BJP clear victory possibility in 4 states from Exit Poll results yesterday therefore higher levels consolidation is possible after strong opening. Sustaining above 6228 should be firstly watched today for next up moves confirmations because good selling seen below it in previous 3 sessions.
Mid-session Outlook-2(04-12-2013)
When Nifty was trading flat at 01:41 PM then we cautioned through following line in previous Outlook:-
Nfty traded 30 points down after slipping from higher levels few minutes before. Next strong support is at 6158 and sustaining below it will mean sharp fall.
higher levels selling in previous 2 sessions and follow up selling today also therefore view is cautious despite now flat trading
Mid-session Outlook(04-12-2013)
Although up moves seen after lower levels supports in first hour but higher levels selling also seen today. As higher levels selling in previous 2 sessions and follow up selling today also therefore view is cautious despite now flat trading after good recovery from lower levels and sustaining above today lowest(6180).
Post-open Outlook(04-12-2013)
As US and European markets closed in Red yesterday and most Asian markets were trading in negative zone therefore sentiment turned dampened today morning and weaker Indian markets since opening today but out performing also and only .25% down while some other Global markets were in Deep Red. Lower levels supports also seen today therefore it is first signal of consolidation and sustaining above today lowest(6180) will mean high possibility of strong markets tomorrow after Exit Poll results in the evening today.
Technical Analysis and Market Outlook(04-12-2013)
Nifty-Intra Day Chart (03-Dec-2013):-
Technical Patterns and Formations in today intraday charts
1- Follow up selling at higher levels.
2- Down moves in Bullish Falling Channel
3- Lower levels supports
3- Whole day actual trading between 6191-6224
As higher levels seen yesterday therefore only selling and down moves were told in all 3 Outlooks of yesterday and most time negative zone trading seen today. Higher levels follow up selling also seen today but down moves in Bullish Falling Channel and lower levels supports also seen therefore mixed trading patterns formations today and sustaining beyond previous 2 sessions trading range(6191-6228) should be firstly watched tomorrow for those next moves confirmations which have already been updated in following topic yesterday.
 |
| Just click on chart for its enlarged view |
1- Follow up selling at higher levels.
2- Down moves in Bullish Falling Channel
3- Lower levels supports
3- Whole day actual trading between 6191-6224
Conclusions from intra day chart analysis
As higher levels seen yesterday therefore only selling and down moves were told in all 3 Outlooks of yesterday and most time negative zone trading seen today. Higher levels follow up selling also seen today but down moves in Bullish Falling Channel and lower levels supports also seen therefore mixed trading patterns formations today and sustaining beyond previous 2 sessions trading range(6191-6228) should be firstly watched tomorrow for those next moves confirmations which have already been updated in following topic yesterday.
Pre-closing Outlook(03-12-2013)
Same views which have already been updated in all 4 previous Outlooks.
Mid-session Outlook(03-12-2013)
Only selling and down moves were told in all 3 previous Outlooks yesterday and most time negative zone trading seen today. As follow up selling seen today therefore very short term correction is expected now.
Technical Analysis and Market Outlook(03-12-2013)
Nifty-Intra Day Chart (02-Dec-2013):-
Technical Patterns and Formations in today intraday charts
1- Selling between 6215-6228
3- Whole day actual trading between 6193-6228
Although closing near the higher levels of the day but today intraday charts are showing higher levels selling therefore some down moves are expected tomorrow. Sustaining beyond today trading range will be next moves first indication and should be firstly watched tomorrow for:-
1- Very Short Term correction below 6193 or
2- Rally continuation above 6228.
 |
| Just click on chart for its enlarged view |
1- Selling between 6215-6228
3- Whole day actual trading between 6193-6228
Conclusions from intra day chart analysis
Although closing near the higher levels of the day but today intraday charts are showing higher levels selling therefore some down moves are expected tomorrow. Sustaining beyond today trading range will be next moves first indication and should be firstly watched tomorrow for:-
1- Very Short Term correction below 6193 or
2- Rally continuation above 6228.
Pre-closing Report(02-12-2013)
Although closing the higher levels of the day but today intraday charts are showing higher levels selling indications therefore sustaining beyond today trading range will be next moves first indication and should be firstly watched tomorrow.
Mid-session Outlook(02-12-2013)
Although now near the higher levels of the day at this moment but today intraday charts are showing selling indications therefore some volatility may be seen between today trading range(6172-6228) and very short term correction will be considered below 6172
Technical Analysis,Research & Weekly Outlook (Dec 02 to Dec 06,2013)
Nifty-EOD Chart (29-Nov-2013):-
Technical Patterns and Formations in EOD charts
1- Bottom formation at 5118.85 on 28-08-2013 and Wave-1 beginning
2- Wave-1(6142.50 on 19-09-2013)
3- Wave-2(5700.95 on 01-10-2013)
4- Wave-3(6342.95 on 03-11-2013 and 'ABC' correction beginning)
5- Wave-A(5972.45 on 13-11-2013)
6- Wave-B(6212.40 on 19-11-2013)
7- Wave-C(5972.80 on 22-11-2013)
8- Double bottom support at 5972 and 'ABC' correction completion.
Conclusions from EOD chart analysis
Wave-3 continuation after 'ABC' correction completion and recent top formation at 6182.50 on 29-11-2013
Nifty-Intra Day Chart (29-Nov-2013):-
Technical Patterns and Formations in today intraday charts
1- More than 1% recovery within first 20 minutes.
2- More than 6 hours trading between 6158-6182.
Conclusions from intra day chart analysis
More than 1% recovery within first 20 minutes after positive opening and after that more than 6 hours range bound trading between 6158-6182 are strong indication of rally continuation because much higher levels trading without selling patterns formations and it will be strong indication of consolidation.
All trends are up and Wave-3 continuation after 'ABC' correction completion and its minimum target is at 6724.60,its calculation has already been updated in following topic link and expected that up moves will begin after fresh consolidation in the coming week / weeks.
Next strong resistance are between 6186-6212 and Nifty traded more than 6 hours with strong indication of consolidation just below it between 6158-6182 on 29-11-2013 therefore high possibility of on going rally continuation. As next resistances are strong therefore follow up consolidation is firstly required in the beginning of next week and once sustaining above 6212 will mean fast rally and new all time high formation in next week / weeks.
For immediate next moves confirmations sustaining beyond 6158-6212 should be firstly watched in the beginning of coming week and once sustaining above 6212 will mean rally continuation towards recent top at 6342.95 and such up moves are expected also in the coming sessions and weeks.
 |
| Just click on chart for its enlarged view |
1- Bottom formation at 5118.85 on 28-08-2013 and Wave-1 beginning
2- Wave-1(6142.50 on 19-09-2013)
3- Wave-2(5700.95 on 01-10-2013)
4- Wave-3(6342.95 on 03-11-2013 and 'ABC' correction beginning)
5- Wave-A(5972.45 on 13-11-2013)
6- Wave-B(6212.40 on 19-11-2013)
7- Wave-C(5972.80 on 22-11-2013)
8- Double bottom support at 5972 and 'ABC' correction completion.
Conclusions from EOD chart analysis
Wave-3 continuation after 'ABC' correction completion and recent top formation at 6182.50 on 29-11-2013
Nifty-Intra Day Chart (29-Nov-2013):-
 |
| Just click on chart for its enlarged view |
1- More than 1% recovery within first 20 minutes.
2- More than 6 hours trading between 6158-6182.
Conclusions from intra day chart analysis
More than 1% recovery within first 20 minutes after positive opening and after that more than 6 hours range bound trading between 6158-6182 are strong indication of rally continuation because much higher levels trading without selling patterns formations and it will be strong indication of consolidation.
Conclusions (After Putting All Indicators Together)
All trends are up and Wave-3 continuation after 'ABC' correction completion and its minimum target is at 6724.60,its calculation has already been updated in following topic link and expected that up moves will begin after fresh consolidation in the coming week / weeks.
Next strong resistance are between 6186-6212 and Nifty traded more than 6 hours with strong indication of consolidation just below it between 6158-6182 on 29-11-2013 therefore high possibility of on going rally continuation. As next resistances are strong therefore follow up consolidation is firstly required in the beginning of next week and once sustaining above 6212 will mean fast rally and new all time high formation in next week / weeks.
For immediate next moves confirmations sustaining beyond 6158-6212 should be firstly watched in the beginning of coming week and once sustaining above 6212 will mean rally continuation towards recent top at 6342.95 and such up moves are expected also in the coming sessions and weeks.
Pre-closing Outlook(29-11-2013)
More than 1% recovery within first 20 minutes and after that most time trading at higher levels between 6160-6182 and sustaining also just below next resistance(6186-6212) as well. As almost 6 hours sustaining at higher levels therefore high possibility of on going rally continuation in next week but next moves confirmation is also firstly required through sustaining beyond 6160-6212 .
Post-open Outlook(29-11-2013)
Following projection were done yesterday in Technical Analysis and Market Outlook(29-11-2013):-
1- impulsive Wave-3 continuation after correction completion.
2- fast up moves towards next strong resistance(6186-6212)
3- Once sustaining above 6212 will mean rally continuation towards recent top at 6342.95
1- impulsive Wave-3 continuation after correction completion.
2- fast up moves towards next strong resistance(6186-6212)
3- Once sustaining above 6212 will mean rally continuation towards recent top at 6342.95
Recent top formation at 6182.40 today after fast up moves immediately after opening and firstly more consolidation is required now because strong resistance(6186-6212) are just above today highest. Only sustaining above 6212 should be watched for fast rally and new all time high formation in next week/weeks.
Technical Analysis and Market Outlook(29-11-2013)
Nifty-Intra Day Chart (28-Nov-2013):-
Technical Patterns and Formations in today intraday charts
1- Higher levels selling.
2- Down moves in Bullish Falling Channel.
3- Strong recovery from lower levels in last half hour.
4- Whole day actual trading between 6070-6112
Although higher levels selling but down moves in Bullish Falling Channel therefore strong recovery from lower levels in last half hour and impulsive Wave-3 continuation after correction completion.
As some selling at higher levels today therefore only only sustaining above today highest should be watched for confirmations because that will mean fast up moves towards next strong resistance(6186-6212). Once sustaining above 6212 will mean rally continuation towards recent top at 6342.95 and such up moves are expected also in the coming sessions and weeks.
As sentiment may be heated tomorrow therefore some intraday volatility after profit booking may be seen and Long positions should be created after completion of intraday corrections.
 |
| Just click on chart for its enlarged view |
1- Higher levels selling.
2- Down moves in Bullish Falling Channel.
3- Strong recovery from lower levels in last half hour.
4- Whole day actual trading between 6070-6112
Conclusions from intra day chart analysis
Although higher levels selling but down moves in Bullish Falling Channel therefore strong recovery from lower levels in last half hour and impulsive Wave-3 continuation after correction completion.
As some selling at higher levels today therefore only only sustaining above today highest should be watched for confirmations because that will mean fast up moves towards next strong resistance(6186-6212). Once sustaining above 6212 will mean rally continuation towards recent top at 6342.95 and such up moves are expected also in the coming sessions and weeks.
As sentiment may be heated tomorrow therefore some intraday volatility after profit booking may be seen and Long positions should be created after completion of intraday corrections.
Technical Analysis and Market Outlook(28-11-2013)
Nifty-Intra Day Chart (27-Nov-2013):-
Technical Patterns and Formations in today intraday charts
1-Down moves in Bullish Falling Channel.
2-Consolidation between 6031-6048
3- Whole day actual trading between -
As firstly down moves in Bullish Falling Channel and after that lower levels consolidation therefore following conclusions are being repeated which were updated in both previous Outlooks yesterday:-
1- emergence of fresh up move expectations.
2- emergence of rally expectations in next derivative month
3- Next crucial and big trend deciding support is at 5972 and expected that Nifty will not sustain below it despite continuous slipping.
 |
| Just click on chart for its enlarged view |
1-Down moves in Bullish Falling Channel.
2-Consolidation between 6031-6048
3- Whole day actual trading between -
Conclusions from intra day chart analysis
As firstly down moves in Bullish Falling Channel and after that lower levels consolidation therefore following conclusions are being repeated which were updated in both previous Outlooks yesterday:-
1- emergence of fresh up move expectations.
2- emergence of rally expectations in next derivative month
3- Next crucial and big trend deciding support is at 5972 and expected that Nifty will not sustain below it despite continuous slipping.
Mid-session Outlook-2(27-11-2013)
Although continuous down yesterday and since opening today but without force therefore consolidation indications and emergence of rally expectations in next derivative month. Next crucial and big trend deciding support is at 5972 and expected that Nifty will not sustain below it despite continuous slipping.
Mid-session Outlook(27-11-2013)
Although continuous down since opening today but without force therefore consolidation indications and emergence of fresh up move expectations.
Technical Analysis and Market Outlook(27-11-2013)
Nifty-Intra Day Chart (26-Nov-2013):-
Technical Patterns and Formations in today intraday charts
1- Down moves with continuous selling patterns formations.
2- Down moves in Bullish Falling Channel.
3- Whole day actual trading between -
Although down moves with continuous selling patterns formations but in Bullish Falling Channel also therefore today intraday charts are not showing any clear pattern. As strong rally with good intraday consolidation yesterday therefore today down moves will be understood an excise for cooling of heated sentiment and a part of consolidation as well.
Impulsive Wave-3 continuation after correction completion and expected that rally will remain continued in the coming sessions but next strong resistances are between 6186-6212 therefore coming 2/3 sessions may remain sideways between between 5972-6212 and rally may be seen in next derivative month.
 |
| Just click on chart for its enlarged view |
1- Down moves with continuous selling patterns formations.
2- Down moves in Bullish Falling Channel.
3- Whole day actual trading between -
Conclusions from intra day chart analysis
Although down moves with continuous selling patterns formations but in Bullish Falling Channel also therefore today intraday charts are not showing any clear pattern. As strong rally with good intraday consolidation yesterday therefore today down moves will be understood an excise for cooling of heated sentiment and a part of consolidation as well.
Impulsive Wave-3 continuation after correction completion and expected that rally will remain continued in the coming sessions but next strong resistances are between 6186-6212 therefore coming 2/3 sessions may remain sideways between between 5972-6212 and rally may be seen in next derivative month.
Expected that Nifty will firstly prepare for next moves between 6058-6123 and sustaining beyond this range will be next immediate moves confirmation but high possibility of rally continuation above 6123.
Pre-open Outlook(26-11-2013)
As US markets closed flat after slipping from intraday higher levels therefore sentiment is little dampened and all the Asian markets are flat to weak today morning,resultant negative zone opening is expected in Indian markets. Impulsive Wave-3 begun after correction completion yesterday therefore expected that rally will remain continued in the coming sessions but next strong resistances are between 6186-6212 therefore coming 2/3 sessions may remain sideways between between 5972-6212 and rally may be seen in next derivative month.
Expected that Nifty will firstly prepare for next moves between 6058-6123 today and sustaining beyond this range will be next immediate moves confirmation.
Technical Analysis and Market Outlook(26-11-2013)
Nifty-Intra Day Chart (25-Nov-2013):-
Technical Patterns and Formations in today intraday charts
1- Fast up moves immediately after strong opening.
2- More than 3 hours down moves in Bullish Falling Channels.
3- Strong up moves in last 2 hours.
4- Whole day actual trading between 6035-6123
As selling between 6028-6061 in last 2 sessions therefore firstly more than 3 hours consolidation though down moves from higher levels in Bullish Falling Channels and after that strong rally in last 2 hours as well as confirmation of impulsive Wave-3 continuation after correction completion. Expected that today started rally will remain continued in the coming sessions.
 |
| Just click on chart for its enlarged view |
1- Fast up moves immediately after strong opening.
2- More than 3 hours down moves in Bullish Falling Channels.
3- Strong up moves in last 2 hours.
4- Whole day actual trading between 6035-6123
Conclusions from intra day chart analysis
As selling between 6028-6061 in last 2 sessions therefore firstly more than 3 hours consolidation though down moves from higher levels in Bullish Falling Channels and after that strong rally in last 2 hours as well as confirmation of impulsive Wave-3 continuation after correction completion. Expected that today started rally will remain continued in the coming sessions.
Next strong resistance is between 6186-6212 and once sustaining above it will mean up moves towards recent top at 6342.95 as well as such up moves are expected also in the coming sessions and weeks.
Mid-session Outlook-2(25-11-2013)
As higher levels selling between 6028-6061 in last 2 sessions therefore Nifty could not sustain above 6061 and consolidated through continuously slipping from 6095 to 6058. Higher levels good consolidation today and impulsive Wave-3 continuation after strong signals of correction completion.
Mid-session Outlook(25-11-2013)
Almost 2 hours trading above next resistance range(6061) and strong indication of sustaining above it also. As today rally is strong Global cues led therefore confirmation is also must and that will mean confirmation of Wave-3 towards 6724.60.
Pre-open Outlook(25-11-2013)
Dow's Futures is more than 50 points up today morning after positive closing last Friday therefore sentiment is good today morning and all the Asian markets are positive as well as some are trading with good gains resultant positive opening will be seen in Indian markets. Lower levels minor supports(5972) on 22-11-2013 therefore sustaining beyond it should be firstly watched today and sustaining above 6061 will be correction completion confirmation.
Technical Analysis,Research & Weekly Outlook
(Nov 25 to Nov 29,2013)
Nifty-EOD Chart (22-Nov-2013):- |
| Just click on chart for its enlarged view |
1- 4531.15 on 20-12-2011(Rally beginning after 13 Months correction completion)
2- Wave-1(5629.95 on 22-02-2012)
3- Wave-2(4770.35 on 04-06-2012)
4- Wave-3(6111.80 on 29-01-2013)
5- Wave-4(5477.20 on 10-04-2012)
6- Wave-5(6229.45 on 20-05-2013)('ABC'Correction beginning after 17 Months Rally completion)
7- Wave-A(5566.25 on 24-06-2013)
8- Wave-B(6093.35 on 23-07-2013)
9- Wave-C(5118.85 on 28-08-2013)(Wave-1 beginning after'ABC'Correction completion)
10- Wave-1(6142.50 on 19-09-2013)
11- Wave-2(5700.95 on 01-10-2013)
12- Wave-3(Recent top formation at 6342.95 on 03-11-2013 and correction continuation)
Conclusions from EOD chart analysis
Although Wave-3 correction continuation but Wave-3 minimum target is at 6724.60,its calculation has already been updated in following topic link and expected that up moves will begin after fresh consolidation and on going correction completion in the coming week/weeks.
(Just click above topic link and understand the calculation of 6724.60)
Nifty-EOD Chart (22-Nov-2013):-
 |
| Just click on chart for its enlarged view |
1- Bottom formation at 5118.85 on 28-08-2013 and Wave-1 beginning
2- Wave-1(6142.50 on 19-09-2013)
3- Wave-2(5700.95 on 01-10-2013)
4- Wave-3(Recent top formation at 6342.95 on 03-11-2013 and 'ABC'correction continuation)
5- Wave-A(5972.45 on 13-11-2013)
6- Wave-B(6212.40 on 19-11-2013)
7- Wave-C(Recent bottom formation at 5972.80 on 22-11-2013)
8- Falling Trend line support.
Conclusions from EOD chart analysis
corrective Wave-C of 'ABC' continuation and and its 100% correction of Wave-A can not be ruled out therefore this levels is being updated as follows:-
Wave-A lost 379.50 points=6342.95(Recent top)-5972.45(Wave-A bottom)
5841.90(100% correction level)=6212.40(Wave-B top)-379.50(100% of Wave-A)
Technically Wave-C of 'ABC' may correct up to 5841.90.
Nifty-Intra Day Chart (Nov 21 & Nov 22,2013):-
 |
| Just click on chart for its enlarged view |
1- Selling between 6045-6061 on 21-11-2013.
2- Follow up elling between 6028-6050 on 22-11-2013.
3- Down moves in Bullish Falling Channels in both sessions.
4- Up moves in Bearish Rising Channel on 22-11-2013.
5- Lower levels minor supports on 22-11-2013.
Conclusions from 2 Sessions intra day chart analysis
Although lower levels minor supports on 22-11-2013 and down moves in Bullish Falling Channels in both sessions but higher levels good selling in both previous sessions and up moves in Bearish Rising Channel also seen therefore both previous sessions are showing mixed patterns. As good selling at higher levels in both previous sessions and as such good consolidation not seen therefore possibility of some more down moves in the coming week and until Nifty will not sustain above 6061 till then next up moves will not be considered.
Conclusions (After Putting All Indicators Together)
Wave-C of 'ABC' correction continuation and complete consolidation with strong supports formation not seen yet therefore firstly some more down moves can not be ruled. Complete consolidation is required for correction completion and until it will not happen till then decisive up moves will not be seen.
"Immediate supports are at 5980 and immediate resistance is at 6061 therefore sustaining beyond 5980-6061 should be watched for correction continuation minimum up to 5841.90 after sustaining below 5980. As lower levels minor supports on 22-11-2013 therefore sustaining beyond it should be firstly watched in the beginning of next week for the mentioned length of on going correction.
Mid-session Outlook(22-11-2013)
Following conclusions were told in both previous Outlooks:-
"Immediate supports are at 5980 and immediate resistance is at 6075 therefore sustaining beyond 5980-6075 should be watched for correction continuation/completion"
Correction continuation and complete consolidation is required for its completion. Nify traded between 6004-6049 with lower levels supports and higher levels selling today therefore break out of this range will be 1st indication and sustaining beyond 5980-6075 will be confirmation of those moves which have already been updated in previous Outlook.
Technical Analysis and Market Outlook(22-11-2013)
Nifty-Intra Day Chart (21-Nov-2013):-
Technical Patterns and Formations in today intraday charts
1- Selling between 6045-6060
2- Down moves in Bullish Falling Channels
3- Whole day actual trading between 5987-6081
As minutes from the latest Federal Reserve meeting revealed that US central bank may cut back its bond-buying programme even if the job market doesn't improve dramatically therefore sentiment depressed and most Global markets turned weak and resultant huge gap down opening and whole day down moves seen in Indian markets. Although higher levels selling patterns formations but Down moves were in Bullish Falling Channels therefore intraday mixed patterns formations and follow up moves within immediate supports(5980) and immediate resistance(6075) should be firstly watched tomorrow for next trend confirmations.
Correction continuation and firstly sustaining beyond 5980-6075 should be watched tomorrow for:-
1- Deeper correction continuation below 5980 or
2- 1st signal of correction completion above 6075.
 |
| Just click on chart for its enlarged view |
1- Selling between 6045-6060
2- Down moves in Bullish Falling Channels
3- Whole day actual trading between 5987-6081
Conclusions from intra day chart analysis
As minutes from the latest Federal Reserve meeting revealed that US central bank may cut back its bond-buying programme even if the job market doesn't improve dramatically therefore sentiment depressed and most Global markets turned weak and resultant huge gap down opening and whole day down moves seen in Indian markets. Although higher levels selling patterns formations but Down moves were in Bullish Falling Channels therefore intraday mixed patterns formations and follow up moves within immediate supports(5980) and immediate resistance(6075) should be firstly watched tomorrow for next trend confirmations.
Correction continuation and firstly sustaining beyond 5980-6075 should be watched tomorrow for:-
1- Deeper correction continuation below 5980 or
2- 1st signal of correction completion above 6075.
Pre-closing Outlook(21-11-2013)
Although Nifty traded at 6025.10 today but when was trading at 6212 on 19-11-2013 and was 21 points up then following lines were told at 10:41 AM in Post-open Outlook(19-11-2013):-
Although Nifty closed 14 points up on 19-11-2013 but we were Bearish and posted following topic at 11:27 PM on 19-11-2013:-
Although Nifty traded 123 points down at 6025.10 today but we were Bearish well before and told for "selling and correction" in all the previous 7 Outlooks.
Nifty is now trading 21 points up but emergence of selling signals and very Short Term correction confirmation will be valid break down below 6187.
Although Nifty closed 14 points up on 19-11-2013 but we were Bearish and posted following topic at 11:27 PM on 19-11-2013:-
Although Nifty traded 123 points down at 6025.10 today but we were Bearish well before and told for "selling and correction" in all the previous 7 Outlooks.
correction continuation and as such no confirmation of its completion yet. Immediate supports are at 5980 and immediate resistance is at 6075 therefore sustaining beyond 5980-6075 should be watched for correction continuation/completion.
Mid-session Outlook(21-11-2013)
Some recovery from lower levels but immediate resistance is at 6075 and sustaining above it will be 1st indication of up move therefore should be firstly watched today for first signal any up move.
Post-open Outlook(21-11-2013)
Sentiment depressed after minutes from the latest Federal Reserve meeting which showed the central bank could cut back on its bond-buying program even if the job market doesn't improve dramatically therefore most Global markets are weak and resultant huge gap down opening in Indian markets.
As correction begun after good selling in last 2 sessions and next support broken(6131-6139) down confirmation also therefore weakness will remain continued and until complete consolidation will not happen till then correction will remain continued.
As correction begun after good selling in last 2 sessions and next support broken(6131-6139) down confirmation also therefore weakness will remain continued and until complete consolidation will not happen till then correction will remain continued.
Live Proofs of Profits,Perfect Timing and the Best Services of Indian Stock Markets to Our Paid Clients

When Nifty was trading near the highest of the day on 19-11-2013 then we were Bearish and bought NIFTY-Nov PE(6200) at 46.50 and when Nifty was trading near the Mid Session lowest on 20-11-2013 then we booked profit at 64.00. Following SMS were sent to paid Clients:-
1- At 01:58 PM on 19-11-2013- NIFTY-Nov PE(6200)-Buy-Positional-SL-29 & TGT-74-CMP-46.50(Lal it39)
2- At 11:08 AM on 20-11-2013- NIFTY-Nov PE(6200)-Bought on 19-11-2013-Cover and book profit immediately-CMP-64(L alit39)
As we always talk with those proofs which no one can deny therefore updating following picture of above SMS sent to our paid clients:-
1st Website Picture(Trading message):-
 |
| Just click on above picture for enlarged view of those SMS which were sent to paid clients |
 |
| Just click on above picture for enlarged view of those SMS which were sent to paid clients |
 |
| Just click on above picture for enlarged view of those SMS which were sent to paid clients |
 |
| Just click on above picture for enlarged view of those SMS which were sent to paid clients |
Only 2 following information are deleted in above SMS Picture due to official secrecy rules:-
1- Numbers of sent SMS.
2- SMS sending Website name.
We always send 2 SMS for each and every call and also always send 2 covering SMS with those fastest SMS Websites which delivers SMS within 15 seconds. Wherever Our clients are moving they need not to watch market and just have to keep Mobile in their pocket because in any condition minimum 1 SMS will be delivered and our clients will be able to trade and cover without any delay.
We always talk with only those proofs which no one can deny therefore live proofs have been updated and even though if anyone has any doubt then may call us and then he will be given the Mobile Numbers of those who enjoyed profits from any part in India.
Technical Analysis and Market Outlook(21-11-2013)
Nifty-Intra Day Chart (Nov 20 & Nov 21,2013):-
Technical Patterns and Formations in last 2 Sessions intraday charts
1- Good selling between 6200-6212 on 19-11-2013.
2- Up moves after double bottom supports on 20-11-2013.
3- Follow up selling at intraday higher levels between 6186-6203 on 20-11-2013.
4- Fast down moves after 2 sessions selling 6186-6212
5- 2 Sessions actual trading between 6129-6212
Very Short Term Correction was told in all the Outlooks of last 2 sessions and it was seen today. As firstly good selling yesterday and follow up selling today after double bottom supports therefore fast down moves seen in last half hour.
2 Sessions good selling between 6186-6212 and until Nifty will not sustain above above 6212 till then next up moves will not be considered and complete consolidation is required for decisive up moves because next supports(6131-6139) range broken down today and sustaining beyond 6131 should be firstly watched tomorrow for the confirmation of:-
1- Deeper correction below 6131.
2- Correction completion above 6131.
 |
| Just click on chart for its enlarged view |
1- Good selling between 6200-6212 on 19-11-2013.
2- Up moves after double bottom supports on 20-11-2013.
3- Follow up selling at intraday higher levels between 6186-6203 on 20-11-2013.
4- Fast down moves after 2 sessions selling 6186-6212
5- 2 Sessions actual trading between 6129-6212
Conclusions from 2 Sessions intra day chart analysis
Very Short Term Correction was told in all the Outlooks of last 2 sessions and it was seen today. As firstly good selling yesterday and follow up selling today after double bottom supports therefore fast down moves seen in last half hour.
2 Sessions good selling between 6186-6212 and until Nifty will not sustain above above 6212 till then next up moves will not be considered and complete consolidation is required for decisive up moves because next supports(6131-6139) range broken down today and sustaining beyond 6131 should be firstly watched tomorrow for the confirmation of:-
1- Deeper correction below 6131.
2- Correction completion above 6131.
Pre-closing Outlook(20-11-2013)
Good recovery after lower levels double bottom supports but 2 hours follow up selling near about yesterday selling range therefore until Nifty will not sustain above yesterday highest till then next up moves will not be considered and complete consolidation is required for decisive up moves because next supports(6131-6139) range broken down today. For technical reasons of today correction just click following topic link which was posted yesterday:-
Mid-session Outlook(20-11-2013)
As soon as selling developed yesterday then we updated it yesterday at 10:41 AM in Post-open Outlook(19-11-2013) and repeated selling in all the Outlooks with very Short Term correction possibility. As was predicted and projected yesterday,100% same happened today and Nifty traded 40 points down with recent lowest formation at 6163.50 today.
Very Short Term correction continuation since opening today but without as such selling patterns formations and double bottom formation also at lower levels therefore firstly valid break down of 6163.50 should be watched for correction continuation/completion because only very Short Term correction was expected.
Very Short Term correction continuation since opening today but without as such selling patterns formations and double bottom formation also at lower levels therefore firstly valid break down of 6163.50 should be watched for correction continuation/completion because only very Short Term correction was expected.
We bought at NIFTY-Nov PE(6200) at 46.50 yesterday when Nifty was trading near the highest of the day and covered today at 64.00 when Nifty was trading near the lowest of the day. Live proofs of such perfect timings will be updated after trading hours today.
Very Short Term Correction on Cards
Technical Analysis and Market Outlook
(20-11-2013)
Nifty-Intra Day Chart (19-Nov-2013):-Technical Analysis and Market Outlook
(20-11-2013)
 |
| Just click on chart for its enlarged view |
1- Good selling at higher level between 6200-6212
2- Whole day actual trading between 6181-6212
Conclusions from intra day chart analysis
As good selling at higher level therefore some down moves and slipping below today lowest(6181) is expected tomorrow despite today closing near the higher levels of today. All trends are up and implusive Wave-3 continuation but very Short Term correction is possible tomorrow because good selling today. Follow up moves and sustaining beyond next supports(6131-6139) should be watched for:-
1- Deeper correction after sustaining below 6131 or
2- Correction completion after sustaining above 6139
Range bound market is expected between 6131-6212 in the coming sessions and sustaining beyond this range will firstly decide the size of expected very Short Term correction on 20-11-2013.
Pre-closing Outlook(19-11-2013)
Following line was told today in Pre-open Outlook:-
firstly sideways market will be seen.
As was told 100% same happened and first 5 hours sideways trading seen within 31 points between 6181-6212 today with higher levels selling patterns formations.
firstly sideways market will be seen.
As was told 100% same happened and first 5 hours sideways trading seen within 31 points between 6181-6212 today with higher levels selling patterns formations.
Mid-session Outlook(19-11-2013)
Although Nifty has moved into Red but when was 21 points up then following lines were told in previous Outlook:-
1- emergence of selling signals
2- very Short Term correction confirmation will be valid break down below 6187
Following line was told today in Pre-open Outlook:-
firstly sideways market will be seen.
More than first 2 hours Sideways market between 6187-6212 today with emergence of selling signals also therefore follow up moves in next hours will be firstly watched today and sustaining beyond today trading range will be confirmation of rally continuation or minimum Very Short Term correction.
Post-open Outlook(19-11-2013)
Although Nifty is now trading 21 points up but emergence of selling signals and very Short Term correction confirmation will be valid break down below 6187.
Pre-open Outlook(19-11-2013)
Strong rally yesterday after good consolidations between 6131-6139 and closing near the highest of the day but very Short Term indicators are over bought and sentiment is heated today morning therefore firstly sideways market will be seen. As complete selling is must for any decisive down moves and as such no selling seen till yesterday therefore Outlook will remain Bullish and only minor intraday down moves will be considered for cooling down of sentiment but sustaining below 6131 not expected.
Expected that finally on going rally will remain continued after minor intraday correction and follow up consolidations.
(As busy in a marriage therefore detailed Technical Analysis has not been updated today but Mid-session Outlooks will be posted)
Expected that finally on going rally will remain continued after minor intraday correction and follow up consolidations.
(As busy in a marriage therefore detailed Technical Analysis has not been updated today but Mid-session Outlooks will be posted)
Pre-closing Outlook(18-11-2013)
Following line was told today in previous Outlook:-
Impulsive Wave-3 is on after correction completion and its continuation is expected.
finally rally continuation is expected after follow up consolidations between 6131-6157.
As was told 100% same happened and now Nifty formed recent high at 6174.45.
Impulsive Wave-3 is on after correction completion and its continuation is expected.
Mid-session Outlook(18-11-2013)
Side ways market today between between 6131-6157 with good consolidations between 6131-6139 and minor selling indications between 6151-6157 therefore sustaining beyond 6131-6157 will be next immediate move confirmations but finally rally continuation is expected after follow up consolidations between 6131-6157.
Subscribe to:
Posts (Atom)