Nifty new life time top formation
under the leadership of Modi ji's
strongest Indian Government
in whole world
Technical Analysis,Research & Weekly
Outlook(Nov 14 to Nov 18,2022)
Nifty-EOD Chart Analysis
(Waves structure)
Nifty-EOD Chart (11-Nov-2022):-

Technical Patterns and Formations in EOD charts
1- Corrective Wave-C completion and Impulsive Wave-1 beginning from 7511.10 on 24-03-2020.
2- Impulsive Wave-1 completion at 11794.30 on 31-08-2020.
3- Corrective Wave-2 completion at 10790.20 on 24-09-2020.
4- Impulsive Wave-3 completion at 15431.8 on 16-02-2021.
5- Corrective Wave-4 completion at 14151.4 on 22-04-2021.
6- Impulsive Wave-5 completion after new life time top formation at 18604.50 on 19-10-2021 and corrective Wave-A of "ABC" correction beginning with Double Zig-Zag pattern formation.
7- Wave-A completion at 16410.20 on 20-12-2021.
8- Wave-B completion at 18351.00 on 18-01-2022.
9- Wave-C bottom formation at 15671.5 on 08-03-2022.
10- Wave-X completion at 18114.70 on 04-04-2022.
11- Wave-A completion at 15735.80 on 12-05-2021.
12- Wave-B completion at 16793.80 on 03-06-2022.
13- Wave-C completion at 15183.4 on 17-06-2022.
14- Wave-X continuation with recent top formation at 18362.30 on 11-11-2022.
15- More than 1 year "ABC" correction continuation with Double Zig-Zag pattern formation
Conclusions from EOD chart analysis
(Waves structure)
A new structure started from 7511.10 on 24-03-2020 through its Impulsive Wave-1 which was completed after its impulsive Wave-5 life time top formation at 18604.50 on 19-10-2021. On going Waves structure gained 11093.4 points in almost 21 months and after this "ABC" correction with Double Zig-Zag pattern formation begun which is in continuation for the last more than 12 months after correcting 30.84%,loosing 3421.1 points and bottom formation at 15183.4 on 17-06-2022. It means that there are strong signals of Price wise and Time wise correction completion in sideways market between 15183.4-18604.50.
Now Wave-X continuation with recent top formation at 18362.30 on 11-11-2022 which is above previous highest(18351.00 on 18-01-20220) of on going "ABC" correction. Wave-X has gained 3178.9 points in the last more than 4 months and remained only 242.2 points shorter than previous life time top at 18604.50 as well as on EOD charts no indication of Wave-X Bullish rally completion.
Nifty-EOD Chart Analysis
(Stochastic & MACD)
Nifty-EOD Chart (11-Nov-2022):-

Technical Patterns and Formations in EOD charts
1- Wave-X continuation with recent top formation at 18362.30 on 11-11-2022.
2- Stochastic- %K(5) line has intersected %D(3) line downward and its both lines are falling below Over bought zone.
3- Stochastic:- %K(5)- 58.64 & %D(3)- 61.78.
4- Stochastic is showing negative divergence.
5- In MACD- MACD line has intersected Average line upward and its both lines are rising in positive zone.
6- MACD(26,12)- 445.35 & EXP(9)- 410.22 & Divergence- 35.13
Conclusions from EOD chart analysis
(Stochastic & MACD)
Although Wave-X forcefully continuation but Short Term Indicators are showing Short Term correction beginning signals in following manner:-
1- In Stochastic indicator %K(5) line has intersected %D(3) line downward and its both lines are falling below Over bought zone as well as this indicator is clearly showing negative divergence therefore strongly suggesting that Short Term Correction is on cards which may start any day in the coming week/weeks.
2- In MACD its MACD line has intersected Average line upward and its both lines are rising in positive zone also but its MACD line has almost flattened and Divergence between both lines has been narrowed down to only 35.13 therefore showing first signal of Short Term Correction beginning.
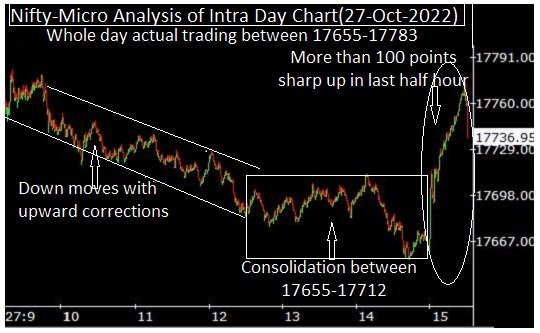
Nifty-Intra Day Chart Analysis
(11-Nov-2022)
Nifty-Intra Day Chart (11-Nov-2022):-

Technical Patterns formation in today intraday charts
1- Consolidation between 18279-18327
2- Up moves with downward corrections
3- Whole day actual trading between 18260-18362
Conclusions from intra day
chart analysis
AS firstly huge gap up opening and after that consolidation between 18279-18327 as well as last 3 hours up moves with downward corrections therefore whole day good intraday consolidation will be understood and on going rally continuation will be expected above last Friday highest(18362). Let Nifty to sustain above it in the beginning of next week then decisive up moves will be seen towards/above life time highest(18604.50) in the coming week/weeks.
Conclusions
(After putting all studies together)
All the trends are up. Wave-X continuation with recent top and new highest of on going "ABC" correction formation at 18362.30 on 11-11-2022 as well as no indication of its completion yet on EOD and intraday charts.
As sentiment is too much heated and Short Term indicators are also suggesting high possibility of Short Term Correction beginning therefore following next supports should also be firstly watched after correction starting confirmations:-
1- 18279-18327
2- 17970-18012
3- 17938-17964
4- 17724-17765
5- 17655-17712
As Indian economy has shown extreme strength under the leadership of Modi ji's strongest Indian Government in whole world during and after Covid-19 period therefore Indian Stock markets out performed all the Global Stock markets hence sharp rally will be seen after Nifty new life time top formation above 18604.50. Once Nifty moving above 18604.50 will mean:-
1- New Wave structure beginning.
2- Wave-X converting into Wave-1 of new Wave structure.
3- Wave-1 of new Wave structure beginning will be understood from 15183.4 on 17-06-2022.