ॐ ह्रीं श्रीं लक्ष्मीभयो नमः॥


Trading "calls" from our "Software" with more than "90% accuracy"

More than "12 years" old "only site of whole world" 
with more than "9700 accurate Outlooks" of 
"Indian Stock Markets" 
Watch supports & resistances also amid Russia-Ukraine war led
 violent volatility
Technical Analysis,Research & Weekly Outlook
(Feb 28 to Mar 04,2022)

Live Proofs of our accurate & profitable Indian Stock Markets Predictions

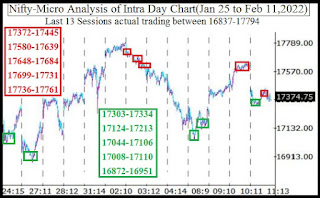
Following topic was posted in previous week Outlook on 19-02-2022:- 


As was told 100% same happened and "Nifty crashed more than 1000 Points" in first 4 sessions of previous week

Nifty-EOD Chart Analysis
(Waves structure)
Nifty-EOD Chart (24-Feb-2022):-
Technical Patterns and Formations in EOD charts

1- Corrective Wave-C completion and Impulsive Wave-1 beginning from 7511.10 on 24-03-2020  
2- Impulsive Wave-1 completion at 11794.30 on 31-08-2020  
3- Corrective Wave-2 completion at 10790.20 on 24-09-2020
4- Impulsive Wave-3 completion at 15431.8 on 16-02-2021
5- Corrective Wave-4 completion at 14151.4 on 22-04-2021
6- Impulsive Wave-5 completion after new life time top formation at 18604.50 on 19-10-2021 and corrective Wave-A of "ABC' correction beginning.
7- Correction continuation with recent bottom formation at 16203.3 on 24-02-2022 

Conclusions from EOD chart analysis(Waves structure)

Waves structure which begun through its Impulsive Wave-1 starting from 7511.10 on 24-03-2020 completed at 18604.50 on 19-10-2021 after its Impulsive Wave-5 completion and Corrective Wave-A of "ABC" correction beginning. Now corrective Wave-C of "ABC' correction continuation with recent bottom formation at 16203.3 on 24-02-2022 and no confirmation of its completion yet.

Nifty-EOD Chart Analysis
(Corrective Waves)
Nifty-EOD Chart (24-Feb-2022):-
Technical Patterns and Formations in EOD charts

1- Impulsive Wave-5 completion after new life time top formation at 18604.50 on 19-10-2021 and corrective Wave-A of "ABC' correction beginning.
2- Corrective Wave-A completion at 16410.20 on 20-12-2021
3- Wave-B completion at 18351.00 on 18-01-2022.
4- Wave-C continuation with recent bottom formation at 16203.3 on 24-02-2022

Conclusions from EOD chart analysis
(Corrective Waves)

Corrective Wave-A of "ABC" correction which started from 18604.50 on 19-10-2021 completed at 16410.20 on 20-12-2021 and Wave-B begun. Wave-C begun after Wave-B completion at 18351.00 on 18-01-2022 and now in continuation with its recent bottom formation at 16203.3 on 24-02-2022 and no confirmation of its completion yet on EOD charts.

Nifty-EOD Chart Analysis
(Averages)
Nifty-EOD Chart (24-Feb-2022):-
Technical Patterns and Formations in EOD charts

A- 5-Day SMA is today at 16853 
B- 21-Day SMA is today at 17246
C- 55-Day SMA is today at 17405
D- 100-Day SMA is today at 17577
E- 200-Day SMA is today at 16903

Conclusions from EOD chart analysis
(Averages)

Simple Moving Averages(SMA) are suggesting that weakness is deepening In Indian markets because 5-Day SMA and last Friday closing was below Long Term trend decider 200-Day SMA as well as all Short to Intermediate Term decider Averages(SMA) have started to move downward which is also a strong signal of weakness.

Conclusions (After putting all studies together)

All the trends have turned down during on going "ABC' correction and no confirmation of its completion yet on EOD charts. 

Russia-Ukraine war led huge volatility was seen in previous week and it will remain continued in next week also according to the length and size  of Geo-Political tension. As Long Term Trend is at stake after last 2 sessions below it closing therefore firstly sustaining beyond it should be watched in the coming week/weeks for next trend formation confirmation and final moves Indian markets accordingly.

As violent volatility may be seen in all the Global and Indian markets according to Russia-Ukraine war news flow therefore sustaining beyond following supports and resistances should also be watched for next decisive moves beginning confirmations.

Immediate resistances are as follows:-

A- 17156-17220
B- 17290-17417
C- 17580-17639 
D- 17648-17684
E- 17699-17731  
F- 17736-17761

Immediate supports are as follows:-

A- 16633-16676
B- 16558-16602
C- 16361-16396
D- 16218-16279
 As busy therefore Stock Market Outlook of today(25-02-2022) is not being updated.
Watch levels for confirmation amid deeper correction beginning possibility
Nifty-Intra Day Chart Analysis &
Market Outlook(24-02-2022)
Nifty-Intra Day Chart (23-Feb-2022):-
Technical Patterns formation in today intraday charts

1- Selling between 17156-17220
2- Sharp fall in last hour
3- Whole day actual trading between 17028-17220

Conclusions from intra day chart analysis 

Although firstly up moves after positive opening but good selling between 17156-17220 therefore sharp fall in last hour. Technical positions of last 6 sessions are as follows:-

1- Consolidation between 16844-16981 on 22-02-2022.
2- Good selling above 17156 in 5 sessions of last 6 sessions 

Expected that Nifty will firstly trade and prepare for next decisive moves betwen 16844-17156 tomorrow and closing is also expected within this range because good strong consolidation was seen above it on 22-02-2022

As good selling above 17156 therefore Nitfy will not sustain above it and once sustaining below 16844 after complete fresh selling will mean strong signal of deeper correction beginning.
 for confirmation

Just watch above mentioned levels for confirmation in the coming 2/3 sessions amid deeper correction beginning possibility
 Up moves towards next resistances
Nifty-Intra Day Chart Analysis & 
Market Outlook(23-02-2022)
Nifty-Intra Day Chart (22-Feb-2022):-
Technical Patterns formation in today intraday charts

1- 362 Points sharp fall in first 25 minutes
2- Consolidation between 16844-16981(immediate supports)
3- Sharp up
4- Sideways trading between 17062-17148 in last 2 hours
5- Whole day actual trading between 16844-17148

Conclusions from intra day chart analysis 

Although firstly 362 Points sharp fall in first 25 minutes but after that good Consolidation between 16844-16981 therefore sharp up moves were seen in Mid-session which will remain continued in the coming session also towards next resistances between 17290-17351.
 Correction towards & below
 next supports
Nifty-Intra Day Chart Analysis & 
Market Outlook(22-02-2022)
Nifty-Intra Day Chart (21-Feb-2022):-
Technical Patterns formation in today intraday charts

1- 205 Points sharp fall in first 25 minutes
2- Slow up moves from lower levels 
3- Selling between 17290-17351(immediate Resistances)
4- Down moves with upward corrections
5- Whole day actual trading between 17071-17351

Conclusions from intra day chart analysis 

Following lines were told on 19-02-2022 in "Sharp fall & deeper correction on cards":-

1- Averages are suggesting that deeper correction is on cards
2- firstly down moves will be seen in the beginning of next week towards the lowest of last 3 sessions(17220)
3- firstly down moves will be seen towards and below the lowest(17220) of last 3 sessions

As was told 100% same happened and Nifty crashed 205 Points sharp fall in first 25 minutes as well as closed below the lowest of last 3 sessions(17220) on 21-02-2022.

As whole day good selling on 21-02-2022 therefore correction will be seen in the coming sessions towards and below those next supports which have already been updated on 19-02-2022 in "Sharp fall & deeper correction on cards".
 Sharp fall & deeper correction
 on cards
Technical Analysis,Research & Weekly Outlook
(Feb 21 to Feb 25,2022)
Nifty-EOD Chart Analysis
(Averages)
Nifty-EOD Chart (18-Feb-2022):-
Technical Patterns and Formations in EOD charts

1- 5-Day SMA is today at 17219
2- 21-Day SMA is today at 17371
3- 55-Day SMA is today at 17442
4- 100-Day SMA is today at 17617
5- 200-Day SMA is today at 16851

Conclusions from EOD chart analysis
(Averages)

Averages are suggesting that deeper correction is on cards because all the Short Term Averages have moved below Intermediate Term Averages and Nifty closed little above 5-Day SMA(17219) at 17276.30 after intraday lowest(17219.20) formation exactly on it. 

Although Long Term Average is still up but at stake because intraday lowest formation on 14-02-2022 was below it at 16809.70.  

Nifty-EOD Chart Analysis
(Stochastic & MACD)
Nifty-EOD Chart (18-Feb-2022):-
Technical Patterns and Formations in EOD charts

1- Impulsive Wave-5 completion after new life time top formation at 18604.50 on 19-10-2021 and corrective Wave-A of "ABC' correction beginning.
2- Corrective Wave-A of "ABC" correction completion at 16410.20 on 20-12-2021
3- Wave-B completion at 18351.00 on 18-01-2022 and and Wave-C beginning
4- Wave-C continuation with recent bottom formation at 16809.7 on 14-02-2022
5- Last 20 Sessions sideways trading between 16810-17794  
6- Stochastic- %K(5) line has intersected %D(3) line upward and its both lines are rising towards Over bought zone.
7- Stochastic:- %K(5)- 66.62 & %D(3)- 50.67.
8- In MACD- Both lines are kissing.
9- MACD(26,12)- -200.00 & EXP(9)- -238.89 & Divergence- 38.89

Conclusions from EOD chart analysis
(Stochastic & MACD)

Although in Stochastic  both lines are rising  towards Over bought zone after %K(5) line upward intersection of %D(3) line but such type of upward and downward intersection is being seen after little up and down moves for the last 20 sessions therefore Price action and trading range break out should be firstly watched in next week for next Short Term Trend formation confirmations.

As in MACD both lines are kissing in negative zone therefore not suggesting any side trend formations and let clear trend formation confirmation come from this indicator then will be decided accordingly.
Nifty
(Last 3 Sessions intraday charts analysis)
Nifty-Intra Day Chart (Feb 16 to Feb 18,2022):-
Technical Patterns formation in last 3 Sessions intraday charts

1- Whole day only intraday volatility on 16-02-2022
2- Selling between 17324-17417 on 17-02-2022
3- Selling between 17329-19380 17,380 on 17-02-2022
4- Getting suppports between 17235-17293 in last 3 sessions 
5- Last 3 Sessions actual trading between 17220-17490 

Conclusions from 3 Sessions intra day chart analysis 

Although Nifty got supports at lower levels between 17335-17293 in last 3 sessions but higher levels good selling also in 2 previous sessions therefore expected that firstly down moves will be seen in the beginning of next week towards the lowest of last 3 sessions(17220) and once sustaining below it will mean sharp fall after breaking down confirmation of last 3 sessions trading range.

Conclusions
(After putting all studies together)

1- Short Term Trend is sideways.
2- Intermediate Term Trend is sideways.
3- Long Term Trend is up.

As corrective Wave-A of "ABC' correction started after Impulsive Wave-5 completion and new life time top formation at 18604.50 on 19-10-2021 therefore Nifty has to correct whole rally which strted begun from 7511.10 on 24-03-2020.  
 
Now Wave-C of on going "ABC' correction continuation with recent bottom formation at 16809.7 on 14-02-2022 towards and below the bottom of of Wave-A(16410.20) after Wave-B completion at 18351.00 on 18-01-2022.

Last 20 Sessions sideways trading between 16810-17794 and finally sustaining beyond this range will form next trend therefore should be firstly watched in the coming week/weeks. Next supports and resistances within this range are as follows;-

1- Resistances in last 20 Sessions trading range are as follows:-
A- 17324-17417
B- 17580-17639 
C- 17648-17684
D- 17699-17731  
E- 17736-17761
2- Supports in last 20 Sessions trading range are as follows:-
A- 17235-17293
B- 17124-17213 
C- 17044-17106
D- 17008-17110
E- 16872-16951

As good intraday selling in last 2 sessions of previous week therefore firstly down moves will be seen towards and below the lowest(17220) of last 3 sessions and once broken down confirmation of last 3 sessions trading range will mean steep fall possibility towards and below the lowest(16810) of last 20 sessions trading range because Short To Long Term averages are also suggesting inherent weakness. 

200-Day SMA is today at 16851 and last Friday closing was above it therefore Long Term Trend is still up but at stake because it was tested on 14-02-2022 after intraday lowest formation below it was at 16809.70. 

Wave-B begun after corrective Wave-A of "ABC" correction completion at 16410.20 on 20-12-2021 which is now below 200-Day SMA(16851). Now Wave-C continuation towards and below the bottom of Wave-B(16410.20) and once sustaining below 16851 will mean Long Term Trend turning down confirmation as well as sharp fall possibility towards below 16410.20.
Down moves towards next supports
Nifty-Intra Day Chart Analysis & 
Market Outlook(18-02-2022)
Nifty-Intra Day Chart (17-Feb-2022):-
Technical Patterns formation in today intraday charts

1- Sharp fall after positive opening
2- Up moves 
3- Selling between 17324-17417
4- Whole day actual trading between 17236-17442

Conclusions from intra day chart analysis 

Although sharp fall after positive opening but up up move also seen after that. As good selling between 17224-17417 therefore down moves were seen in last hours which will remain continued towards next supports above 17100 in the coming session also.
 Watch levels amid Russia–Ukraine
 different types war news
Nifty-Intra Day Chart Analysis & 
Market Outlook(17-02-2022)
Nifty-Intra Day Chart (16-Feb-2022):-
Technical Patterns formation in today intraday charts

1- Only intraday volatility
2- Whole day actual trading between 17258-17490

Conclusions from intra day chart analysis 

As different types of Russia–Ukraine war reports therefore all the Global markets are reacting on it through huge volatility and Indian markets have also followed it accordingly in last 3 sessions.

Although last 40 sssions lowest was formed at 16809.70 on 14-02-2022 but jumped also next day after some positive signals from Russia–Ukraine border. As no one knows its fate and its impact on the world therefore if war begins then firstly sustaining beyond 16809.70 should be watched for deeper correction beginning confirmations but immediately sharp up moves will not be seen because following resistances are lying above today highest:-

1- 17580-17639 
2- 17648-17684
3- 17699-17731  
4- 17736-17761

As Nifty digested whole Russia–Ukraine news between 16810-17490 in the last 3 sessions through huge volatility therefore finally sustaining its beyond should be watched for next decisive moves beginning confirmations amid high possibility of finally sustaining below 16810.
As not recovered yet and not feeling well therefore Stock Market Outlook of today(16-02-2022) is not being updated but most likely Outlook of tomorrow(17-02-2022) will be posted..
 As not feeling well therefore Stock Market Outlook of today(15-02-2022) is not being updated.
 Wave-C continuation towards 16410.20 & sustaining below it will confirm deeper correction
Technical Analysis,Research & Weekly Outlook
(Feb 14 to Feb 18,2022)
Nifty-EOD Chart Analysis
(Waves structure)
Nifty-EOD Chart (01-Feb-2022):-
Technical Patterns and Formations in EOD charts

1- Corrective Wave-C completion and Impulsive Wave-1 beginning from 7511.10 on 24-03-2020  
2- Impulsive Wave-1 completion at 11794.30 on 31-08-2020  
3- Corrective Wave-2 completion at 10790.20 on 24-09-2020
4- Impulsive Wave-3 completion at 15431.8 on 16-02-2021
5- Corrective Wave-4 completion at 14151.4 on 22-04-2021
6- Impulsive Wave-5 completion after new life time top formation at 18604.50 on 19-10-2021 and corrective Wave-A of "ABC' correction beginning.
7- Corrective Wave-A of "ABC" correction completion at 16410.20 on 20-12-2021
8- Wave-B completion at 18351.00 on 18-01-2022 and and Wave-C beginning
9- Wave-C continuation with recent bottom formation at 16836.8 on 25-01-2022  
10 Pre-Budget rally fused at 17794.60 on 01-02-2022   

Conclusions from EOD chart analysis
(Waves structure)

Impulsive Wave-1 which started from 7511.10 on 24-03-2020 completed at 18604.50 on 19-10-2021 after its Impulsive Wave-5 completion and Corrective Wave-A of "ABC" correction begun.Corrective Wave-A completed at 16410.20 on 20-12-2021 and after that Wave-B also finished at 18351.00 on 18-01-2022. Now Wave-C of "ABC" correction continuation with its recent bottom formation at 16836.8 on 25-01-2022 and no indication of its completion yet.

Nifty-Last 13 Sessions
intraday charts analysis
Nifty-Intra Day Chart (Jan 25 to Feb 11,2022):-
Technical Patterns formation in last 13 Sessions intraday charts

1- Selling(Resistances) in last 13 Sessions are as follows:-
A- 17372-17445
B- 17580-17639 
C- 17648-17684
D- 17699-17731  
E- 17736-17761
2- Consolidation(Supports) in last 13 Sessions are as follows:-
A- 17303-17334 
B- 17124-17213 
C- 17044-17106
D- 17008-17110
E- 16872-16951
3- Last 13 Sessions actual trading between 16837-17794 

Conclusions from 13 Sessions
intra day chart analysis

Last 13 Sessions actual trading between 16837-17794 with above mentioned higher levels resistances and lower levels supports within it which are almost equally strong therefore expected that Nifty will firstly trade within last 13 Sessions trading range(16837-17794) and finally sustaining it beyond will confirm next big moves which will be seen in the coming week/weeks.

Nifty-Intra Day Chart Analysis
(11-Feb-2022)
Nifty-Intra Day Chart (11-Feb-2022):-
Technical Patterns formation in today intraday charts

1- 154 Points weaker opening
2- Selling between 17390-17436
3- Sharp fall
4- Support between 17303-17334
5- Up moves
6- Bearish Rising Wedge formations at higher levels
7- Sharp fall
8- Selling between 17372-17397
9- Whole day actual trading between 17303-17454

Conclusions from
intra day chart analysis 

As fresh selling after 154 Points weaker opening therefore sharp fall after that but Nifty got lower levels supports hence up moves also developed in Mid-session. 

Bearish Rising Wedge formations at higher levels and sharp fall after that as well as follow up selling therefore down moves in last half hour and closing was little above intraday lowest. As good intraday selling patterns formations last Friday therefore down moves will be seen below last Friday lowest(17303) in the beginning of next week.

Conclusions
(After putting all studies together)

1- Short Term Trend is sideways.
2- Intermediate Term Trend is sideways.
3- Long Term Trend is up.

Although Nifty will firstly trade within last 13 Sessions trading(16837-17794) but firstly down moves will be seen towards above mentioned supports in the beginning of next week because higher levels good intraday selling patterns formations last Friday.

Now Wave-C of "ABC" correction continuation with its recent bottom formation at 16836.8 on 25-01-2022 and no indication of its completion yet. As higher levels good selling in previous 2 weeks therefore corrective Wave-C will remain continued towards the bottom of Wave-A(16410.20). Fresh selling and once sustaining below it will confirm deeper correction beginning which should be watched in the coming week/weeks.
Sideways Market after down moves
Nifty-Intra Day Chart Analysis & 
Market Outlook(11-02-2022)
Nifty-Intra Day Chart (10-Feb-2022):-
Technical Patterns formation in today intraday charts

1- Down moves in Bullish Falling Channel
2- Up moves
3- Selling between 17580-17639
4- Whole day actual trading between 17428-17639

Conclusions from intra day chart analysis 

Following lines were told in "Rally continuation after fresh consolidation":-

1- rally continuation is expected in the coming sessions
2- fresh consolidation is also firstly required near about day's highest(17477)

Firstly Nifty slipped below yesterday highest(17477) after strong opening and after that rally continuation as well as Nifty closing 143 points up with 211 points recovery from lower levels.

Although lower levels good consolidation but higher levels good selling was also seen therefore down moves will be seen and Nifty will remain sideways between 17428-17639 tomorrow as well as prepare for next decisive moves.
Rally continuation after fresh consolidation
Nifty-Intra Day Chart Analysis & 
Market Outlook(10-02-2022)
Nifty-Intra Day Chart (09-Feb-2022):-
Technical Patterns formation in today intraday charts

1- Consolidation between 17365-17436
2- Slow up moves
3- Whole day actual trading between 17339-17477

Conclusions from intra day chart analysis 

As firstly consolidation between 17365-17436 after gap up opening therefore up moves were seen in last hours. Although rally continuation is expected in the coming sessions but fresh consolidation is also firstly required near about day's highest(17477) because last hours up movees were slow and some selling can not be ruled out on the back of these slow up moves.
 Up moves will be seen towards 
next resistances
Nifty-Intra Day Chart Analysis & 
Market Outlook(09-02-2022)
Nifty-Intra Day Chart (08-Feb-2022):-
Technical Patterns formation in today intraday charts

1- Down moves in Bullish Falling Channel
2- Up moves with downward corrections
3- Consolidation between 17124-17213 
4- Whole day actual trading between 17044-17306

Conclusions from intra day chart analysis 

Although firstly more than 160 points fall after positive opening but whole day good consolidation through above mentioned intraday trading patterns formations therefore up moves will be seen towards following next resistances in the coming sessions because Very Short Term indicators have turned over sold also:-

1- 17392-16458
2- 17527-16571
3- 17607-17635 
4- 17648-17684
5- 17699-17731  
6- 17736-17761
 As busy therefore Stock Market Outlook of today(08-02-2022) is not being updated.
 17498 will confirm correction towards and below the bottom of Wave-A(16410.20)
Technical Analysis,Research & Weekly 
Outlook(Feb 07 to Feb 11,2022)
Nifty-EOD Chart Analysis
(Stochastic & MACD)
Nifty-EOD Chart (04-Feb-2022):-
Technical Patterns and Formations in EOD charts

1- Corrective Wave-A of "ABC" correction completion at 16410.20 on 20-12-2021
2- Wave-B completion at 18351.00 on 18-01-2022 and and Wave-C beginning
3- Wave-C continuation with recent bottom formation at 16836.8 on 25-01-2022
4- Budget-2022 rally completion at 17794.6 on 02-02-2022
5- In Stochastic- %K(5) line has intersected %D(3) line downward and its both lines are falling from Over bought zone.
6- Stochastic:- %K(5)- 71.72 & %D(3)- 81.52.
7- In MACD- MACD line has intersected Average line downward and its both lines are falling in negative zone.
8- MACD(26,12)- -364.42 & EXP(9)- -113.06 & Divergence- -251.36

Conclusions from EOD chart analysis
(Stochastic & MACD)

Wave-C of "ABC" correction continuation with recent bottom formation at 16836.8 on 25-01-2022. From this level Budget-2022 rally started which completed at 17794.6 on 02-02-2022 and after that down moves begun which are in continuation with recent bottom formations at 17462.5 on 04-02-2022.

In Stochastic  both lines are falling from Over bought zone after %K(5) line downward intersection of %D(3) line therefore suggesting more down moves possibilities.

In MACD MACD line has intersected Average line downward and its both lines are falling in negative zone therefore showing downward trend formations and showing more down moves in the coming week also.

Nifty-EOD Chart Analysis
(Bollinger Band)
Nifty-EOD Chart (04-Feb-2022):-
Technical Patterns and Formations in EOD charts

1- Budget-2022 rally faced resistance at Middle Band
2- Down moves started towards Lower Band

Conclusions from EOD chart analysis
(Bollinger Band)

As Budget-2022 rally faced resistance at Middle Band and after that down moves started towards Lower Band therefore indications of Nifty slipping towards the lowest of Pre-Budget rally at 16836.8. 

Nifty-Last 4 Sessions
intraday charts analysis
Nifty-Intra Day Chart (Feb 01 to Feb 04,2022):-
Technical Patterns formation in last 4 Sessions intraday charts

1- More than 11 hours sideways trading between 17498-17622 on Budget day(1st Feb) and last Friday(4th Feb)
2- Selling(Resistances) on 03-02-2022:-
A- 17607-17635 
B- 17648-17684
C- 17699-17731  
D- 17736-17761
3- Last 4 Sessions actual trading between 17245-17794 

Conclusions from 4 Sessions
intra day chart analysis 

Nifty traded most time between 17498-17622 on Budget-2022 day and again traded most time within this this range last Friday(04-02-2022) as well as Nifty closed 3 days within this range of Feb-2022 also:- 

1- Nifty closed at 17576.6 on 01-02-2022
2- Nifty closed at 17560.2 on 03-02-2022
3- Nifty closed at 17516.3 on 04-02-2022

As more than 11 hours sideways trading and above mentioned 3 previous sessions closing also between 17498-17622 therefore this range has become more crucial and next big moves decider as well. Good selling was seen within and above it on 03-02-2022 therefore once sustaining below it(17498) will mean deeper correction beginning hence should be firstly watched in next week for its confirmations.
 
Conclusions (After putting all studies together)

1- Short Term Trend is sideways.
2- Intermediate Term Trend is sideways.
3- Long Term Trend is up.

Pre/Post Budget rally and its termination also was seen in previous week. As last 2 sessions of previous week were affected by facebook negative news led depressing Global markets also therefore firstly sustaining beyond 11 hours sideways trading range(17498-17622) should be watched in next week for decisive moves beginning confirmations.

As above mentioned indicators are suggesting down moves possibilities therefore fresh selling and after that sustaining below 17498 will mean corrective Wave-C continuation confirmations towards and below the bottom of Wave-A(16410.20) which is expected also.
 facebook news based market requires next decisive moves confirmations from 17498-17622 
Nifty-Intra Day Chart Analysis & 
Market Outlook(04-02-2022)
Nifty-Intra Day Chart (03-Feb-2022):-
Technical Patterns formation in today intraday charts

1- Whole day down moves with upward corrections
2- Whole day actual trading between 17512-17781

Conclusions from intra day chart analysis 

Sentiment turned weak today morning because facebook share moved down 20% in US markets after its disclosure that its advertisements are not running on APPLE hence NASDAQ Futures was also trading more than 300 points down today morning and in reaction NIFTYIT crashed after opening and closed more than 2% down today.

As US Futures and all the European markets were traded in deep Red today therefore Whole day down moves were seen with upward corrections in Indian markets also and today closing was at the lower levels of the day.

Nifty traded sideways between 17498-17622 on Budget day and closed within it after higher levels falls today. As facebook news based market today therefore firstly sustaining it beyond should be watched in the coming sessions for next decisive moves beginning confirmations
 facebook negative news led weakness in Indian markets
Post-open Outlook(03-02-2022)

As facebook share moved down 20% in US markets after its disclosure that its advertisements are not running on APPLE hence NASDAQ Futures is more than 300 points down today morning and in reaction NIFTYIT is also trading 390 points weak today and resultant NIFTY is also 95 points down.
 Rally towards and above 18000
Nifty-Intra Day Chart Analysis &
Market Outlook(03-02-2022)
Nifty-Intra Day Chart (02-Feb-2022):-
Technical Patterns formation in today intraday charts

1- Consolidation between 17718-17765
2- Whole day actual trading between 17675-17794

Conclusions from intra day chart analysis 

As good consolidation between 17718-17765 therefore rally will remain continued towards and above 18000 tomorrow.
 Rally towards next resistances
Nifty-Intra Day Chart Analysis & 
Market Outlook(02-02-2022)
Nifty-Intra Day Chart (01-Feb-2022):-
Technical Patterns formation in today intraday charts

1- Sideways trading between 17498-17622
2- Mid-session high volatility after Budget
3- Whole day actual trading between 17245-17622

Conclusions from intra day chart analysis 

As market friendly and economically sound Budget presentation by our FM Nirmala Sitaraman in Parliament therefore Nifty closed near the higher levels of the day with 01.37% gains. Although Mid-session high volatility after Budget but rally continuation is expected towards following next resistances in the coming sessions:-

1- 17795-17832
2- 17959-18129
3- 18292-18321
 Watch 2 levels for Post Union-Budget-2022 big moves beginning confirmations
Nifty-Intra Day Charts Analysis & 
Market Outlook(01-02-2022)
Nifty-Intra Day Chart (Jan 28 & Jan 31,2022):-
Technical Patterns formation in last 2 Sessions intraday charts

1- Selling between 17319-17373 on 28-01-2022
2- Sideways trading between 17277-17373 on 28-01-2022
3- Sharp down moves in Mid-session on 28-01-2022
4- Whole day sideways trading between 17268-17410 on 31-01-2022
5- Last 2 Sessions actual trading between 17078-17410

Conclusions from 2 Sessions
intra day chart analysis 

More than 10 hours sideways trading between 17268-17410 in last 2 sessions therefore firstly sustaining it beyond should be watched tomorrow for Post-Budget decisive moves beginning confirmations. As good selling between 17319-17373 on 28-01-2022 therefore sustaining below 17268 will mean sharp fall. 

Firstly watch above mentioned 2 levels tomorrow for above updated big moves beginning confirmations after Union-Budget-2022.