Minimum Target of Nifty at 16156.7 & finally 16867-17373 will confirm
Post-Budget next big moves
Technical Analysis,Research & Weekly
Outlook(Jan 31 to Feb 04,2022)
Nifty-EOD Chart Analysis
(Corrective Waves)
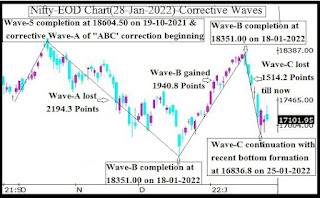
Nifty-EOD Chart (28-Jan-2022):-
Technical Patterns and Formations in EOD charts
1- Impulsive Wave-5 completion after new life time top formation at 18604.50 on 19-10-2021 and corrective Wave-A of "ABC' correction beginning.
2- Corrective Wave-A of "ABC" correction completion at 16410.20 on 20-12-2021
3- Wave-A lost 2194.3 Points
4- Wave-B completion at 18351.00 on 18-01-2022 and and Wave-C beginning
5- Wave-B gained 1940.8 Points
6- Wave-C continuation with recent bottom formation at 16836.8 on 25-01-2022
7- Wave-C lost 1514.2 Points till now
Conclusions from EOD chart analysis
(Corrective Waves)
Waves structure which started through is Impulsive Wave-1 from 7511.10 on 24-03-2020 completed after its Impulsive Wave-5 completion with new life time top formation at 18604.50 on 19-10-2021 and corrective Wave-A of "ABC" correction begun.
As "ABC" correction has been started therefore it will correct whole rally between 7511.10-18604.50. Now its Wave-C continuation and it should minimum retrace 100% of Wave-A which is 2194.3 Points.
Wave-C started from 18351.00 and minimum 100% correction ie 2194.3 Points does mean Minimum Target of on going Nifty correction is at 16156.7(18351.00-2194.3).
Nifty-EOD Chart Analysis
(Averages)
Nifty-EOD Chart (28-Jan-2022):-
Technical Patterns and Formations in EOD charts
1- 5-Day SMA is today at 17251
2- 21-Day SMA is today at 17744
3- 55-Day SMA is today at 17486
4- 100-Day SMA is today at 17639
5- 200-Day SMA is today at 16638
Conclusions from EOD chart analysis
(Averages)
Nifty has closed below all the Short and Intermediate Term Averages last Friday but has not tested Long Term Average(200-Day SMA) during on going correction. As 200-Day SMA is most crucial and next big moves decider therefore sustaining it beyond should also be watched in the coming weeks for Long Term Trend confirmations
Nifty-Weekly Chart Analysis
(Stochastic & MACD)
Nifty-Weekly Chart (28-Jan-2022):-
Technical Patterns and Formations in Weekly charts
1- Stochastic- %K(5) line has intersected %D(3) line downward and its both lines are falling from Over bought zone.
2- Stochastic:- %K(5)- 59.41 & %D(3)- 77.41.
3- In MACD- MACD line has intersected Average line downward and its MACD line is falling in negative zone while its Average line is falling in positive zone.
4- MACD(26,12)- -93.85 & EXP(9)- 246.06 & Divergence- -339.91
Conclusions from Weekly chart analysis
(Stochastic & MACD)
As in Weekly Stochastic %K(5) line has intersected %D(3) line downward and its both lines are falling from Over bought zone therefore suggesting decisive down moves on cards.
As in Weekly MACD line has intersected Average line downward and its both lines falling therefore showing Intermediate Term down trend formations hence finally down moves will be expected in the coming weeks.
Nifty-Last 2 Sessions
intraday charts analysis
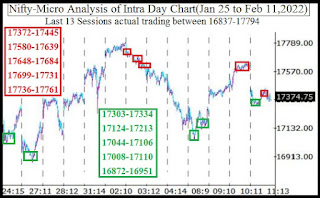
Nifty-Intra Day Chart (Jan 27 & Jan 28,2022):-
Technical Patterns formation in last 2 Sessions intraday charts
1- Consolidation through Down moves in Bullish Falling Channel and Up moves with downward corrections between 16867-17031 on 27-01-2022
2- Sharp up moves in Mid-session on 27-01-2022
3- Selling between 17319-17373 on 28-01-2022
4- Sharp down moves in Mid-session on 28-01-2022
5- Last 2 Sessions actual trading between 16867-17373
Conclusions from 2 Sessions
intra day chart analysis
As lower levels consolidation was seen through Down moves in Bullish Falling Channel and Up moves with downward corrections between 16867-17031 therefore sharp up moves developed in Mid-session on 27-01-2022. In the same manner higher levels good Selling was seen between 17319-17373 therefore sharp down moves developed in Mid-session on 28-01-2022 also.
Last 2 Sessions actual trading between 16867-17373 with good consolidation and equally good selling within above mentioned trading range therefore at present Nifty is not prepared for any side one sided big decisive moves and that will be firstly done in the beginning of next week. As finally sustaining beyond 16867-17373 will generate next big moves therefore these levels should also be watched for next big moves beginning confirmations.
Conclusions
(After putting all studies together)
1- Short Term Trend is down.
2- Intermediate Term Trend is down.
3- Long Term Trend is up.
Wave-C continuation with recent bottom formation at 16836.8 and no indication of its completion yet. As minimum Target of Wave-C is at 16156.7 and Intermediate Term indicators are showing more down moves possibilities as well as Averages are suggesting inherent weakness therefore expected that finally on going correction will remain continued towards and below 16156.7.
As last 2 Sessions trading between 16867-17373 with both lower levels good consolidation and equally good higher levels selling within this range therefore Nifty will firstly trade within this range and finally sustaining it beyond will confirm next decisive big moves beginning.
Union-Budget 2022 will be tabled in Parliament at 11:00 AM on 01-02-2022 and market may be highly volatile also during its announcements. As Indian Stock Markets final reactions on Budget will be from sustaining beyond 16867-17373 therefore should be firstly watched on Budget and following days for next big moves beginning confirmations.