Wave-C continuation towards 16410.20 & sustaining below it will confirm deeper correction
Technical Analysis,Research & Weekly Outlook
(Feb 14 to Feb 18,2022)
Nifty-EOD Chart Analysis
(Waves structure)
Nifty-EOD Chart (01-Feb-2022):-

Technical Patterns and Formations in EOD charts
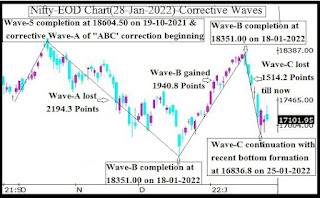
1- Corrective Wave-C completion and Impulsive Wave-1 beginning from 7511.10 on 24-03-2020
2- Impulsive Wave-1 completion at 11794.30 on 31-08-2020
3- Corrective Wave-2 completion at 10790.20 on 24-09-2020
4- Impulsive Wave-3 completion at 15431.8 on 16-02-2021
5- Corrective Wave-4 completion at 14151.4 on 22-04-2021
6- Impulsive Wave-5 completion after new life time top formation at 18604.50 on 19-10-2021 and corrective Wave-A of "ABC' correction beginning.
7- Corrective Wave-A of "ABC" correction completion at 16410.20 on 20-12-2021
8- Wave-B completion at 18351.00 on 18-01-2022 and and Wave-C beginning
9- Wave-C continuation with recent bottom formation at 16836.8 on 25-01-2022
10 Pre-Budget rally fused at 17794.60 on 01-02-2022
Conclusions from EOD chart analysis
(Waves structure)
Impulsive Wave-1 which started from 7511.10 on 24-03-2020 completed at 18604.50 on 19-10-2021 after its Impulsive Wave-5 completion and Corrective Wave-A of "ABC" correction begun.Corrective Wave-A completed at 16410.20 on 20-12-2021 and after that Wave-B also finished at 18351.00 on 18-01-2022. Now Wave-C of "ABC" correction continuation with its recent bottom formation at 16836.8 on 25-01-2022 and no indication of its completion yet.
Nifty-Last 13 Sessions
intraday charts analysis
Nifty-Intra Day Chart (Jan 25 to Feb 11,2022):-
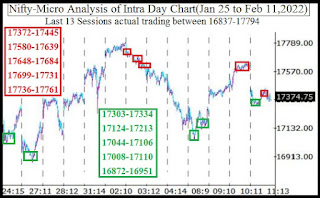
Technical Patterns formation in last 13 Sessions intraday charts
1- Selling(Resistances) in last 13 Sessions are as follows:-
A- 17372-17445
B- 17580-17639
C- 17648-17684
D- 17699-17731
E- 17736-17761
2- Consolidation(Supports) in last 13 Sessions are as follows:-
A- 17303-17334
B- 17124-17213
C- 17044-17106
D- 17008-17110
E- 16872-16951
3- Last 13 Sessions actual trading between 16837-17794
Conclusions from 13 Sessions
intra day chart analysis
Last 13 Sessions actual trading between 16837-17794 with above mentioned higher levels resistances and lower levels supports within it which are almost equally strong therefore expected that Nifty will firstly trade within last 13 Sessions trading range(16837-17794) and finally sustaining it beyond will confirm next big moves which will be seen in the coming week/weeks.
Nifty-Intra Day Chart Analysis
(11-Feb-2022)
Nifty-Intra Day Chart (11-Feb-2022):-

Technical Patterns formation in today intraday charts
1- 154 Points weaker opening
2- Selling between 17390-17436
3- Sharp fall
4- Support between 17303-17334
5- Up moves
6- Bearish Rising Wedge formations at higher levels
7- Sharp fall
8- Selling between 17372-17397
9- Whole day actual trading between 17303-17454
Conclusions from
intra day chart analysis
As fresh selling after 154 Points weaker opening therefore sharp fall after that but Nifty got lower levels supports hence up moves also developed in Mid-session.
Bearish Rising Wedge formations at higher levels and sharp fall after that as well as follow up selling therefore down moves in last half hour and closing was little above intraday lowest. As good intraday selling patterns formations last Friday therefore down moves will be seen below last Friday lowest(17303) in the beginning of next week.
Conclusions
(After putting all studies together)
1- Short Term Trend is sideways.
2- Intermediate Term Trend is sideways.
3- Long Term Trend is up.
Although Nifty will firstly trade within last 13 Sessions trading(16837-17794) but firstly down moves will be seen towards above mentioned supports in the beginning of next week because higher levels good intraday selling patterns formations last Friday.
Now Wave-C of "ABC" correction continuation with its recent bottom formation at 16836.8 on 25-01-2022 and no indication of its completion yet. As higher levels good selling in previous 2 weeks therefore corrective Wave-C will remain continued towards the bottom of Wave-A(16410.20). Fresh selling and once sustaining below it will confirm deeper correction beginning which should be watched in the coming week/weeks.