ॐ ह्रीं श्रीं लक्ष्मीभयो नमः॥


Trading "calls" from our "Software" with more than "90% accuracy"

More than "12 years" old "only site of whole world" 
with more than "9700 accurate Outlooks" of 
"Indian Stock Markets" 
Sustaining beyond 16867-17202 will 
generate next big moves
Nifty-Intra Day Chart Analysis & 
Market Outlook(28-01-2022)
Nifty-Intra Day Chart (27-Jan-2022):-
Technical Patterns formation in today intraday charts

1- Down moves in Bullish Falling Channel
2- Up moves with downward corrections
3- Volatility in last 2 hours between 17052-17182
4- Whole day actual trading between 16867-17182

Conclusions from intra day chart analysis 

As all the Global markets were in crashing mode therefore Nifty opened 215 points down and after that traded 411 points weaker also but lower levels good consolidation was seen seen through down moves in Bullish Falling Channel and until complete selling will not develop till then Nifty will not sustain below it,

Although intraday up moves with downward corrections but higher levels 130 points volatility was also seen between 17052-17182. Nifty traded 6 hours trading between 16998-17202 in 2 previous sessions and closed within it at 7110.15 also. 

As huge Global markets pressure therefore Pre-Budget rally could not develop and only 2 sessions are left before Budget as well as Indian markets will prepare for post-Budget big decisive moves between 16867-17202 in these 2 sessions.

As finally sustaining beyond 16867-17202 will generate next big moves before or after Budget therefore should be watched for its confirmations.
 Only watch 17202 for Pre-Budget rally confirmations amid 
FOMC announcements reactions 
led Global markets
Nifty-Intra Day Chart Analysis & 
Market Outlook(27-01-2022)
Nifty-Intra Day Chart (25-Jan-2022):-
Technical Patterns formation in today intraday charts

1- 313 Points fall in first 4 minutes
2- 190 Points jump in next 45 minutes
3- Almost 4 hours trading between 17009-17202
4- Slow up moves in last hour
5- Whole day actual trading between 16837-17309

Conclusions from intra day chart analysis 

Following lines were told at 12:22 AM on 25-01-2022 in "16998-17186 will confirm Pre Budget rally":-

Sustaining beyond 16998-17186 should be firstly watched in the coming sessions for Pre Budget rally

Nifty traded almost 4 hours within near about 16998-17186 between 17009-17202 and finally moved up and closed above 17186 as well as generated first strong signal of Pre-Budget rally.

Although huge volatility between 16837-17002 in first hour on 25-01-2022 but closing was at the top of the day and almost 6 hours trading between 16998-17202 in last 2 sessions therefore only sustaining above 17202 should be watched in the coming sessions for Pre-Budget rally confirmations amid FOMC announcements reactions led Global markets tomorrow.
 16998-17186 will confirm 
Pre Budget rally
Nifty-Intra Day Chart Analysis &
Market Outlook(25-01-2022)
Nifty-Intra Day Chart (24-Jan-2022):-
Technical Patterns formation in today intraday charts

1- 5 Hours down moves after weak opening
2- Last 2 hours trading between 16998-17186 with lower levels consolidation patterns formations
3- Down moves in Bullish Falling Channels
4- Whole day actual trading between 16998-17599

Conclusions from intra day chart analysis 

Although 5 Hours down moves after weak opening but last 2 hours trading between 16998-17186 and lower levels consolidation was seen through Down moves in Bullish Falling Channels therefore sustaining beyond 16998-17186 should be 
firstly watched in the coming sessions for 
Pre Budget rally.
 Firstly watch most crucial supports and resistances amid Union Budget-2022 expectations and announcements led high volatility
Technical Analysis,Research & Weekly Outlook
(Jan 24 to Jan 28,2022)
Nifty-EOD Chart Analysis 
(Stochastic & MACD)
Nifty-EOD Chart (21-Jan-2022):-
Technical Patterns and Formations in EOD charts

1- Impulsive Wave-5 completion after new life time top formation at 18604.50 on 19-10-2021 and corrective Wave-A of "ABC' correction beginning.
2- Corrective Wave-A of "ABC" correction completion at 16410.20 on 20-12-2021
3- Wave-B completion at 18351.00 on 18-01-2022 and and Wave-C beginning
4- Wave-C continuation with recent bottom formation at 17485.8 on 21-01-2022     
5- Stochastic- %K(5) line has intersected %D(3) line downward and its both lines are in Over sold zone.
5- Stochastic:- %K(5)- 14.04 & %D(3)- 21.92.
6- In MACD- MACD line has intersected Average line downward and its MACD line is falling while Average line is flat 
7- MACD(26,12)- 418.83 & EXP(9)- 495.43 & Divergence- -76.6

Conclusions from EOD chart analysis
(Stochastic & MACD)

As in Stochastic- %K(5) line has intersected %D(3) line downward and its both lines are in Over sold zone therefore suggesting that up moves may start any day.

As in MACD- MACD line has intersected Average line downward and its MACD line is falling while Average line is flat therefore MACD has started to show downward trend formation signals. 

Although Stochastic is suggesting some up moves possibilities but MACD is showing downward trend formation signals therefore expected that finally down moves will be seen after some up moves.

Nifty-EOD Chart Analysis
(Fibonacci retracement levels)
Nifty-EOD Chart (21-Jan-2022):-
Technical Patterns and Formations in EOD charts

1- Corrective Wave-A of "ABC" correction completion at 16410.20 on 20-12-2021 and Wave-B beginning
2- Wave-B completion at 18351.00 on 18-01-2022 and and Wave-C beginning
3- Wave-C continuation with recent bottom formation at 17485.8 on 21-01-2022 
4- Fibonacci Retracement levels from Wave-B(18351-16410)
1- 13.0%-18,098
2- 23.6%-17,892
3- 27.0%-17,826
4- 38.2%-17,609(Crucial)
5- 50.0%-17,380(Crucial)
6- 61.8%-17,151(Crucial)
7- 70.7%-16,978
8- 76.4%-16,868
9- 78.6%-16,825 
10-88.6%-16,631 

Conclusions from EOD chart analysis
(Fibonacci retracement levels)

Wave-B which started from 16410.20 on 20-12-2021 completed at 18351.00 on 18-01-2022. Now Wave-C continuation with recent bottom formation at 17485.8 which is between 38.2% and 50.0%. As Nifty closed near 38.2% level(17609) at 17617.15 last Friday therefore firstly sustaining it beyond should be watched in the coming sessions for pre-Budget next decisive moves beginning confirmations.

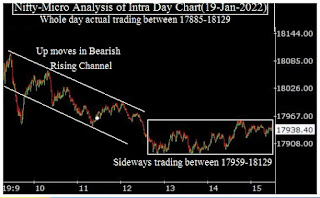
Nifty-Intra Day Chart Analysis(21-01-2022)
Nifty-Intra Day Chart (21-01-2022):-
Technical Patterns formation in today intraday charts

1- 230 Points fall in first 15 minutes after gap down opening
2- Selling between 17591-17706
3- Down moves in Bullish Falling Channel
4- 160 Points jump in last half hour
5- Whole day actual trading between 17486-17707

Conclusions from intra day chart analysis 

Although 230 Points fall in first 15 minutes after gap down opening but after that up moves were seen from lower levels. As fresh good selling developed at higher levels between 17591-17706 therefore down moves were seen  till last hour but were in Bullish Falling Channel also hence Nifty jumped 160 Points in last half hour 

As higher levels good selling last Friday therefore firstly down moves will be seen towards 17486 in the beginning of next week and firstly sustaining it beyond should be watched for next decisive moves beginning confirmations because some consolidation was also seen above it in last hours through Down moves in Bullish Falling Channel.

Conclusions
(After putting all studies together)

1- Long Term Trend is up.
2- Intermediate Term Trend is up.
3- Short Term Trend is down.

Corrective Wave-C started in previous week for moving below the bottom of Wave-B(16410.20) but Short term indicators have turned oversold therefore some up moves can not be ruled out but finally down moves will be seen towards and below 16410.20 in the coming weeks/months without moving above the top of Impulsive Wave-5(18604.50).

As Union Budget-2022 will be tabled in Parliament on 01-02-2022 after 5 trading sessions therefore volatility may be high hence following supports and resistances should also be firstly watched for next trend beginning:-

Next supports between 18604.50-16410.20 are as follows:-

1- 17332-17371
2- 17192-17241
3- 16884-17093
4- 16820-16918
5- 16739-16782
6- 16411-16530

Next resistances between 16410.20-18604.50 are as follows:-

1- 17591-17706
2- 17795-17832
3- 17959-18129
4- 18292-18321
5- 18379-18458
6- 18548-18604 

As Indian markets may be highly volatile also on Budget expectations and announcements therefore firstly sustaining beyond above next supports and resistances should be watched one by one in the coming 2 weeks amid Union Budget-2022 led high volatility.

Above most crucial supports and resistances are between the top of Impulsive Wave-5(18604.50) ie life time top and bottom of Wave-A(16410.20) ie lowest of on going 'ABC" correction. As finally sustaining beyond 16410.20-18604.50 will form next trend and will generate next big moves as well therefore should be finally watched in next 2 weeks amid pre-Budget expectations till 1st Feb 2022 and finally Post-Budget announcements on and after 1st Feb 2022. 
 Firstly watch 17648-17943 for next decisive moves beginning confirmations 
Nifty-Intra Day Chart Analysis & 
Market Outlook(21-01-2022)
Nifty-Intra Day Chart (20-Jan-2022):-
Technical Patterns formation in today intraday charts

1- Down moves with upward corrections
2- Down moves in Bullish Falling Channels
3- 135 Points Sharp up moves in last hour
4- Whole day actual trading between 17648-17943

Conclusions from intra day chart analysis 

Following lines were told in previous Outlook named "Expectations of down moves towards next supports":-

Finally down moves will be seen towards following next supports:-

1- 17740-17788
2- 17657-17721

As was told 100% same happened and down moves were seen towards 17648.45 which was just below 17657 and after that Nifty moved up 135 points up moves sharply. 

Although positive opening but after that down moves started in Bullish Falling Channels which means that follow up selling was seen. As some consolidation also developed at lower levels through Down moves in Bullish Falling Channels therefore 135 Points Sharp up moves was in last hour.  

Technically higher levels selling and lower levels buying will be understood for day's trading between 17648-17943 therefore Nifty will firstly trade within this range and prepare for next decisive moves. Let Nifty prepare then will be decided according to coming sessions intraday patterns formations and will be updated,till then sustaing beyond 17648-17943 should be firstly watched in the coming sessions for next decisive moves beginning confirmations.
Expectations of down moves 
towards next supports
Nifty-Intra Day Chart Analysis &
Market Outlook(20-01-2022)
Nifty-Intra Day Chart (19-Jan-2022):-
Technical Patterns formation in today intraday charts

1- More than 100 points fall in first 3 minutes
2- Up moves in Bearish Rising Channel
3- Sideways trading between 17959-18129
4- Whole day actual trading between 17885-18129

Conclusions from intra day chart analysis 

Although positive opening but immediately after that more than 100 points sharp fall in first 3 minutes and then selling was seen through down moves with upward corrections. 

As some lower levels supports were also seen during sideways trading in last 3 hours between 17959-18129 therefore firsly sustaining beyond lowest of the day(17885) should be watched in the coming sessions for immediate down moves confirmations but expected that finally down moves will be seen towards following next supports:-

1- 17740-17788
2- 17657-17721
 As I was busy therefore could not update Stock Market Outlook of today(19-01-2022).
Short Term correction will begin
Nifty-Intra Day Chart Analysis & 
Market Outlook(18-01-2022)
Nifty-Intra Day Chart (17-Jan-2022):-
Technical Patterns formation in today intraday charts

1- Up moves in Bearish Rising Channel
2- Selling between 18292-18321
3- Whole day actual trading between 18228-18321

Conclusions from intra day chart analysis 

As firstly up moves in Bearish Rising Channel and after that higher levels good selling therefore Short Term correction will begin without sustaining above today highest(18321) despite today closing at the top of on going Pull Back rally.
 Deeper correction towards 
next supports
Technical Analysis,Research & Weekly Outlook
(Jan 17 to Jan 21,2022)
Nifty-EOD Chart Analysis
(Waves structure)
Nifty-EOD Chart (14-Jan-2022):-
Technical Patterns and Formations in EOD charts

1- Corrective Wave-C completion and Impulsive Wave-1 beginning from 7511.10 on 24-03-2020  
2- Impulsive Wave-1 completion at 11794.30 on 31-08-2020  
3- Corrective Wave-2 completion at 10790.20 on 24-09-2020
4- Impulsive Wave-3 completion at 15431.8 on 16-02-2021
5- Corrective Wave-4 completion at 14151.4 on 22-04-2021
6- Impulsive Wave-5 completion after new life time top formation at 18604.50 on 19-10-2021 and corrective Wave-A of "ABC' correction beginning.
7- Corrective Wave-A of "ABC" correction completion at 16410.20 on 20-12-2021
8- Wave-B continuation with recent top formation at 18286.95 on 14-01-2022 and no confirmation of its completion yet.    

Conclusions from EOD chart analysis
(Waves structure)

Bullish rally which started through its Impulsive Wave-1 from 7511.10 on 24-03-2020 completed from its 5th Wave after new life time top formation at 18604.50 on 19-10-2021 and corrective Wave-A of "ABC' correction begun which completed at 16410.20 on 20-12-2021.

Now Wave-B continuation with recent top formation at 18286.95 on 14-01-2022 and no confirmation of its completion yet on EOD charts.

Nifty-EOD Chart Analysis
(Stochastic & MACD)
Nifty-EOD Chart (14-Jan-2022):-
Technical Patterns and Formations in EOD charts

1- Impulsive Wave-5 completion after new life time top formation at 18604.50 on 19-10-2021 and corrective Wave-A of "ABC' correction beginning.
2- Corrective Wave-A of "ABC" correction completion at 16410.20 on 20-12-2021
3- Wave-B continuation with recent top formation at 18286.95 on 14-01-2022 and no confirmation of its completion yet.     
4- Stochastic- %K(5) line has intersected %D(3) line downward and its both lines are falling in bought zone.
5- Stochastic is showing negative divergence 
6- Stochastic:- %K(5)- 96.69 & %D(3)- 95.97.
7- In MACD- MACD line has intersected Average line upward and its both lines are rising in positive zone.
8- MACD(26,12)- 550.41 & EXP(9)- 314.89 & Divergence- 235.52

Conclusions from EOD chart analysis
(Stochastic & MACD)

As in Stochastic both lines are kissing in over bought zone and this indicator is in over bought zone since long therefore if down moves starts then sharp fall will be seen in next week. 

As in MACD MACD line has intersected Average line upward and its both lines are rising in positive zone therefore it showing upward trend formations.

Conclusion from these 2 indicators is that Short Term correction is very much due which will start any day in next week but will not be deep because in MACD both lines are rising in positive zone and its has not given any indication of downward trend formation.

Nifty-Intra Day Chart Analysis
(14-Jan-2022)
Nifty-Intra Day Chart (14-Jan-2022):-
Technical Patterns formation in today intraday charts

1- 137 Points sharp fall in first 3 minutes
2- More than 110 points jump from lower levels in first 40 Minutes
3- Down moves with upward corrections
4- Up moves in Bearish Rising Channels
5- Whole day actual trading between 18120-18286

Conclusions from intra day chart analysis 

Although firstly 137 points sharp fall in first 3 minutes but after that more than 110 points jump also from lower levels in first 40 Minutes therefore first hour trading was highly volatile last Friday
As firstly down moves were with upward corrections and after that whole day up moves were in Bearish Rising Channels therefore good intraday selling patterns formations last Friday hence expected that down moves will be seen below last Friday in the beginning oof next week. 

Conclusions
(After putting all studies together)

All the trends are up and Wave-B continuation with recent top formation at 18286.95 on 14-01-2022 and no confirmation of its completion yet on EOD charts.

As short Term indicator Stochastic is in over bought zone since long and its both lines are kissing therefore emergence of Short Term correction beginning strong indications which will start any day in next week.

Union Budget 2022 is scheduled on 01-02-2022 and on going rally is on the back of market favouring Budget. Last 20 sessions rally which started from 16410.20 and on 20-12-2021 is in continuation without any significant correction. As Short Term indicators are completely overbought and good intraday selling patterns formations also last Friday therefore expected that deeper correction will be seen towards following supports in next week:-

1- 17965-18025
2- 17902-17945
3- 17740-17788
4- 17657-17721
5- 17332-17371
6- 17192-17241
18119 will confirm correction 
beginning of on going rally
Post-open Outlook(14-01-2022)

As Dow Jones closed 176 points down yesterday therefore most Asian markets were trading more than 0.65% down and resultant sentiment turned weaker hence gap down opening of Indian markets.

As selling patterns were not seen and consolidation patterns were formed yesterday therefore Nifty recovered more than 110 points from lower levels in first 40 Minutes and fresh selling patterns formations today will mean first signal of correction beginning.

Last 2 sessions trading between 18129-18272 and today first 3 minutes lowest is below it at 18119.65 therefore firstly sustaining beyond 18119 should also be watched in the coming sessions for correction beginning confirmation of that on going rally which started from 16410.20 on 20-12-2021. 

Rally on Union Budget expectations
Nifty-Intra Day Chart Analysis & 
Market Outlook(14-01-2022)
Nifty-Intra Day Chart (13-Jan-2022):-
Technical Patterns formation in today intraday charts

1- Down moves in Bullish Falling Channels
2- Consolidation between 18211-18222 
3- Sharp up moves in last half hour
4- Whole day actual trading between 18164-18272

Conclusions from intra day chart analysis 

Although positive opening but down moves were seen after that. As whole day down moves were in Bullish Falling Channels and consolidation was also seen between 18211-18222 therefore sharp up moves developed in last half hour.

As Union Budget will be tabled in Parliament on 01-02-2022 therefore Indian markets are preparing for post Budget decisive one sided moves hence moving up on post Budget expectations. As whole day consolidation today therefore up moves will be seen tomorrow and let selling develop then correction will be considered according to the size of selling patterns formations but remain cautious because Short Term indicators are Over bought and correction may also begin any day after fresh selling patterns formations.
 Sustaining beyond 18161-18227 will confirm Indian markets reaction on 3 IT big quarterly results 
Nifty-Intra Day Chart Analysis & 
Market Outlook(13-01-2022)
Nifty-Intra Day Chart (12-Jan-2022):-
Technical Patterns formation in today intraday charts

1- 5 Hours sideways trading between 18161-18227
2- Whole day actual trading between 18129-18227

Conclusions from intra day chart analysis 

As most Asian markets were trading with more than 1.5% gains after strong closing of US markets yesterday therefore gap up opening of Indian markets and Nifty traded 5 hours sideways between 18161-18227 as well as prepared for next moves tomorrow after quarterly results announcement of 3 big companies(INFY,TCS & WIPRO).

As Indian markets will firstly react on the results of these 3 big companies tomorrow and and sustaining beyond today sideways trading range(18161-18227) will finally confirm it therefore should be firstly watched tomorrow.
Sharp fall & correction of Rally 
will start in next 2 sessions
Nifty-Intra Day Chart (11-Jan-2022):-
Technical Patterns formation in today intraday charts

1- Down moves in Bullish Falling Channel
2- Sharp up
3- Up moves in Bearish Rising Channels
4- Sharp fall
5- Selling patterns formations between 18020-18081 in last 5 hours
6- Whole day actual trading between 17965-18081

Conclusions from intra day chart analysis 

Although firstly Down moves after flat opening but were in Bullish Falling Channel therefore after that sharp up moves were seen. 

As selling patterns formations between 18020-18081 through Up moves in Bearish Rising Channels in last 5 hours therefore Nifty will not sustain above 18020 and sharp fall as well as correction of that rally which begun from 16410.20 on 20-12-2021 will start in next 2 sessions despite:-

1- at present All US Indices are trading in Green and Nasdaq is 145 Points up.
2- at present SGX Nifty is trading more than 100 Points up.
3- All the European markets closed with good gains today.
 As busy therefore Stock Market Outlook of today(11-01-2022) is not being updated.
 Watch next supports during 
expected correction in next week
Technical Analysis,Research & Weekly 
Outlook(Jan 11 to Jan 15,2022)
Nifty-EOD Chart Analysis
(Stochastic & MACD)
Nifty-EOD Chart (04-Jan-2022):-
Technical Patterns and Formations in EOD charts

1- Impulsive Wave-5 completion after new life time top formation at 18604.50 on 19-10-2021 and corrective Wave-A of "ABC' correction beginning.
2- Corrective Wave-A of "ABC" correction continuation with recent bottom formations at 16410.20 on 20-12-2021 and no confirmation of its completion yet.   
3- Pull Back Rally continuation with recent top formation at 17944.70 on 05-01-2022 
4- Stochastic- %K(5) line has intersected %D(3) line downward and its both lines are falling in bought zone.
5- Stochastic is showing negative divergence 
6- Stochastic:- %K(5)- 81.97 & %D(3)- 89.13.
7- In MACD- MACD line has intersected Average line upward and its both lines are rising in positive zone.
8- MACD(26,12)- 244.73 & EXP(9)- 15.33 & Divergence- 229.40

Conclusions from EOD chart analysis
(Stochastic & MACD)

Pull Back Rally which started from 16410.20 on 20-12-2021 is in continuation with recent top formation at 17944.70 on 05-01-2022 and confirmation its completion yet.  

As in Stochastic %K(5) line has intersected %D(3) line downward and its both lines are falling in bought zone as well as it has shown negative divergence therefore it is suggesting strong signals of down moves beginning in next week.

As in MACD MACD line has intersected Average line upward and its both lines are rising in positive zone therefore it showing upward trend formations.

Conclusion from these 2 indicators is that Short Term correction will be seen in next week but will not be deep because in MACD both lines are rising in positive zone.

Nifty-Last 4 Sessions intraday
charts analysis
Nifty-Intra Day Chart (Jan 04 to Jan 07,2022):-
Technical Patterns formation in last 4 Sessions intraday charts

1- Selling(Resistances) in last 4 Sessions are as follows:-
A- 17854-17905 
B- 17921-17944  
2- Consolidation(Supports) in last 4 Sessions are as follows:-
A- 17656-17727 
3- Last 4 Sessions actual trading between 17594-17944 

Conclusions from 4 Sessions
intra day chart analysis 

Last 4 Sessions sideways trading between 17594-17944 with above mentioned supports and resistances. As lower levels supports and higher levels resistances are almost equal stronger therefore Nifty will firstly trade and prepare for next decisive moves beginning within last 4 Sessions trading range(17594-17944),finally sustaining it beyond will confirm it hence should be firstly watched in next week for fate of that Pull Back rally which begun from 16410.20 on 20-12-2021.

Nifty-Intra Day Chart Analysis
(07-Jan-2022)
Nifty-Intra Day Chart (07-Jan-2022):-
Technical Patterns formation in today intraday charts

1- Selling between 17854-17905
2- Down moves with upward corrections
3- Up moves in Bearish Rising Channel
4- Whole day actual trading between 17705-17905

Conclusions from intra day chart analysis 

Although firstly 159 points up moves after positive opening but higher levels selling developed and after that follow up selling was also seen through Down moves with upward corrections therefore Nifty traded in negative zone also after loosing all first 2 hours intraday gains.

As Up moves in Bearish Rising Channels were also seen in last 3 hours therefore whole day good intraday selling will be understood last Friday and down moves will be seen below last Friday lowest(17705) in next week. 

Conclusions
(After putting all studies together)

All the trends have turned up during on going Pull Back rally and no confirmation of its completion yet but firstly its correction is expected in next week because:-

1- Higher levels good intraday selling was seen in previous week.
2- Stochastic is showing negative divergence and its both lines are falling in overbought zone.

Firstly above mentioned last 4 sessions supports and after that following supports below last 4 sessions lowest(17594) should be watched in next week because slipping below it will also be seen during on going Pull Back Rally expected correction:- 

1- 17177-17233
2- 16884-17093
3- 16820-16918
4- 16739-16782
5- 16411-16530
Today support levels will confirm 
size of correction
Nifty-Intra Day Chart (06-Jan-2022):-
Technical Patterns formation in today intraday charts

1- 250 Points crash in first 20 minutes
2- Support between 17656-17727
3- Volatility in last hours between 17730-17789
4- Whole day actual trading between 17656-17797

Conclusions from intra day chart analysis 

As Short Term indicators have turned completely Overbought and intraday selling patterns were also seen yesterday therefore 250 points crash in first 20 minutes but after that somo supports at lower levels hence some up moves developed in last hours which also could not sustain.

Correction of Pull Back rally begun today and today support levels(17656-17727) will confirm the size of that correction which has begun today.
 Remain cautious and watch 
sustaining beyond 18000
Nifty-Intra Day Chart Analysis & 
Market Outlook(06-01-2022)
Nifty-Intra Day Chart (05-Jan-2022):-
Technical Patterns formation in today intraday charts

1- 70 Points sharp fall after positive opening 
2- Down moves in Bullish Falling Channel 
3- Up moves in Bearish Rising Channel
4- Downward corrections
5- Whole day actual trading between 17748-17944

Conclusions from intra day chart analysis 

Although positive opening but immediately after that 70 points sharp fall was also seen. As equally sharp recovery also from lower levels and after that consolidation through Down moves in Bullish Falling Channel therefore rally remained continued till last minutes.

As some selling was also seen through Up moves in Bearish Rising Channel therefore view will be cautious despite continuous consolidation was also seen through downward corrections.   
Short Term indicators have turned completely Overbought and intraday selling patterns were also seen today therefore if fresh selling develops tomorrow then correction of on going Pull Back rally will begin hence remain cautious and firstly watch sustaining beyond next psychological level of 18000 in the coming sessions. 
 Rally continuation and correction only after Fresh selling patterns formations
Nifty-Intra Day Chart Analysis & 
Market Outlook(05-01-2022)
Nifty-Intra Day Chart (04-Jan-2022):-
Technical Patterns formation in today intraday charts

1- Sharp fall after gap up opening
2- Down moves in Bullish Falling Channels
3- Strong up moves in last hours
4- Whole day actual trading between 17594-17827

Conclusions from intra day chart analysis 

As US markets closed with good gains yesterday therefore most Asian markets were also trading strong hence gap up opening of Indian markets but firstly 85 Points fall was seen in first half hour but immediate after that Nifty jumped more tha 100 points from lower levels.

Consolidation developed in Mid-session through  Down moves in Bullish Falling Channels therefore strong up moves in last hour were seen in last hour.

Although Short term indicators have turned Over bought but intraday charts have not shown selling patterns yet therefore some more up moves can not be ruled. Let selling patterns develop then correction will be considered and since then rally continuation will be expected.
 Correction only after complete fresh selling patterns formations
Nifty-Intra Day Chart Analysis & 
Market Outlook(04-01-2022)
Nifty-Intra Day Chart (03-Jan-2022):-
Technical Patterns formation in today intraday charts

1- Whole day up moves with downward corrections
2- Last hour sideways trading between 17608-17646
3- Whole day actual trading between 17384-17646

Conclusions from intra day chart analysis 

As Dow Jones Futures was trading more than 125 points up therefore following lines were told at 09:57 AM on 03-01-2022 in " Firstly watch Next resistances between 17552-17639":-
Next resistances are between 17552-17639 and it will decide the life and length of on going Pull Rack Rally therefore sustaining it beyond should be firstly watched for its confirmations.

As Nifty traded last hour sideways within and near about next resistances(17552-17639) between 17608-17646 as well as closed within it at 17625.70 therefore firstly sustaining it beyond should be watched in the coming sessions for the life and length of on going Pull Rack Rally. As Whole day up moves were with downward corrections and selling patterns were not seen on 03-01-2022 therefore complete fresh selling patterns formations are firstly required  minimum on intraday charts for the correction beginning.
 Firstly watch Next resistances
between 17552-17639
Post-open Outlook(03-01-2022)

As Dow Jones Futures is trading more than 125 points up since today morning therefore sentiment boosted on new year 1st trading day and resultant strong opening of Indian markets.

Next resistances are between 17552-17639 and it will decide the life and lenth of on going Pull Rack Rally therefore sustaining it beyond should be firstly watched for its confirmations.

 Live proofs of our accuracy

Prediction of "Nifty maximum Target" 
at 18793

Prediction of "Nifty above 18000" 
one year before