Impulsive Wave-5 rally towards its maximum target at 18793 after Short Term correction completion
Technical Analysis,Research & Weekly Outlook
(Aug 09 to Aug 13,2021)
Nifty-EOD Chart Analysis
(Waves structure)
Nifty-EOD Chart (06-Aug-2021):-

Technical Patterns and Formations in EOD charts
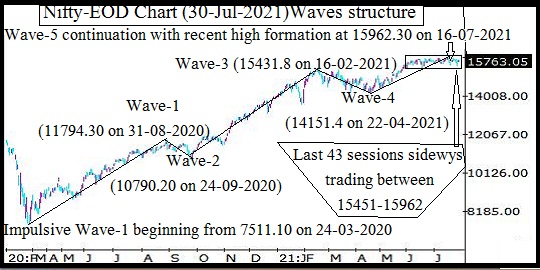
1- Corrective Wave-C completion and Impulsive Wave-1 beginning from 7511.10 on 24-03-2020
2- Impulsive Wave-1 completion at 11794.30 on 31-08-2020
3- Corrective Wave-2 completion at 10790.20 on 24-09-2020
4- Impulsive Wave-3 completion after new life time top formation at 15431.8 on 16-02-2021
5- Corrective Wave-4 completion at 14151.4 on 22-04-2021
6- Last 44 sessions sideways trading range(15451-15962) forcefully broken out on 03-08-2021
7- Impulsive Wave-5 continuation with recent high and new life time top formation at 16349.50 on 05-08-2021
Conclusions from EOD chart analysis
(Waves structure)
Impulsive Wave-5 continuation with recent high and new life time top formation at 16349.50 on 05-08-2021. As last 44 sessions like big sideways trading range(15451-15962) forcefully broken out in previous week on 03-08-2021 and no indication of impulsive Wave-5 completion yet on EOD charts therefore its continuation will be expected.
Nifty-EOD Chart Analysis
(MACD & Stochastic)
Nifty-EOD Chart (06-Aug-2021):-

Technical Patterns and Formations in EOD charts
1- Impulsive Wave-5 continuation with recent high and new life time top formation at 16349.50 on 05-08-2021
2- Stochastic- %K(5) is at 87.87 & %D(3) is at 92.89
3- Stochastic- %K(5) line has intersected %D(3) line downward and both lines are falling in Over bought zone.
4- In MACD- MACD line has intersected Average line upward and both lines are rising in positive zone.
5- Last 44 sessions sideways trading range(15451-15962) forcefully broken out on 03-08-2021
Conclusions from EOD chart analysis
(Stochastic & MACD)
As in Stochastic indicator %K(5) line has intersected %D(3) line downward and both lines are falling in Over bought zone therefore emergence of Short Term correction indications which may be seen in next week.
As in MACD indicator MACD line has intersected Average line upward and both lines are rising in positive zone therefore emergence of up trend formations signals.
Indicators are suggesting that finally up moves will be seen after next week Short Term correction.
Nifty-Last 3 Sessions
intraday charts analysis
Nifty-Intra Day Chart (Aug 04 to Aug 06,2021):-

Technical Patterns formation in last 3 Sessions intraday charts
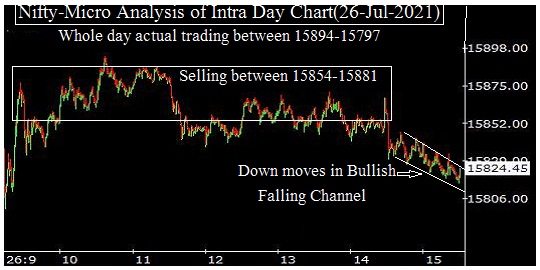
1- Selling between 16239-16290 on 04-08-2021
2- Consolidation between 16211-16275 on 05-08-2021
3- Sharp Up moves in Mid-session on 05-08-2021
4- Selling between 16306-16349 on 05-08-2021
5- Selling between 16302-16336 on 06-08-2021
6- Sharp fall on 06-08-2021
7- Selling between 16258-16283 on 06-08-2021
8- Down moves in Bullish Falling Channel in last hour on 06-08-2021
9- Last 3 Sessions actual trading between 16177-16349
Conclusions from 3 Sessions
intra day chart analysis
Last 44 sessions trading range(15451-15962) forcefully broken out on 04-08-2021 and after that last 3 sessions trading were sideways between 16177-16349 with higher levels good selling and lower levels some consolidation also. Although down moves were seen in last hour on 06-08-2021 but were in Bullish Falling Channel therefore lower levels sufficient good supports formations will also be considered in last 3 sessions.
As both lower levels consolidation and higher levels selling in last 3 sessions between 16177-16349 therefore firstly Nifty will have to trade and prepare for next Short Term trend within this range and finally sustaining beyond or forceful break out/down of this range will confirm it hence should be firstly watched in the beginning of next week.
Conclusions
(After Putting All Studies Together)
All the trends have turned up after forceful break out of last 44 sessions like big sideways trading range(15451-15962) in previous week and impulsive Wave-5 continuation confirmation towards its maximum target at 18793.00.
Calculation of maximum target of Nifty at 18793.00 is as follows:-
As per Elliott Wave theory "Wave-3 should not be shorter than both Wave-1 and Wave-5. Now impulsive Wave-5 is on and it should not gain more points than Wave-3 has gained.
Impulsive Wave-1 gained=4283.20 points(11794.30-7511.10)
Impulsive Wave-3 gained=4641.60 points(15431.80-10790.20)
Impulsive Wave-5 has gained 2198.10 points till 28-11-2020(16349.50-14151.40)
As according to Elliott Wave theory Wave-5 can not gain more points than Wave-3 gained therefore on going impulsive Wave-5 will gain lesser points than 4641.60.
Impulsive Wave-5 started from 14151.4 on 22-04-2021 and it has to gain less than 4641.60 points therefore maximum target of on going impulsive Wave-5 is 18793.00(14151.40+4641.60)
Although MACD is showing up trend formations but Stochastic is suggesting Short Term correction and intraday charts of last 3 sessions are also showing good selling therefore expected that firstly Short Term correction will be seen below last 3 sessions lowest(16177) and towards 16000 in next week as well as impulsive Wave-5 will start rally towards its maximum target at 18793.00 after correction completion.