ॐ ह्रीं श्रीं लक्ष्मीभयो नमः॥


Trading "calls" from our "Software" with more than "90% accuracy"

More than "12 years" old "only site of whole world" 
with more than "9700 accurate Outlooks" of 
"Indian Stock Markets" 
 Finally crucial level will confirm next long Term trend/big moves
Technical Analysis,Research & 
Weekly Outlook(Jul 26 to Jul 30,2021)
Nifty-EOD Chart Analysis
(MACD & Stochastic)
Nifty-EOD Chart (23-Jul-2021):-
Technical Patterns and Formations in EOD charts

1- Impulsive Wave-5 continuation with recent high and new life time top formation at 15962.30 on 16-07-2021
2- Stochastic %K(5) is at 50.08 & %D(3) is at 40.57
3- Stochastic- %K(5) line has intersected %D(3) line upward while %K is rising and %D is falling.
4- In MACD- MACD line  has intersected Average line downward and both lines are moving straight near Zero line for the last 7 sessions 
6- Last 38 sessions sidewys trading between 15451-15962 from 01-06-2021 to 23-07-2021
 
Conclusions from EOD chart analysis
(Stochastic & MACD)

Although in Stochastic %K(5) line has intersected %D(3) line upward but %K is rising and %D is falling therefore no clear indication from this indicator

Although in MACD indicator MACD line downward intersection of Average line but both lines are moving straight near Zero line for the last 7 sessions therefore this indicator is also not showing any direction at this moment

Last 38 sessions sideways trading between 15451-15962 with lower levels supports and higher levels resistances therefore Nifty will firstly trade within this range in next week and finally sustaining beyond this range will generate big moves which should be watched in the coming week/weeks.
Nifty-Last 14 Sessions intraday 
charts analysis
Nifty-Intra Day Chart (Jul 05 to Jul 23,2021):-
Technical Patterns formation in last 14 Sessions intraday charts

1- Selling(Resistances) in last 14 Sessions are as follows:-
A- 15921-15962   
2- Consolidation(Supports) in last 14 Sessions are as follows:-
A- 15653-15687 
B- 15579-15620 
3- Supports below last 14 Sessions lowest(15579) are as follows
A- 15542-15579
B- 15460-15537(Strong supports)
4- Last 14/23 Sessions sideways trading between 15579-15962 

Conclusions from 14/23 Sessions 
intra day chart analysis 

Last 14/23 Sessions sideways trading between 15579-15962 with above mentioned supports and resistances within it. As supports below last Friday lowest and resistances above last Friday highest are equally strong therefore expected that Nifty will firstly trade and prepare for next trend within last 14/23 sessions trading range(15579-15962) and finally sustaining it beyond will generate first strong signal of next trend which should be firstly watched in next week.
Nifty-Intra Day Chart 
Analysis(23-Jul-2021)
Nifty-Intra Day Chart (23-Jul-2021):-
Technical Patterns formation in today intraday charts

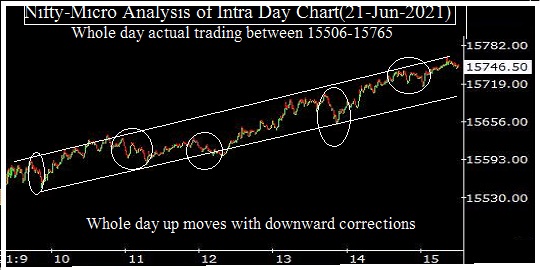
1- Volatility in first 2 hours after positive opening
2- Up moves in Bearish Rising Channels
3- Slipping from higher levels in last hour
4- Whole day actual trading between 15769-15899

Conclusions from intra day
chart analysis 

Although positive opening but immediately slipping into negative zone and after that volatility was also seen in first 2 hours. As all the up moves were in Bearish Rising Channels therefore Nifty slipped from higher levels in last hour. Although positive closing last Friday with 0.20% gains but selling was also seen therefore fresh consolidation is firstly required in next week for decisive up moves above last Friday highest(15900) and if fresh selling develops in the beginning of next week then Short Term correction will be seen towards 15579. 

Conclusions
(After Putting All Studies Together)

1- Long Term Trend is up
2- Intermediate Term Trend is sideways between 15451-15962 for the last 38 sessions 
3- Short Term Trend is sideways between 15579-15962 for the last 23 sessions 

Last 38 sessions like big sideways trading between 15451-15962 and Short Term indicators are not suggesting any side direction therefore it will be understood that at present Nifty is not prepared for any side big decisive moves and will have to prepare for that which will be firstly done between 15451-15962 in next week/weeks. It should be kept in mind that forceful break out/down or sustaining beyond last 38 sessions trading range is must for next trend and big moves confirmations therefore it has to be watched for confirmations.

Next supports and resistances between last 38 sessions trading range(15451-15962) has been updated above:-  

1- As Only 1 resistance above last Friday highest therefore fresh consolidation in next week will mean high possibility of strong rally above 15962 
2- but complete selling is required for deeper correction beginning below 15451 because multiple 4 supports are lying below last Friday lowest.

Last 38 sessions like big trading range(15451-15962) has become crucial level and will finally confirm next long Term trend/big moves therefore:-

1- until Nifty is sideways between 15451-15962 till then Short/Intermediate Term view should be of within this range,
2- Let Nifty to sustain beyond 15451-15962 or its forceful break out/down happen then Long term view confirmation should be according to its break out/down direction. 
As going out of station to attend 
a marriage therefore
1- Perhaps will be able to post Outlooks from or after 19-07-2021.
but 
2- will post uninterrupted positively from 26-07-2021.
Finally 15845-15877 will confirm the fate of on going rally
Nifty-Intra Day Chart Analysis & 
Market Outlook(15-07-2021)
Nifty-Intra Day Chart (14-Jul-2021):-
Technical Patterns formation in today intraday charts

1- Down moves in Bullish Falling Channel
2- Sharp up
3- Up moves with downward corrections
4- Mixed Patterns formation between 15845-15877
5- Whole day actual trading between 15764-15877

Conclusions from intra day chart analysis 

Although firstly Very Short Term correction through down moves were seen but were in  Bullish Falling Channel therefore Nifty moved up sharply. As Mid sesssion up moves with downward corrections and last 3 hours trading with Mixed Patterns formation between 15845-15877 therefore Nifty will have to trade and prepare for next decisive moves between and near about 15845-15877 and finally sustaining it beyond will confirm the fate of on going rally.
Very Short Term correction expectations
Nifty-Intra Day Chart Analysis & 
Market Outlook(14-07-2021)
Nifty-Intra Day Chart (13-Jul-2021):-
Technical Patterns formation in today intraday charts

1- Consolidation between 15745-15774
2- Up moves with downward corrections
3- Whole day actual trading between 15745-15820

Conclusions from intra day chart analysis 

As 4 hours selling between 15750-15789 yesterday therefore firstly Nifty consolidated in first 2 hours within and near about it and then after that up moves started. Although last 4 hours up moves with downward corrections but Very Short Term indicators have turned overbought and multiple resistances are lying above today highest  between 15828-15911 therefore Very Short Term correction is expected tomorrow.
 Break out of 15645-15789 will generate next decisive moves 
Nifty-Intra Day Chart Analysis & 
Market Outlook(13-07-2021)
Nifty-Intra Day Chart (12-Jul-2021):-
Technical Patterns formation in today intraday charts

1- First 4 hours selling between 15750-15789
2- Sharp fall
3- Down moves in Bullish Falling Channel
4- Up moves in last hour
5- Whole day actual trading between 15645-15789

Conclusions from intra day chart analysis 


up moves will be seen above last Friday highest(15730) in the beginning of next week.

As was told 100% same happened and up moves were seen after strong opening today but selling developed in first 4 hours therefore fallen Sharply in Mid-session. 

As higher levels good selling below 15789 in first 4 hours and lower levels good consolidation also in last hours above 15645 therefore it will be understood that Nifty is technically not prepared for one sided decisive moves and firstly Nifty will have to trade and prepare for next one sided big moves within and near about today trading range(15645-15789),let Nifty prepare then finally sustaining it beyond or forceful break out/down will generate next decisive moves in the coming sessions.
Crucial levels break out/down will confirm Strong rally or Deeper correction
Technical Analysis,Research & Weekly Outlook
(Jul 12 to Jul 16,2021)
Nifty-EOD Chart Analysis 
(Waves structure)
Nifty-EOD Chart (09-Jul-2021):-
Technical Patterns and Formations in EOD charts

1- Corrective Wave-C completion and Impulsive Wave-1 beginning from 7511.10 on 24-03-2020  
2- Impulsive Wave-1 completion at 11794.30 on 31-08-2020
3- Corrective Wave-2 completion at 10790.20 on 24-09-2020
4- Impulsive Wave-3 completion after new life time top formation at 15431.8 on 16-02-2021
5- Corrective Wave-4 completion at 14151.4 on 22-04-2021
6- Impulsive Wave-5 continuation with recent high and new life time top formation at 15915.60 on 28-06-2021.
7- Last 29 sessions sidewys trading between 15451-15915 from 01-06-2021 to 09-07-2021
 
Conclusions from EOD chart analysis
(Waves structure)

Impulsive Wave-5 continuation with new life time top formation at 15915.60 on 28-06-2021 and no indication of its completion yet on EOD charts. As last 29 sessions like big sideways trading between 15451-15915 and Nifty is preparing for next big moves within this range therefore finally break our/down of this range will form next trend.

Nifty-Last 14 Sessions 
intraday charts analysis
Nifty-Intra Day Chart (Jun 22 to Jul 09,2021):-
Technical Patterns formation in last 14 Sessions intraday charts

1- 4 Times resistances above 15880 in last 14 Sessions are as follows:-
A- 15895.8 on 22-06-2021 
B- 15915.6 on 28-06-2021   
C- 15914.2 on 06-07-2021
D- 15893.5 on 07 & 08-07-2021   
2- 3 Times supports below 14700 in last 14 Sessions are as follows:-
A- 15674 on 23-06-2021
B- 15636 on 02-07-2021
C- 15632.8 on 09-07-2021
3- 14 Sessions actual trading between 15636-15915 

Conclusions from 14 Sessions intra day chart analysis 

Extreme sideways trading within 279 points in last 14 sessions between 15636-15915 and surprisingly Nifty got 3 times supports below 14700 and faced 4 times resistance also above 15880 therefore it will be understood that Nifty is trading within this range for a big move and finally sustaining it beyond will confirm:-

1- Strong rally beginning above 15915.    
2- First strong signal of Short Term correction beginning below 15636.

Nifty-Intra Day Chart Analysis
(09-Jul-2021)
Nifty-Intra Day Chart (09-Jul-2021):-
Technical Patterns formation in today intraday charts

1- Up moves with downward corrections
2- Down moves in Bullish Falling Channel
3- Consolidation between 15651-15707
4- Whole day actual trading between 15633-15730

Conclusions from intra day chart analysis 

Although whole day negative zone trading and Red closing also last Friday but selling patterns were not seen and on the contrary consolidation developed through above mentioned manner hence up moves will be seen above last Friday highest(15730) in the beginning of next week.

Conclusions (After Putting 
All Studies Together)

1- Long Term Trend is up
2- Intermediate Term Trend is sideways between 15451-15915 for the last 29 sessions 
3- Short Term Trend is sideways between 15636-15915 for the last 14 sessions 

Next resistances(within last 29 sessions range) above last Friday closing are as follows:-

A- 15828-15842  
B- 15845-15871
C- 15873-15911

Next supports(within last 29 sessions range) below last Friday closing are as follows:-

A- 15651-15682
B- 15618-15647
C- 15542-15586
D- 15460-15537(Strong supports)

Indian markets are Bullish and Long Term Trend is up but sideways trading between 15451-15915 with above mentioned supports and resistances within this last 29 sessions like big crucial trading range. As both supports and resistances are equally strong within this range therefore Nifty will have to trade and prepare for next decisive moves within it in the coming week.

It is confirm that until Nifty will not completely prepare for those one sided big decisive moves till then this range(15451-15915) will not be broken out/down. Let Nifty prepare then finally sustaining beyond or forceful break out/down of this range should be firstly watched in the coming week/weeks for:-

1- Strong rally above 15915. 
or 
2- Deeper correction below 15451.
 Firstly watch 15682-15885 for the life of today started correction
Nifty-Intra Day Chart Analysis & 
Market Outlook(09-07-2021)
Nifty-Intra Day Chart (08-Jul-2021):-
Technical Patterns formation in today intraday charts

1- Whole day Down moves with upward corrections
2- Support between 15682-15730
3- Whole day actual trading between 15682-15885

Conclusions from intra day chart analysis 

Although Nifty closed at day's top and life time highest also yesterday but we were cautions because selling was also seen in last hours therefore we told following lines yesterday in "Firstly watch today highest for Rally above new Life time highest":-

1- fresh consolidation is firstly required tomorrow for rally above today highest
2- firstly sustaining above it should be watched tomorrow for rally continuation above new life time highest.

As follow up selling developed today therefore down moves remained continued with upward corrections. Lower levels some supports was also seen in last hours between 15682-15885 which should be firstly watched tomorrow for the life of today started correction.
 Firstly watch today highest for Rally above new Life time highest
Nifty-Intra Day Chart Analysis & 
Market Outlook(08-07-2021)
Nifty-Intra Day Chart (07-Jul-2021):-
Technical Patterns formation in today intraday charts

1- Consolidation between 15797-15820
2- Consolidation between 15814-15845
3- Up moves in Bearish Rising Channels
4- Whole day actual trading between 15780-15893

Conclusions from intra day chart analysis 

Although weaker opening but firstly more than 4 hours consolidation was seen therefore up moves remain continued till last minutes and closing was near the higher levels of the day.

As some selling was also seen in last hours through up moves in Bearish Rising Channels therefore fresh consolidation is firstly required tomorrow for rally above today highest and firstly sustaining above it should be watched tomorrow for rally continuation above new life time highest.
Down moves towards next supports
Nifty-Intra Day Chart Analysis & 
Market Outlook(07-07-2021)
Nifty-Intra Day Chart (06-Jul-2021):-
Technical Patterns formation in today intraday charts

1- Up moves in Bearish Rising Channels
2- Selling between 15876-15914 
3- Sharp down moves in last 2 hours
4- Whole day actual trading between 15801-15914

Conclusions from intra day chart analysis 

Multiple resistances were updated between 15810-15894 yesterday and fresh selling was seen within it today therefore Sharp down moves in last 2 hours and no consolidation pattern formations hence more down moves will be seen below 15801 and towards following next supports:-

1- 15656-15709
2- 15618-15647
3- 15542-15586
15803-15845 will confirm 
next decisive moves
Nifty-Intra Day Chart Analysis & 
Market Outlook(06-07-2021)
Nifty-Intra Day Chart (05-Jul-2021):-
Technical Patterns formation in today intraday charts

1- Sharp up after gap up opening 
2- More than 6 hours trading between 15803-15845 with Up moves in Bearish Rising Channels and downward corrections
3- Whole day actual trading between 15763-15845

Conclusions from intra day chart analysis 


1- Short Term up moves are on cards.
2- up moves are expected in the beginning of next week above last 2 sessions highest(15755)
3- up moves are expected in the beginning of next week.
4- Selling(Resistances) in last 24 Sessions  are as follows:-
A- 15810-15839  
B- 15840-15874
C- 15873-15894

As was told on 03-07-2021 and 100% same happened today firstly through sharp up after gap up opening and after that more than 6 hours trading within and near about above mentioned 1st resistance range between 15803-15845.

As both selling through Up moves in Bearish Rising Channels and consolidation also was seen with downward corrections in last 6 hours today therefore Nifty will firstly trade between 15803-15845 tomorrow and finally sustaining it beyond will confirm next decisive moves beginning hence should be firstly watched for:- 

1- Decisive up moves beginning above 15845 but firstly more consolidation is required because above mentioned 2 resistances are lying above it. 
2- Sustaining below 15803 will mean sharp fall.
 Last 24 Sessions trading range break out will confirm more than 3% one sided big moves
Technical Analysis,Research & 
Weekly Outlook(Jul 05 to Jul 09,2021)
Nifty-EOD Chart Analysis
(MACD & Stochastic)
Nifty-EOD Chart (02-Jul-2021):-
Technical Patterns and Formations in EOD charts

1- Impulsive Wave-5 continuation with recent high and new life time top formation at 15915.60 on 28-06-2021
2- Stochastic %K(5) is at 14.95 & %D(3) is at 20.84
3- Stochastic- %K(5) line has intersected %D(3) line downward and both lines are falling towards Oversold zone
4- In MACD- MACD line  has intersected Average line downward and both lines are falling in positive zone.
6- Last 24 sessions sidewys trading between 15451-15915 from 01-06-2021 to 02-07-2021
 
Conclusions from EOD chart analysis
(Stochastic & MACD)

As in Stochastic both %K(5) & %D(3) have moved into Oversold zone therefore signalling that Short Term up moves are on cards.

In MACD both lines are falling after MACD line downward intersection of Average line therefore showing downward trend and no indication of upward trend formation.

Last 24 sessions sideways trading between 15451-15915 with lower levels supports and higher levels resistances of last Friday closing therefore Nifty will firstly trade within this range in next week and finally sustaining beyond this range will generate big moves which should be watched in the coming week/weeks.

Nifty-Last 24 Sessions 
intraday charts analysis
Nifty-Intra Day Chart (Jun 01 to Jul 02,2021):-
Technical Patterns formation in last 24 Sessions intraday charts

1- Selling(Resistances) in last 24 Sessions  are as follows:-
A- 15810-15839  
B- 15840-15874
C- 15873-15894
2- Consolidation(Supports) in last 24 Sessions are as follows:-
A- 15656-15709
B- 15618-15647
C- 15542-15586
D- 15460-15537(Strong supports)
3- Sideways trading in last 24 Sessions are between 15451-15915

Conclusions from 24 Sessions 
intra day chart analysis 

As good intraday consolidation in last 2 sessions therefore Nifty closed near the top of last 2 sessions and some up moves will be seen in the beginning of next week also but above mentioned multiple and strong resistances are lying above 15810 hence complete fresh consolidation is firstly required for sustining and decisive up moves above 15915.

Above mentioned equally strong supports are below last Friday closing also therefore Nifty will trade and prepare for next trend within last 24 sessions trading range in the next week and finally sustaining it beyond or forceful break out of 15451-15915 will form next big moves hence should be firstly watched in next week/weeks for its confirmations 

Nifty-Last 2 Sessions 
intraday charts analysis
Nifty-Intra Day Chart (Jul 01 & Jul 02,2021):-
Technical Patterns formation in last 24 Sessions intraday charts

1- Down moves in Bullish Falling Channels on 01-07-2021
2- Up moves with downward corrections on 01-07-2021
3- Sharp fall on 02-07-2021  
4- Down moves in Bullish Falling Channels on 02-07-2021
5- Up moves with downward corrections on 02-07-2021
6- Last 2 Sessions actual trading between 15626-15755 

Conclusions from 2 Sessions
intra day chart analysis 

Although sharp fall on 02-07-2021 but most of the time consolidation was seen in last 2 sessions through Down moves in Bullish Falling Channels and Up moves with downward corrections therefore up moves are expected in the beginning of next week above last 2 sessions highest(15755) and towards next resistances.

Conclusions
(After Putting All Studies Together)

1- Long Term Trend is up
2- Intermediate Term Trend is up
3- Short Term Trend is sideways between 15451-15915 for the last 24 sessions 

Although previous week opening was with new life time highest formation at 15915.60 on 28-06-2021 but after that whole week intrday down moves were seen with higher levels selling and Weekly lowest formation last Friday also. 

As Short Term indicator Stochastic has moved into Oversold zone and lower levels consolidation also developed in last 2 sessions hence up moves are expected in the beginning of next week.

Last 24 Sessions sideways trading between 15451-15915 and above mentioned equally strong supports and resistances are also lying below and above last Friday closing therefore Nifty will firstly trade and prepare for the next big moves within this range. Let Nifty to sustain beyond or forceful break out of 15451-15915 then more than 3% one sided big moves will be seen in the coming week/weeks.

 As out of station therefore Stock Market Outlook of today(02-07-2021) is not being updated.

Sustaining below 15700 will confirm 
decisive down moves 
Mid-session Outlook(01-07-2021)

Although Nifty slipped below 15709 and now trading also below 15700 but Down moves are being seen in Bullish Falling Channel also therefore firstly sustaining below 15700 should be watched for decisive down moves confirmations.
 Levels will confirm next 
decisive moves
Nifty-Intra Day Chart Analysis & 
Market Outlook(01-07-2021)
Nifty-Intra Day Chart (30-Jun-2021):-
Technical Patterns formation in today intraday charts

1- Up moves in Bearish Rising Channel
2- Selling between 15810-15839 
3- Down moves in Bullish Falling Channel
4- Whole day actual trading between 15709-15839

Conclusions from intra day chart analysis 

As firstly up moves in Bearish Rising Channel and after that good selling between 15810-15839 therefore down moves were seen till last minutes. Although closing was near lower levels of the day but some consolidation will also be understood in last 2 hours because Down moves were in Bullish Falling Channel during this period.

Expected that Nifty will firstly trade between 15709-15810 and follow up moves within this range will decide next trend but until complete consolidation will not develop till then decisive up moves will be not seen above 15810 and fresh selling with sustaining below 15709  will mean sharp fall. 
 Fresh selling today will mean 
sharp fall
Nifty-Intra Day Chart Analysis & 
Market Outlook(30-06-2021)
Nifty-Intra Day Chart (29-Jun-2021):-
Technical Patterns formation in today intraday charts

1- Selling between 15816-15835
2- Selling between 15759-15796
3- Support between 15725-15764
4- Whole day actual trading between 15725-15835

Conclusions from intra day chart analysis 

Although good selling at higher levels and negative closing also yesterday but some supports were seen at lower levels therefore firstly Nifty will trade and prepare for next decisive moves between 15725-15835.

As good selling at higher levels and if fresh selling develops today then sharp fall will be seen and its confirmation will be sustaining below yesterday lowest(15725)
15793-15851 will generate first signal of next decisive move beginning
Nifty-Intra Day Chart Analysis & 
Market Outlook(29-06-2021)
Nifty-Intra Day Chart (28-Jun-2021):-
Technical Patterns formation in today intraday charts

1- Volatility after opening 
2- Selling between 15840-15874
3- More than 3 hours sideways trading between 15793-15851
4- Whole day actual trading between 15793-15915

Conclusions from intra day chart analysis 

Firstly volatility after opening and after that selling developed therefore some down moves were seen. As FM Nirmala Sitaraman Press Conference was at 03:00 PM today therefore last more than 3 hours trading turned sideways between 15793-15851 and closing was also within it hence firstly sustaining beyond this range should be watched tomorrow for first signal of next decisive move beginning.
 Trading range will confirm next one sided big moves amid deeper correction possibility
Technical Analysis,Research & Weekly Outlook
(Jun 28 to Jul 02,2021)
Nifty-EOD Chart Analysis
(MACD & Stochastic)
Nifty-EOD Chart (25-Jun-2021):-
Technical Patterns and Formations in EOD charts

1- Impulsive Wave-5 continuation with recent high and new life time top formation at 15901.60 on 15-06-2021
2- Stochastic %K(5) is at 73.43 & %D(3) is at 68.11
3-  Stochastic- %K(5) line has intersected %D(3) line upward and both lines are rising towards Overbought zone
4- In MACD- MACD line  has intersected Average line downward and both lines are falling in positive zone.
5- MACD is showing negative divergence
6- Up moves in Bearish Rising channel for the last 27 sessions from 20-05-2021
 
Conclusions from EOD chart analysis
(Stochastic & MACD)

As in Stochastic %K(5) line has intersected %D(3) line upward and both lines rising towards Overbought zone therefore some up moves can not be ruled out in the beginning of next week.

As MACD line  has intersected Average line downward and both lines are falling in positive zone as well as MACD is showing negative divergence therefore emergence of decisive down moves expectations in the coming week/weeks.

As up moves in Bearish Rising channel for the last 27 sessions from 20-05-2021 and its forceful break down/sustaining below of rising lower line will be deeper correction confirmation therefore remain cautious in the coming week/weeks despite without force new life time high formations possibilities.

Nifty-EOD Chart Analysis
(Bollinger Band)
Nifty-EOD Chart (25-Jun-2021):-
Technical Patterns and Formations in EOD charts

1- Bollinger Band squeezed
2- Last 19 sessions sideways trading between 15451-15901

Conclusions from EOD chart analysis
(Bollinger Band)

As Nifty is trading within 450 points for the last 19 sessions between 15451-15901 and volatility has fallen to lower levels therefore Bollinger Bands has narrowed and its Squeeze occurred. It has been observed that periods of lower volatility are often followed by periods of higher volatility therefore A new advance starts after break out above upper band or a new decline starts after break down below lower band.

Bollinger Band is showing that fresh one sided big moves are on cards and its confirmation will be break out/down of its upper/lower bands therefore it should be firstly watched in the coming week/weeks for these one sided big moves confirmations. 

As last 19 sessions sideways trading between 15451-15901 and last corner points of both lower and higher bands are lying within this range therefore finally sustaining beyond this range will also confirm these one sided big moves

Nifty-Intra Day Chart Analysis
(25-Jun-2021)
Nifty-Intra Day Chart (25-Jun-2021):-
Technical Patterns formation in today intraday charts

1- Down moves in Bullish Falling Channel
2- Consolidation between 15773-15807(immediate supports)
3- Up moves in Bearish Rising Channel
4- Last hour sideways trading between 15804-15870
5- Whole day actual trading between 15773-15870

Conclusions from intra day chart analysis 

Although firstly down moves after positive opening but were in Bullish Falling Channel and fresh consolidation therefore up moves were seen. As these Up moves were in Bearish Rising Channel therefore rally stopped and turned into sideways trading in last hour between 15804-15870. 

As both lower levels buying and some selling in Mid-session as well as sideways trading in last hour therefore last Friday trading will be understood with Mixed Patterns formation between 15773-15870.  

Expected that Nifty will firstly trade and prepare for next decisive moves within or near about last Friday trading range in the beginning of next week and finally sustaining it beyond will form next Short Term Trend therefore should be firstly watched in the coming sessions.

Conclusions
(After Putting All Studies Together)

All trends are up and Bullish rally continuation with 2nd highest closing last Friday which is only 8 points below previous life time highest closing. 

Although trend decider MACD is showing downward trend and down moves beginning possibilities also because negative divergence has also developed in this indicator but Short Term indicator Stochastic is telling for immediate up moves possibilities which may also be seen in the beginning of next week because clear consolidation patterns were seen in last Friday intraday charts and clear selling patterns were not seen in it. 

As squeezed Bollinger Band is suggesting that one sided big moves may start toward the direction of its upper/lower Bands break out but remain cautious because up moves in Bearish Rising channel are been seen for the last 27 sessions from 20-05-2021 and its rising lower line break down will generate deeper correction. 

Importance of last 19 sessions sideways trading range(15451-15901) has been increased because squeezed Bollinger Band formation is also lying within this range and sustaining beyond this range will be  Bollinger Bands break out/down confirmation also therefore should be firstly watched in the coming week/weeks for the next one sided big moves confirmations amid deeper correction possibility after last 27 sessions Up moves in Bearish Rising channel.
 15821 will confirm rally 
towards next resistances
Nifty-Intra Day Chart Analysis & 
Market Outlook(25-06-2021)
Nifty-Intra Day Chart (24-Jun-2021):-
Technical Patterns formation in today intraday charts

1- Consolidation between 15720-15761(immediate supports)
2- Up moves with downward corrections
3- Volatility in last hour
4- Whole day actual trading between 15703-15821

Conclusions from intra day chart analysis 

As higher levels selling in last 2 sessions therefore firstly sideways consolidation after positive opening and after that follow up consolidation through Up moves with downward corrections. Last hour was highly volatile and technical positions changes also during such volatility as well as selling lying above today highest therefore sustaining above today highest should be only watched tomorrow for up moves continuation towards next resistances(15873-15894)
15674 will confirm correction 
towards next supports
Nifty-Intra Day Chart Analysis & 
Market Outlook(24-06-2021)
Nifty-Intra Day Chart (23-Jun-2021):-
Technical Patterns formation in today intraday charts

1- Selling between 15781-15820
2- Selling between 15732-15783
3- Minor supports in last hour between 15674-15707
4- Whole day actual trading between 15674-15862

Conclusions from intra day chart analysis 

Following 3 resistances were posted on 19-06-2021 in "Crucial level will confirm next trend":-

A- 15716-15744(Strong resistances)
B- 15770-15835 
C- 15873-15894

Nifty hovered around above 3 resistances in last 2 sessions and closed below it at 15686.95 today after fresh selling in both previous sessions therefore these 3 resistances have been strengthened and until complete consolidation will not develop till then Nifty will not sustain above 15900.

As minor supports were seen in last hour between 15674-15707 therefore only sustaining below it should be watched tomorrow for correction continuation towards following next supports:-

A- 15618-15647
B- 15542-15586
C- 15460-15537(Strong supports)

 As busy therefore Stock Market Outlook of today(23-06-2021) is not being updated.

Rally continuation towards  
next resistance
Nifty-Intra Day Chart Analysis & 
Market Outlook(22-06-2021)
Nifty-Intra Day Chart (21-Jun-2021):-
Technical Patterns formation in today intraday charts

1- Whole day up moves with downward corrections
2- Whole day actual trading between 15506-15765

Conclusions from intra day chart analysis 

Following resistances were posted on 19-06-2021 in "Crucial level will confirm next trend":-

A- 15716-15744(Strong resistances)
B- 15770-15835 
C- 15873-15894

As whole day up moves with downward corrections and selling patterns were not seen as well as today closing was above 1st resistance therefore rally continuation will be seen towards above mentioned next 2nd resistance.