Market Outlook for 10-12-2020 has been updated below but will not be able to post Outlook for 11-12-2020 because I shall be busy in a marriage.

ॐ ह्रीं श्रीं लक्ष्मीभयो नमः॥

Watch 2 levels for Short term correction beginning confirmation
Nifty-Intra Day Chart Analysis &
Market Outlook(10-12-2020)
Nifty-Intra Day Chart (09-Dec-2020):-

Technical Patterns formation in today intraday charts
1- Down moves in Bullish Falling Channels
2- Slow up moves
3- Selling between 13525-13548
4- Whole day actual trading between 13450-13548
Conclusions from intra day chart analysis
As firstly more than 3 hours consolidation through Down moves in Bullish Falling Channels therefore after that up moves were seen which were slow and some selling was also seen at higher levels hence firstly Nifty has to consolidate within and near about today trading range for decisive up moves above today highest(13548).
Some selling was also seen through slow up moves and higher levels selling also in last hour therefore sustaining below 13525 will mean first signal of Short term correction beginning and confirmation will be after sustaining below today lowest(13450) hence these 2 levels should be firstly watched tomorrow for it.
Levels will confirm Short Term correction after selling process beginning
Nifty-Intra Day Chart Analysis &
Market Outlook(09-12-2020)
Nifty-Intra Day Chart (08-Dec-2020):-

Technical Patterns formation in today intraday charts
1- Selling between 13409-13435
2- Sharp down
3- Slow up moves with intraday corrections
4- Whole day actual trading between 13312-13435
Conclusions from
intra day chart analysis
As selling in first 2 hours therefore sharp down moves were seen after that but slow up moves with intraday corrections in last 3 hours therefore finally concluded that today trading will be understood with Mixed patterns formation.
As selling patterns were seen in last 2 sessions therefore emergence of selling process beginning and if more selling develops in the coming 1/2 sessions then decisive down moves will start. Let more selling develop in the coming sessions then Short Term correction will be seen and its confirmation will be sustaining below 13312/13272.
Levels will confirm Short Term correction or rally continuation
Nifty-Intra Day Chart Analysis &
Market Outlook(08-12-2020)
Nifty-Intra Day Chart (07-Dec-2020):-

Technical Patterns formation in today intraday charts
1- Sideways trading between 13272-13320
2- Up moves in Bearish Rising Channels
3- Whole day actual trading between 13242-13366
Conclusions from intra day chart analysis
Although today closing was at the top of the day but intraday consolidation patterns were not seen and firstly 3 hours trading was sideways as well as last 3 hours selling patterns formations were through up moves in Bearish Rising Channels therefore if fresh selling develops tomorrow then Short Term correction will be seen.
Firstly sustaining beyond today highest(13366) and if sustains below today highest then sustaining beyond 13272-13366 should be watched tomorrow Short Term correction or rally continuation confirmations.
Rally continuation towards its immediate maximum target at 13777.75
Technical Analysis,Research & Weekly Outlook
(Dec 07 to Dec 11,2020)
Nifty-EOD Chart Analysis
(Waves structure)
Nifty-EOD Chart (04-Dec-2020):-

Technical Patterns and Formations in EOD charts
1- Impulsive Wave-1 beginning from 6825.80 on 29-02-2016 after 1 financial year(2015-16) correction completion.
2- Corrective Wave 2 beginning after Wave 1 completion at 8968.70 on 07-09-2016
3- Impulsive Wave 3 beginning after Corrective Wave-2 completion at 7893.80 on 26-12-2016
4- Corrective Wave 4 beginning after Wave 3 completion at 11760.20 on 28-08-2018
5- Impulsive Wave 5 beginning after Corrective Wave-4 completion at 10004.55 on 26-10-2018
6- Impulsive Wave-5 completion after new life time high formation at 12430.50 on 20-01-2020 and Wave-A of "corrective ABC Waves" beginning
7-Wave-A (11614.50 on 03-02-2020)
8-Wave-B (12246.70 on 14-02-2020)
9-Corrective Wave-C completion at 7511.10 on 24-03-2020.
10-Impulsive Wave-1 of new Waves structure begun at 7511.10 on 24-03-2020 which is in continuation with recent top formation at 13280.05 on 04-12-2020
Conclusions from EOD chart analysis
(Waves structure)
Waves structure which started from 6825.80 on 29-02-2016 completed its impulsive moves after 5th wave completion at 12430.50 on 20-01-2020 and Wave-A of "corrective ABC Waves" started.
Wave-C of "ABC" correction completed at 7511.10 on 24-03-2020 and new waves structure begun which is in continuation with recent top formation at 13280.05 on 04-12-2020.
Nifty-EOD Chart Analysis
(2020 Rally Waves structure)
Nifty-EOD Chart (04-Dec-2020):-

Technical Patterns and Formations in EOD charts
1- Corrective Wave-C completion and Impulsive Wave-1 beginning from 7511.10 on 24-03-2020
2- Wave-1(9889.05 on 30-04-2020)
3- Wave-2(8806.75 on 18-05-2020)
4- Wave-3(11794.30 on 31-08-2020)
5- Wave-4(10790.20 on 24-09-2020)
6- Impulsive Wave-5 continuation with recent top formation at 13280.05 on 04-12-2020
Conclusions from EOD chart analysis
(2020 Rally Waves structure)
Corrective Wave-C completed and Impulsive Wave-1 started from 7511.10 on 24-03-2020. Now its impulsive Wave-5 is in continuation with recent top formation at 13280.05 on 04-12-2020 and no indication of its completion yet.
Nifty-Weekly Chart Analysis
(Stochastic)
Nifty-Weekly Chart (04-Dec-2020):-

Technical Patterns and Formations in EOD charts
1- Corrective Wave-C completion and Impulsive Wave-1 beginning from 7511.10 on 24-03-2020
2- Impulsive Wave-5 continuation with recent top formation at 13280.05 on 04-12-2020
3- Stochastic at %K(5) is at 93.49 & %D(3) is at 93.93
Conclusions from Weekly chart analysis
(Stochastic)
Although Impulsive Wave-5 continuation with recent top formation at 13280.05 on 04-12-2020 and no indication of its completion yet on EOD and Weekly charts but Weekly Stochastic indicator is in Overbought zone therefore emergence of 1st indicator of correction beginning.
As %K has not intersected downward %D yet therefore more indications are required for Intermediate Term correction beginning.
Nifty-Intra Day Chart Analysis
(04-Dec-2020)
Nifty-Intra Day Chart (04-Dec-2020):-

Technical Patterns formation in today intraday charts
1- Up moves after positive opening
2- Down moves in Bullish Falling Channels
3- Up moves with downward corrections
4- Whole day actual trading between 13153-13280
Conclusions from intra day chart analysis
Firstly up moves after positive opening and after that Down moves in Bullish Falling Channels therefore finally up moves were seen in last hours which were with downward corrections.
As whole day consolidation through above mentioned intraday patterns formations and selling patterns were not seen last Friday therefore on going rally continuation is expected in the beginning of next week.
Conclusions
(After Putting All Studies Together)
1- Long term trend is up.
2- Intermediate term trend is up.
3- Short term trend is up.
Impulsive Wave-5 continuation with recent top formation at 13280.05 on 04-12-2020 and no indication of its completion yet on intraday,EOD and Weekly charts therefore rally continuation is expected in the beginning of next week.
Although Stochastic indicator is Overbought in EOD and Weekly charts but %K has not intersected downward %D in both therefore more some more indications are required for Short and Intermediate Term correction beginning.
As per Elliott Wave theory maximum target of on going impulsive Wave-5 of Nifty is at 13777.75. Its calculation is as follows:-
As per Elliott Wave theory "Wave-3 should not be shorter than both Wave-1 and Wave-5. Now impulsive Wave-5 is on and it should not gain more points than Wave-3 gained.
Impulsive Wave-1 gained=2377.95 points(9889.05-7511.10)
Impulsive Wave-3 gained=2987.55 points(11794.30-8806.75)
Impulsive Wave-5 has gained 2154.25 points till 04-12-2020(13280.05-10790.20)
As according to Elliott Wave theory Wave-5 can not gain more points than Wave-3 gained therefore on going impulsive Wave-5 will gain lesser points than 2987.55.
Impulsive Wave-5 started from 10790.20 on 24-09-2020 and it has to gain less than 2987.55 points therefore maximum target of on going impulsive Wave-5 is 13777.75(10790.20+2987.55)
As per above given calculation maximum target of on going impulsive Wave-5(rally) of Nifty is at 13777.75 but till now no selling patterns formations. If selling patterns develops on intraday,EOD and weekly charts in the coming week/weeks but without moving above 13777.75 then correction of whole rally which started from 7511.10 on 24-03-2020 will be considered.
Rally continuation towards its immediate maximum target 13777.75 is expected in next week.
Rally continuation expectations
Nifty-Intra Day Chart Analysis &
Market Outlook(04-12-2020)
Nifty-Intra Day Chart (03-Dec-2020):-

Technical Patterns formation in today intraday charts
1- Whole day down moves in Bullish Falling Channels
2- Whole day sideways trading between 13108-13180
3- Whole day actual trading between 13108-13180
Conclusions from intra day chart analysis
Following lines were told at 02:32 AM on 03-12-2020 in " Levels will confirm rally continuation or correction beginning":-
Expected that Nifty will firstly trade near about today highest and finally sustaining beyond 13070-13125 will confirm rally continuation or correction beginning
Yesterday highest was at 13128.50 and Nifty traded whole day sideways below and above it between 13108-13180 with consolidation through whole day down moves in Bullish Falling Channels therefore rally continuation is expected tomorrow and sustaining above 13180 will confirm strong up moves.
Levels will confirm rally continuation or correction beginning
Nifty-Intra Day Chart Analysis &
Market Outlook(03-12-2020)
Nifty-Intra Day Chart (02-Dec-2020):-

Technical Patterns formation in today intraday charts
1- Selling between 13070-13125
2- Sharp fall
3- Down moves in Bullish Falling Channel
4- Up moves with downward corrections
5- Whole day actual trading between 12984-13128
Conclusions from intra day chart analysis
As firstly more than 3 hours good selling therefore sharp fall after that but lower levels consolidation was seen through Down moves in Bullish Falling Channel. Although last hour up moves were with downward corrections and closing was at the top of the day but good selling was in first 3 hours therefore more consolidation is firstly required near about today lowest for immediate rally.
Expected that Nifty will firstly trade near about today highest and finally sustaining beyond 13070-13125 will confirm rally continuation or correction beginning which should be firstly watched tomorrow.
Short term correction expectations
Nifty-Intra Day Chart Analysis &
Market Outlook(02-12-2020)
Nifty-Intra Day Chart (01-Dec-2020):-

Technical Patterns formation in today intraday charts
1- Whole day up moves in Bearish Rising Channels
2- Whole day actual trading between 12963-13128
Conclusions from intra day chart analysis
As Dow John's Futures was trading more than 200 points up today morning and most Asian markets were also trading positive therefore positive opening of Indian markets.
Dow John's Futures remained moving up and most European were also trading with good gains hence whole day rally continuation as well as closing was near the top of the day but up moves were in Bearish Rising Channels therefore firstly consolidation is required for sustaining above today highest(13128) despite SGX Nifty now trading more than 70 points up above 13200.
As Short term indicators are over bought and today intraday charts are showing selling indications also therefore fresh selling and sustaining below today lowest will mean Short term correction beginning which is expected in the coming 1/2 sessions.
Firstly watch levels amid Short to Intermediate term correction beginning possibility
Technical Analysis,Research & Weekly Outlook
(Dec 01 to Dec 04,2020)
Nifty-EOD Chart Analysis
(2020 Rally Waves structure)
Nifty-EOD Chart (27-Nov-2020):-

Technical Patterns and Formations in EOD charts
1- Corrective Wave-C completion and Impulsive Wave-1 beginning from 7511.10 on 24-03-2020
2- Wave-1(9889.05 on 30-04-2020)
3- Wave-2(8806.75 on 18-05-2020)
4- Wave-3(11794.30 on 31-08-2020)
5- Wave-4(10790.20 on 24-09-2020)
6- Impulsive Wave-5 continuation with recent top formation at 13145.90 on 25-11-2020
Conclusions from EOD chart analysis
(2020 Rally Waves structure)
Corrective Wave-C completed and Impulsive Wave-1 started from 7511.10 on 24-03-2020. Now its impulsive Wave-5 is on with recent top formation at 13145.90 on 25-11-2020.
Nifty-EOD Chart Analysis
(Bearish Rising Wedge & Stochastic)
Nifty-EOD Chart (27-Nov-2020):-

Technical Patterns and Formations in EOD charts
1- Impulsive Wave-5 continuation with recent top formation at 13145.90 on 25-11-2020
2- Stochastic showing negative divergence with %K(5) is at 47.61 & %D(3) is at 59.42
Conclusions from EOD chart analysis
(Corrective Waves)
As Bearish Rising Wedge formations therefore signals developed of Short to Medium Term correction. Short Term indicator Stochastic is showing negative divergence and %K intersected %D downward therefore it is also indicating that Short Term correction is on cards.
Nifty-Last 9 Sessions
intraday charts analysis
Nifty-Intra Day Chart (Nov 17 to Nov 27,2020):-

Technical Patterns formation in last 9 Sessions intraday charts
1- Selling(Resistances) in last 9 sessions are between:-
A- 12965-13035
B- 13118-13145
2- Consolidation(Supports) in last 9 sessions are sessions:-
A- 12854-12887
B- 12791-12830
C- 12731-12772
3- 9 Sessions actual trading between 12731-13145
Conclusions from 9
Sessions intra day chart analysis
Although selling at higher levels but buying was also seen at lower levels in last 9 sessions therefore expected that Nifty will firstly trade and prepare for next Short to Medium Term trend in next week between 12731-13145 and finally sustaining it beyond will generate big moves which should be watched in the coming week/weeks.
Nifty-Intra Day Chart Analysis
(27-Nov-2020)
Nifty-Intra Day Chart (27-Nov-2020):-

Technical Patterns formation in today intraday charts
1- Down moves in Bullish Falling Channel
2- Selling between 12971-13035
3- Volatility in last hour between 12915-12983
4- Whole day actual trading between 12915-13035
Conclusions from intra day chart analysis
As firstly buying through Down moves in Bullish Falling Channel therefore some up moves were seen Mid-Session but good selling developed therefore last Friday trading will be understood with Mixed Patterns formation.
Although Volatility in last hour but no material change in intraday technical positions therefore sustaining beyond last Friday trading range(12915-13035) will generate first strong signal of next decisive moves beginning which should be firstly watched in next week amid downward moves possibility below 12915 because good selling in Mid-Session.
Conclusions (After Putting All Studies Together)
1- Long term trend is up.
2- Intermediate term trend is up
3- Short term trend is sideways between 12731-13145 for the last(9 Sessions)
Nifty will firstly trade between 12731-13145 in the coming 1/2 sessions on next week. As Bearish Rising Wedge formations and Short Term indicator Stochastic is also showing correction beginning signals therefore fresh selling and sustaining below 12731 will mean short Term correction towards next crucial supports between 12605-12690.
As sustaining below 11605 will confirm deeper correction possibility therefore must be finally watched in the situation of correction beginning.
Firstly watch sustaining beyond 12731-13145 amid Short to Intermediate term correction beginning possibility according to above given levels.
Watch 12791-13145 for next
Short Term Trend
Nifty-Intra Day Chart Analysis &
Market Outlook(27-11-2020)
Nifty-Intra Day Chart (26-Nov-2020):-

Technical Patterns formation in today intraday charts
1- Consolidation between 12791-12855
2- Consolidation between 12872-12925
3- Last hour Up moves in Bearish Rising Channel
4- Whole day actual trading between 12791-13018
Conclusions from intra day chart analysis
Although firstly slipping after positive opening but lower levels consolidation and after that follow up consolidation in Mid-session also therefore up moves remained continued till last minutes. As Last hour Up moves were in Bearish Rising Channel therefore higher levels some profit booking was also seen.
Selling was seen between 12965-13035 yesterday and some profit booking was within and near about this range today also therefore firstly fresh consolidation and after that sustaining above 13035 is required for next up moves.
As both lower levels buying and higher levels selling between 12791-13145 in last 2 sessions therefore Nifty will trade and prepare and prepare for next decisive moves within and near about this range in the coming 1/2 sessions and finally sustaining it beyond will generate next Short Term Trend which should be firstly watched.
Firstly watch next 3 supports for the life of today started Global markets led correction
Nifty-Intra Day Chart Analysis &
Market Outlook(26-11-2020)
Nifty-Intra Day Chart (25-Nov-2020):-

Technical Patterns formation in today intraday charts
1- Selling between 13118-13145(immediate Resistances)
2- Sharp fall
3- Selling between 12965-13035(immediate Resistances)
4- Sharp fall
5- Falling Wedge formation in last hour
6- Whole day actual trading between 12834-13145
Conclusions from intra day chart analysis
Although Asian markets were mixed but Indian markets opened strong and traded with good gains also. Some selling was seen in first hour but as soon as Dow's Futures started to slip then sharp fall was seen.
As follow up selling between 12965-13035 in Mid-session therefore again sharp fall after weaker opening of all European markets but some consolidation was seen in last hour through Falling Wedge formation.
Next supports below today closing are as follows:-
1- 12840-12886
2- 12737-12782
3- 12605-12690
As Dow Jones is now trading more than 175 points down and now a days all the Global markets are following US markets therefore firstly sustaining beyond above mentioned next 3 supports should be watched in the coming sessions for the life of today started Global markets led correction.
Rally continuation
Nifty-Intra Day Chart Analysis &
Market Outlook(25-11-2020)
Nifty-Intra Day Chart (24-Nov-2020):-

Technical Patterns formation in today intraday charts
1- Consolidation between 12978-13048
1- Up moves with downward corrections
3- Whole day actual trading between 12978-13079
Conclusions from intra day chart analysis
As Dow Jones closed 327 points up yesterday and its Futures was also trading with 245 points gains today morning therefore Nifty opened gap up strong above 13000 but consolidated below 13000 because some selling was seen at higher levels yesterday.
Firstly consolidation between 12978-13048 and after that whole day up moves with downward corrections therefore rally will remain continued. Until complete selling patterns will not develop on Intraday and EOD charts till then big correction will not seen,let it happen then firstly Short Term correction will be considered. As selling patterns were not seen today therefore on going rally will remain continued.
Levels will confirm fresh rally or Short Term Correction
Nifty-Intra Day Chart Analysis &
Market Outlook(24-11-2020)
Nifty-Intra Day Chart (23-Nov-2020):-

Technical Patterns formation in today intraday charts
1- Down moves in Bullish Falling Channels
2- Up moves in Bearish Rising Channels
3- Selling between 12941-12968
4- Whole day actual trading between 12826-12968
Conclusions from intra day chart analysis
Although strong gap up opening but not sustaining at higher levels and slipping to negative zone. As these one and half hour down moves were in Bullish Falling Channels therefore up moves started which remained continued towards new lifetime highest levels. These up moves were in Bearish Rising Channels and selling was seen at higher levels also therefore firstly fresh consolidation and after that sustaining above today highest is must for fresh rally above 13000.
As selling was seen above 12941 also on 19th Nov 2020 and today closing was below it therefore sustaining below it will generate first signal of Short Term Correction which should be firstly watched tomorrow.
Next supports below today lowest are as follows:-
1- 12840-12886
2- 12737-12782
3- 12605-12690
As above multiple supports below today closing therefore complete fresh selling is required for sustaining below these supports. Firstly sustaining beyond 12941-12968 should be watched tomorrow for fresh rally above 12968 and Short Term Correction below 12941.
Levels will confirm next
Short Term Trend
Nifty-Intra Day Chart Analysis &
Market Outlook(19-11-2020)
Nifty-Intra Day Chart (18-Nov-2020):-

Technical Patterns formation in today intraday charts
1- Consolidation between 12820-12887(immediate supports)
2- Slow up moves in last 2 hours
3- Whole day actual trading between 12820-12948
Conclusions from intra day chart analysis
As selling was seen between 12842-12865 yesterday therefore firstly Nifty consolidated within and near about this range today and after that up moves were seen.
Although today closing was at the top of the day and rally as well but some selling can not be ruled out in last 2 hours slow up moves amid heated sentiments therefore until Nifty will not sustain above today(12948) after fresh consolidation till then next immediate up moves will not be seen.
Expected that Nifty will firstly trade and prepare for next Short Term Trend within and near about 12798-12948 and finally sustaining it beyond will confirm it hence should be firstly watched in the next 1/2 sessions.
Follow up consolidation is firstly required for next rally above 13000
Nifty-Intra Day Chart Analysis &
Market Outlook(18-11-2020)
Nifty-Intra Day Chart (17-Nov-2020):-
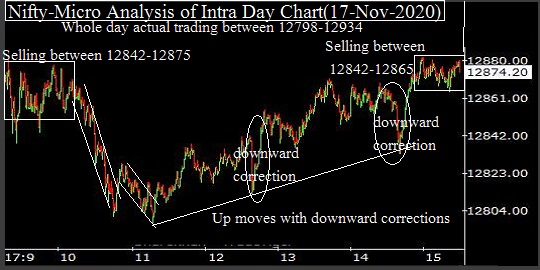
Technical Patterns formation in today intraday charts
1- Selling between 12842-12875
2- Down moves in Bullish Falling Channel
3- Up moves with downward corrections
4- Selling between 12842-12865
5- Whole day actual trading between 12798-12934
Conclusions from intra day chart analysis
As Dow Jones closed 470 points up yesterday therefore strong opening of Indian markets but sentiments turned heated hence some selling developed and down moves were seen.
Consolidation was also seen firstly through Down moves in Bullish Falling Channels and after that Up moves with downward corrections therefore today closing was near the higher levels of the day.
As selling was also seen in last half hour hence follow up consolidation is firstly required near about today highest tomorrow for next rally above 13000 because overbought Short Term Indicators are suggesting Short Term correction is on cards.
Watch levels for confirmations amid Short Term correction possibility
Nifty-Intra Day Charts Analysis &
Market Outlook(17-11-2020)
Nifty-Intra Day Chart (Nov 11 to Nov 14,2020):-

Technical Patterns formation in last 4 Sessions intraday charts
1- Consolidation between 12572-12644 on 11-11-2020
2- Selling between 12709-12769 on 11-11-2020
3- Sideways trading between 12660-12727 on 12 & 13-11-2020
4- Consolidation between 12611-12640 on 13-11-2020
5- Sideways in last 3 sessions between 12572-12769 before Diwali Muhurt session
6- Selling between 12790-12828 on 14-11-2020
7- 4 Sessions actual trading between 12572-12828
Conclusions from 4 Sessions intra day chart analysis
All trends are up and Bullish rally is very much on but Short Term Indicator Stochastic is overbought and indicating emergence of Short Term correction possibility.
Although strong gap up opening on Diwali Muhurt session but not sustaining at higher levels and closing was near the lower levels after selling between 12790-12828 therefore it will be immediate resistance of Nifty.
Nifty remained sideways in last 3 sessions between 12572-12769 before Diwali Muhurt sessions with lower levels supports and higher levels selling as well as Sideways trading between 12660-12727 therefore following levels should be firstly watched in next week for:-
1- 12660-12727 for first indication of next decisive moves beginning.
2- 12572-12769 break down will confirm Short Term correction below 12572 and break out will confirm fresh rally above 12828.
Watch above levels for confirmations amid Short Term correction possibility in next week.
Follow up selling and today lowest will confirm Short term correction
Nifty-Intra Day Chart Analysis &
Market Outlook(12-11-2020)
Nifty-Intra Day Chart (11-Nov-2020):-

Technical Patterns formation in today intraday charts
1- Selling between 12709-12769
2- Sharp fall
3- Consolidation between 12572-12644
4- Slow up moves
5- Selling between 12725-12760
6- Whole day actual trading between 12572-12769
Conclusions from intra day chart analysis
Although firstly moved up after gap up opening but selling developed at higher levels therefore sharp fall was seen. As lower levels consolidation between 12572-12644 therefore up move were seen which were slow and follow up selling was seen at higher levels hence down moves are expected towards today lowest(12572) in the coming sessions. Once follow up selling and sustaining below today lowest will confirm Short term correction towards 12400.
Nifty above 18000 till Diwali-2021
Technical Analysis,Research &
Weekly Outlook(Nov 13 to Nov 20,2020)
As new life time high formation above 12430.50 on 09-10-2020 therefore Wave have to be recounted according to Elliott Wave theory which is being done in the following Diwali-2020 Outlook
Nifty-EOD Chart Analysis (Waves structure)
Nifty-EOD Chart (10-Nov-2020):-

Technical Patterns and Formations in EOD charts
1- Impulsive Wave-1 beginning from 6825.80 on 29-02-2016 after 1 financial year(2015-16) correction completion.
2- Impulsive Wave-1 completion at 8968.70 on 07-09-2016 and corrective Wave-2 beginning
3- Corrective Wave-2 completion at 7893.80 on 26-12-2016 and impulsive Wave-3 beginning
4- Impulsive Wave-3 completion at 11760.20 on 28-08-2018 and corrective Wave-4 beginning
5- Corrective Wave-4 completion at 10004.55 on 26-10-2018 and impulsive Wave-5 beginning
6-Impulsive Wave-5 completion after new life time high formation at 12430.50 on 20-01-2020 and Wave-A of "corrective ABC Waves" beginning
7- Corrective Wave-C completion at 7511.10 on 24-03-2020
8- Impulsive Wave-1 begun and now its Wave-5 is in continuation with recent top formation at 12643.90 on 10-11-2020
Conclusions from EOD chart analysis(Waves structure)
Impulsive Wave-1 begun from 6825.80 on 29-02-2016 after 1 financial year(2015-16) correction completion. Its impulsive Wave-5 completed after new life time high formation at 12430.50 on 20-01-2020 and Wave-A of "corrective ABC Waves" begun. Its corrective Wave-C completed at 7511.10 on 24-03-2020 and in this manner 29-02-2016 started Waves structure completed after it new Waves structue formed which is in continuation with recent top formation at 12643.90 on 10-11-2020
Nifty-EOD Chart Analysis (2020 Waves structure)
Nifty-EOD Chart (10-Nov-2020):-

Technical Patterns and Formations in EOD charts
1-Impulsive Wave-5 completion after new life time high formation at 12430.50 on 20-01-2020 and Wave-A of "corrective ABC Waves" beginning
2- Corrective Wave-C completion at 7511.10 on 24-03-2020
3- Impulsive Wave-1 begun and now its Wave-5 is in continuation with recent top formation at 12643.90 on 10-11-2020
Conclusions from EOD chart analysis
(2020 Waves structure)
Impulsive Wave-5 completion after new life time high formation at 12430.50 on 20-01-2020 and Wave-A of "corrective ABC Waves" started. As Corona panic all around therefore crashing like situation developed and its corrective Wave-C completed at 7511.10 on 24-03-2020.
Waves structure which developed through Impulsive Wave-1 from 6825.80 on 29-02-2016 completed at 7511.10 on 24-03-2020 after "ABC" correction completion. After it new 2020 Waves structure formed and now it is in continuation with recent top formation at 12643.90 on 10-11-2020
Nifty-EOD Chart Analysis (2020 Correction Waves)
Nifty-EOD Chart (10-Nov-2020):-

Technical Patterns and Formations in EOD charts
1-Impulsive Wave-5 completion after new life time high formation at 12430.50 on 20-01-2020 and Wave-A of "corrective ABC Waves" beginning
2-Wave-A (11614.50 on 03-02-2020)
3-Wave-B (12246.70 on 14-02-2020)
4-Corrective Wave-C completion at 7511.10 on 24-03-2020.
5-Impulsive Wave-1 of new Waves structure begun at 7511.10 on 24-03-2020 which is continuation
Conclusions from EOD chart analysis
(2020 Correction Waves)
"ABC" correction started after new life time high formation at 12430.50 on 20-01-2020. Its Wave-A completed at 11614.50 on 03-02-2020 and Wave-B finished at 12246.70 on 14-02-2020 but Wave-C was in crashing mode because Covid-19 panic developed Globally and sharp huge fall was seen in all the Global markets which was followed by Indian markets also.
Corrective Wave-C completed at 7511.10 on 24-03-2020 and Impulsive Wave-1 of new Waves structure started.
Nifty-EOD Chart Analysis
(2020 Rally Waves structure)
Nifty-EOD Chart (10-Nov-2020):-

Technical Patterns and Formations in EOD charts
1- Corrective Wave-C completion and Impulsive Wave-1 beginning from 7511.10 on 24-03-2020
2- Wave-1 (9889.05 on 30-04-2020)
3- Wave-2 (8806.75 on 18-05-2020)
4- Wave-3 (11794.30 on 31-08-2020)
5- Wave-4 (10790.20 on 24-09-2020)
6- Impulsive Wave-5 continuation with recent top formation at 12643.90 on 10-11-2020
Conclusions from EOD chart analysis
(2020 Rally Waves structure)
Corrective Wave-C completed and Impulsive Wave-1 of new Waves structure started from 7511.10 on 24-03-2020,its impulsive Wave-5 is in continuation now with recent top formation at 12643.90 on 10-11-2020
Nifty-EOD Chart Analysis (Stochastic)
Nifty-EOD Chart (10-Nov-2020):-
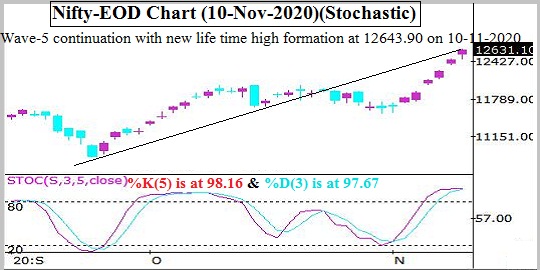
Technical Patterns and Formations in EOD charts
1- Wave-5 continuation with new life time high formation at 12643.90 on 10-11-2020
2- Stochastic- %K(5) is at 98.16 & %D(3) is at 97.67
Conclusions from EOD chart analysis (Stochastic)
Rally continuation with new life time high formation at 12643.90 but Short Term indicator Stochastic has moved into Over bought zone therefore Short Term correction has become due. As intraday charts and EOD charts have not shown any selling patterns till now therefore some more up moves can not be ruled out but expected that Short Term correction will be seen after fresh selling patterns in the next 2/3 sessions.
Conclusions (After Putting All Studies Together)
All Trends are up just before Diwali-2020 and continuous new life time high formation for the last 2 sessions in that situation when GDP IS -25.2 and whole country is in Corona pandemic grip as well as its cases have started to increase.
Main reason of strong recovery of Nifty from 7511.10 to new life time high in 2020 are as follows:-
1- Jump of profits in IT sector due to new work culture of "Work at Home" and resultant NiftyIT Index rallied 105% in only 7 months from 10992 on 19-03-2020 to 22619 on 13-10-2020.
2- As China conspired Corona therefore high Global anger against it and resultant many countries have decided to shift their companies from China to other countries and resultant many multinational companies may come and start business in India
3- "Make in India" concept will develop industrial production in India,resultant Exports and GDP will increase as well as India Rupee will also strengthen.
Although new life time high formations but Short to Long Term indicators have turned Over bought therefore correction is very much due which will be seen. As selling patterns have not been developed yet on EOD charts and intraday charts therefore immediate deeper correction will not be seen,let it happen then Short to Long Term correction will be seen but finally rally will remain continued towards and above 18000 in the coming year till Diwali-2021.
Subscribe to:
Posts (Atom)