ॐ ह्रीं श्रीं लक्ष्मीभयो नमः॥


Trading "calls" from our "Software" with more than "90% accuracy"

More than "12 years" old "only site of whole world" 
with more than "9700 accurate Outlooks" of 
"Indian Stock Markets" 
Wave-A of "ABC" correction beginning confirmations
Technical Analysis,Research & Weekly Outlook
(Jul 21 to Jul 26,2019)
Nifty-EOD Chart Analysis(Waves structure)
Nifty-EOD Chart (19-Jul-2019):-
Just click on chart for its enlarged view
Technical Patterns and Formations in EOD charts

1- Impulsive Wave-1 beginning from 6825.80 on 29-02-2016 after 1 financial year(2015-16) correction completion.
2- Impulsive Wave-1 completion at 8968.70 on 07-09-2016 and corrective Wave-2 beginning
3- Corrective Wave-2 completion at 7893.80 on 26-12-2016 and impulsive Wave-3 beginning
4- Impulsive Wave-3 completion at 11760.20 on 28-08-2018 and corrective Wave-4 beginning
5- Corrective  Wave-4 completion at 10004.55 on 26-10-2018 and impulsive Wave-5 beginning
6- Impulsive Wave-5 completion after life time top formation at 12103.00 on 03-06-2019 and corrective Wave-A beginning
7- Corrective Wave-A continuation with recent bottom formation at 11399.30 on 19-07-2019

Nifty-EOD Chart Analysis(Modi ji's Victory gap)
Nifty-EOD Chart (19-Jul-2019):-
Just click on chart for its enlarged view
Technical Patterns and Formations in EOD charts

1- 165 Points "Modi ji's Victory gap" supports formations between 11426-11591 on 20-05-2019 after Exit Polls results on 19-05-2019
2- "Modi ji's Victory gap" filled up on 19-07-2019 after Nifty slipping below 11426 and on that day intraday lowest formation was at 11399.30.

Nifty-EOD Chart Analysis(Averages)
Nifty-EOD Chart (19-Jul-2019):-
Just click on chart for its enlarged view
Technical Patterns and Formations in EOD charts

1- 5-Day SMA(today at 11590)
2- 13-Day SMA(today at 11644)
3- 55-Day SMA(today at 11698)
4- 200-Day SMA(today at 11125)

Conclusions (After Putting All Studies Together)

1- Long Term Trend is up which will be down after sustaining below 200-Day SMA(today at 11125) 
2- Intermediate Term Trend has turned down after last 10 sessions closing and sustaining below below 55-Day SMA(today at 11698)
3- Short Term Trend is down

Although 165 Points "Modi ji's Victory gap" supports formations between 11426-11591 on 20-05-2019 after Exit Polls results on 19-05-2019 but this gap filled up after slipping below 11426 therefore strong rally hopes after Modi ji's Victory have come to an end.

As real disappointment erupted from Union Budget 2019-20 therefore the correction which begun on very that day remained continued on next trading day(08-07-2019) in crashing like situation and Nifty closed on that day below 55-Day SMA. Last 10 sessions closing is below 55-Day SMA and it means that Intermediate Term Trend has turned down. As life of Intermediate Term Trend is minimum from 3 weeks to 3 months therefore this trend will remain down for this period and may be more than it also. 

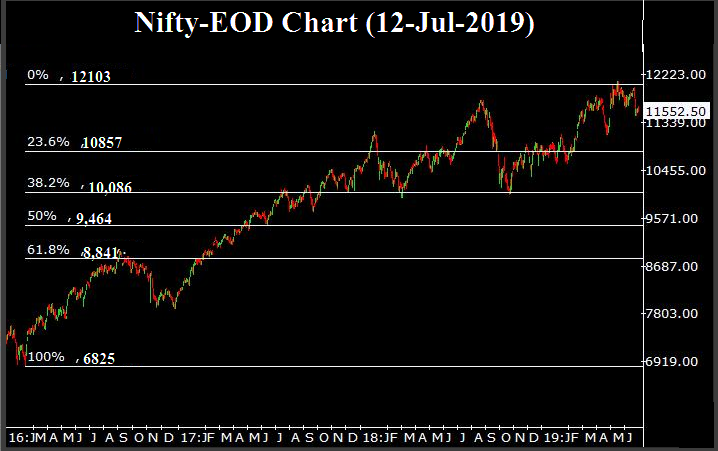
Wave-A beginning confirmation of that 5 Waves rally which started from 6825.80 on 29-02-2016 and finished at 12103.00 on 03-06-2019 after gaining 5278 points. Fibonacci Retracement levels of Wave-1 to Wave-5(6825-12103) are as follows:-

1- 13.0%-11,416
2- 23.6%-10,857
3- 27.0%-10,677
4- 38.2%-10,086(Crucial)
5- 50.0%-9,464(Crucial)
6- 61.8%-8,841(Crucial)
7- 70.7%-8,371
8- 76.4%-8,070
9- 78.6%-7,954 
10-88.6%-7,426

Wave-A of "ABC" correction is on and 13.0%(11416) retracement level has been tested last friday as well as testing of above mentioned lower levels can not be ruled out in next weeks and months because it is just beginning of correction and Nifty has to correct those 5278 points which it gained in 5 Waves rally of 40 months. 

Last hope for the Bulls is only Long Term Trend which is still up and that will be down after sustaining below 200-Day SMA(today at 11125) as well as its testing can not be ruled out in the coming weeks. 

As and when Short Term Indicators will turn oversold then Pull Back Rallies will be seen which will fuse near about following resistances:- 

1- 11467-11493
2- 11511-11543
3- 11637-11700

Correction is on and "investments in Bear markets is like catching a falling knief which results own hand is full of own blood" therefore firstly wait for trend reversal after complete consolidation and correction completion. Although short term trading opportunities through buying will remain avalable after Short Term Indicators turning oversold and emergence of Pull Back rally beginning signals.
Sustaining beyond crucial levels will form next trend
Intra Day Chart Analysis & Market Outlook
(19-07-2019)
Nifty-Intra Day Chart (18-Jul-2019):-
Just click on chart for its enlarged view
Technical Patterns formation in today intraday charts

1- Selling between 11637-11677(Immediate Resistances)
2- Sharp fall in last hour
3- Whole day actual trading between 11583-11677

Conclusions from intra day chart analysis 

As all the global markets were too much weaker in following manner today morning therefore negative opening of Indian markets:-

1- Dow Jones closed more than 100 points down yesterday after weaker closing of all European markets.
2- Dow Jones's Futures was trading more than 100 points down today morning.
3- Most Asian markets were trading 0.50% to 1.5% down today morning. 
4- Most European markets were trading more than 0.50% to 0.80% down during Indian trading hours.

As more than 4 hours fresh selling between 11637-11677 today therefore it will be immediate resistance on Nifty. Next supports of Nifty are as follows:-

1- 11520-11573
2- 11461-11500

Although sharp fall in last hour but lower levels above supports are also lying below today lowest therefore firstly Nifty will have to trade and prepare for next trend between 11461-11706 and finally sustaining beyond this range(crucial levels) will form next trend which should be watched in the coming sessions.
Strong rally after follow up consolidation
Intra Day Chart Analysis & Market Outlook
(18-07-2019)
Nifty-Intra Day Chart (17-Jul-2019):-
Just click on chart for its enlarged view
Technical Patterns formation in today intraday charts

1- Up moves with intraday corrections
2- Down moves in Bullish Falling Channels
3- Minor selling patterns formations
4- Whole day actual trading between 11652-11706

Conclusions from intra day chart analysis 

Following lines were told yesterday in "Rally after sideways consolidation":-

tomorrow will be sideways consolidation day which is expected between 11639-11702.

As was told yesterday 100% same happened today and Nifty traded sideways between 11651.15-11706.65.

Although minor selling patterns formations but good consolidation also through Up moves with intraday corrections and Down moves in Bullish Falling Channels therefore on going rally continuation possibility is alive. 

Once follow up consolidation tomorrrow will mean strong rally towards next resistance(11798) after sustaining above today highest.
Rally after sideways consolidation
Intra Day Chart Analysis & Market Outlook
(17-07-2019)
Nifty-Intra Day Chart (16-Jul-2019):-
Just click on chart for its enlarged view
Technical Patterns formation in today intraday charts

1- Down moves in Bullish Falling Channel
2- Sharp up
3- More than 4 hours consolidation between 11612-11639
4- Last hour trading with Mixed Patterns formation between 11645-11670
5- Whole day actual trading between 11574-11670

Conclusions from intra day chart analysis 

Following lines were told yesterday in "11639 Will confirm fresh and decisive up moves":-

if fresh consolidation develops tomorrrow also then finally fresh and decisive up moves will be seen and its confirmation will be after sustaining above 11639. 

As firstly consolidation through Down moves in Bullish Falling Channel and after that more than 4 hours consolidation between 11612-11639 as well as 6 hours sustaining above "Modi ji's Victory gap" highest(11591) therefore strong indications of rally continuation above today highest((11670).

Following resistances were updated on 13-07-2019 in ""Modi ji's Victory gap"(11426-11591) will confirm next Trend ":-

1- 11607-11638
2- 11676-11702
3- 11798-11879
4- 11912-11981

Although today closing was near higher levels of the day but last hour trading was with Mixed Patterns formation between 11645-11670 and next resistances is just above today highest is between 11676-11702 as well as Very Short Term Indicators have also turned over bought therefore tomorrow will be sideways consolidation day which is expected between 11639-11702.

Once follow up consolidation and sustaining above 11702 will mean sharp rally towards next resistance(11798) and above.
11639 Will confirm fresh and decisive up moves
Intra Day Chart Analysis & Market Outlook
(16-07-2019)
Nifty-Intra Day Chart (15-Jul-2019):-
Just click on chart for its enlarged view
Technical Patterns formation in today intraday charts

1- Whole day consolidation through Down moves in Bullish Falling Channels
2- Whole day actual trading between 11533-11618

Conclusions from intra day chart analysis 

As whole day consolidation through Down moves in Bullish Falling Channels and consolidation developed in the same manner last Friday also therefore it seems that Indian markets are preparing for fresh up moves.

Mixed Patterns formation within 1st resistance range(11607-11638) between 11610-11639 last Friday therefore if fresh consolidation develops tomorrrow also then finally fresh and decisive up moves will be seen and its confirmation will be after sustaining above 11639. 
"Modi ji's Victory gap"(11426-11591) will confirm next Trend 
Technical Analysis,Research & Weekly Outlook
(Jul 15 to Jul 19,2019)
Nifty-EOD Chart Analysis(Waves structure)
Nifty-EOD Chart (12-Jul-2019):-
Just click on chart for its enlarged view
Technical Patterns and Formations in EOD charts

1- Impulsive Wave-1 beginning from 6825.80 on 29-02-2016 after 1 financial year(2015-16) correction completion.
2- Corrective  Wave-2 beginning after Wave-1 completion at 8968.70 on 07-09-2016
3- Wave 1 gained 2142.90 points
4- Impulsive Wave-3 beginning after Corrective Wave-2 completion at 7893.80 on 26-12-2016
5- Corrective  Wave-4 beginning after Wave-3 completion at 11760.20 on 28-08-2018 
6- Wave-3 gained 3866.40 points
7- Impulsive Wave-5 beginning after Corrective Wave-4 completion at 10004.55 on 26-10-2018
8- Impulsive Wave-5 Life time top formation at 12103.00 on 03-06-2019
9- Last 39 Sessions sideways correction between 11461-12103

Nifty-EOD Chart Analysis(Fibonacci Retracement levels)
Nifty-EOD Chart (12-Jul-2019):-
Just click on chart for its enlarged view

Technical Patterns and Formations in EOD charts

1- Fibonacci Retracement levels of Wave-1 to Wave-5(6825-12103)

Nifty-Previous 5 Sessions intraday charts analysis
Nifty-Intra Day Chart (Jul 08 to Jul 12,2019):-
Just click on chart for its enlarged view
Technical Patterns formation in last 5 Sessions intraday charts

1- 165 Points "Modi ji's Victory gap" supports formations between 11426-11591 on 20-05-2019 after Exit Polls results on 19-05-2019
2- Last 5 sessions post Budget closing within "Modi ji's Victory gap" support(11426-11591) 

Nifty-Intra Day Chart Analysis(12-07-2019)
Nifty-Intra Day Chart (12-Jul-2019):-
Just click on chart for its enlarged view
Technical Patterns formation in today intraday charts

1- Down moves in Bullish Falling Channels
1- Mixed Patterns formation between 11610-11639
3- Sharp fall in last hour
4- Whole day actual trading between 11539-11639

Conclusions from EOD charts analysis 

1- Long Term Trend is up
2- Intermediate Term Trend has turned down after last 5 sessions closing below 55-Day SMA(today at 11719)
3- Short Term Trend is down

Fibonacci Retracement levels of Wave-1 to Wave-5(6825-12103) are as follows:-

1- 13.0%-11,416
2- 23.6%-10,857
3- 27.0%-10,677
4- 38.2%-10,086(Crucial)
5- 50.0%-9,464(Crucial)
6- 61.8%-8,841(Crucial)
7- 70.7%-8,371
8- 76.4%-8,070
9- 78.6%-7,954 
10-88.6%-7,426

Conclusions from 5 Sessions intra day chart analysis 

"Modi ji's Victory gap" support was formed between 11426-11591 on 20-05-2019 after Exit Polls results on 19-05-2019 and after that Nifty traded above it 34 sessions and after slipped within it on 08-07-2019 after post Budget down moves beginning on 05-07-2019.

"Modi ji's Victory gap" support(11426-11591) is the last hope for Bulls and it's final break out will confirm next big moves in Indian stock markets.

Conclusions from intra day chart(12-Jul-2019) analysis 

Although firstly slipping after positive opening but good consolidation was seen through Down moves in Bullish Falling Channels therefore sharp recovery was seen in Mid-session. Although sharp fall in last hour and closing at lower levels of the day but view will not be Bearish because Mixed Patterns formation at higher levels and genuine selling patterns were not seen as well as consolidation developed in last half hour through Down moves in Bullish Falling Channel.

As sufficiently good intraday consolidation patterns formations last Friday and if follow up consolidation develops in next week also then fresh rally will be seen.

Conclusions (After Putting All Studies Together)

Although 165 Points "Modi ji's Victory gap" supports formations between 11426-11591 on 20-05-2019 after Exit Polls results on 19-05-2019 and after that new life time high formations also at 12103 on 03-06-2019 but strong rally was not seen after such strong Government formation and Nifty remained 34 sessions sideways between 11615-12103 which was above the top of gap(11591). 

Sharp down moves which started after Union Budget presentation on 05-07-2019,remain continued on 08-07-2019 and 34 sessions sideways trading range(11615-12103) broken down as well as Nifty closed in all the last 5 sessions within "Modi ji's Victory gap"(11426-11591).

As correction is on and both Short with Intermediate Term Trends have also turned down therefore Fibonacci Retracement levels of whole rally(6825-12103) has been updated above. Next supports/resistances of Nifty are as follows:-

Supports:-

1- 11520-11560
2- 11461-11500
3- Lowest of "Modi ji's Victory gap"(11426)

Resistances:-

1- 11607-11638
2- 11676-11702
3- 11798-11879
4- 11912-11981

As 165 Points "Modi ji's Victory gap"(11426-11591) has shown its significance from on 20-05-2019 and last 5 sessions closing was also within this range after Budget therefore finally break out of this range will confirm next trend through following decisive moves which should be kept in mind:-

1- Sustaining above 11591 for first signal of strong Pull Back rally beginning.
2- Deeper correction beginning confirmation below 11426.
Finally "Modi ji's Victory gap" support(11426-11591) will confirm next decisive moves 
Intra Day Chart Analysis & Market Outlook
(12-07-2019)
Nifty-Intra Day Chart (11-Jul-2019):-
Just click on chart for its enlarged view
Technical Patterns formation in today intraday charts

1- Consolidation between 11520-11538
2- Consolidation between 11535-11557
3- Down moves in Bullish Falling Channel
4- Intraday correction
5- Selling between 11581-11599
6- Whole day actual trading between 11520-11599

Conclusions from intra day chart analysis 

As all the Asian markets were blasting today morning after US markets rally yesterday and Dow Jones"s Futures was also trading with good gains therefore strong opening of Indian markets but slipped for consolidation between 11520-11538 because Selling was seen between 11514-11538 yesterday. As consolidation was below 11514 yesterday through Down moves in Bullish Falling Channels therefore Nifty could not slip below it today.

Higher levels selling was seen between 11565-11593 yesterday and higher levels fresh selling again developed today between 11581-11599 therefore 11565-11599 has become immediate resistance range and until Nifty will not sustain above 11599 till then decisive up moves will not be seen. As today up moves were with consolidation therefore if fresh consolidation develops within and near about 11565-11599 then fresh rally will be seen above 11599.

165 Points "Modi ji's Victory gap" supports was formed between 11426-11591 on 20-05-2019 after Exit Polls results on 19-05-2019. Firstly Nifty traded 34 sessions above this range and after that Nifty traded most of the time within this range in last 3 sessions as well as closed also within this range in last 4 sessions. As such long time this range has shown its significance therefore finally break out of this range will confirm following decisive moves:-

1- Sustaining above 11591/11599 for first signal of strong Pull Back rally beginning.
2- Deeper correction beginning confirmation below 11426. 
Today lowest will confirm decisive down moves
Intra Day Chart Analysis & Market Outlook
(11-07-2019)
Nifty-Intra Day Chart (10-Jul-2019):-
Just click on chart for its enlarged view
Technical Patterns formation in today intraday charts

1- Selling between 11565-11593
2- Selling between 11514-11538
3- Selling between 11527-11532
4- Minor buying at lower levels through Down moves in Bullish Falling Channels
5- Whole day actual trading between 11476-11593

Conclusions from intra day chart analysis 

Although firstly up moves immediately after opening but fresh selling developed just below yesterday mentioned 1st resistance range(11607-11638) and after that slipping into negative zone.

As follow up selling also developed after higher levels selling therefore emergence of some more down moves expectations but minor buying at lower levels through Down moves in Bullish Falling Channels also hence firstly sustaining below today lowest should be watched for decisive down moves.

Nifty and Bank Nifty weekly expiry tomorrow and higher levels huge selling in first 4 sessions of this week therefore lowest of "Modi ji's Victory gap" (11426-11591) should also be watched because once filling of this gap after slipping below 11426 will mean strong signal of sharp fall and deeper correction beginning.
Pull Back Rally possibility towards next resistances
Intra Day Chart Analysis & Market Outlook
(10-07-2019)
Nifty-Intra Day Chart (09-Jul-2019):-
Just click on chart for its enlarged view
Technical Patterns formation in today intraday charts

1- Whole day many Down moves in Bullish Falling Channels
2- Minor selling at higher level through Up moves in Bearish Rising Channel
3- Whole day actual trading between 11461-11582

Conclusions from intra day chart analysis 

Although firstly slipping after negative opening but whole day good consolidation through many Down moves in Bullish Falling Channels therefore emergence of Pull Back Rally possibility towards following next resistances despite minor selling at higher  level through Up moves in Bearish Rising Channel and all the Global markets are in negative zone today:- 

1- 11607-11638
2- 11676-11702
3- 11798-11879
4- 11912-11981
Firstly watch "Modi ji's Victory gap" support(11426-11591) for next decisive moves 
Intra Day Chart Analysis & Market Outlook
(09-07-2019)
Nifty-Intra Day Chart (08-Jul-2019):-
Just click on chart for its enlarged view
Technical Patterns formation in today intraday charts

1- Selling between 11676-11702
2- Selling between 11607-11638
3- Mixed Patterns formation between 11524-11573
4- Whole day actual trading between 11524-11724

Conclusions from intra day chart analysis 

As crashing like situation in most Asian markets today morning therefore Nifty slipped 87 points in first 15 seconds after weaker opening and after that whole day down moves were seen through selling within sideways trading also. 

Last one hour trading was seen with Mixed Patterns formation between 11524-11573 and once sustaining below it will mean fresh down moves beginning but until complete consolidation will not develop till then decisive up moves will not be seen above 11573.

Emergence of Intermediate Term Trend turning down strong signals today because Nifty slipped below 34 sessions lowest(11592) and 55-Day SMA(today at 11719) and once sustaining below 55-Day SMA will mean Intermediate Term Trend turning down confirmation. 

165 Points "Modi ji's Victory gap" supports developed between 11426-11591 on 20-05-2019 after Exit Polls results on 19-05-2019 and Nifty slipped below 11591 today. It should alse be kept in mind that once slipping below 11427 will mean filling of this gap and emergence of deeper correction possibility. 

Although completely depressed sentiment today but Nifty has not slipped below 11427 yet therefore firstly keep in mind following line also which was told on 29-06-2019 in "Rally above 12103 and towards 13870.95 after Budget-2019":-

Indian markets are well matured and have full faith in Modi ji as well as rally will remain continued above 12103 and towards 13870.95 after Budget-2019 but next one more week may remain sideways between 11427-12103 for consolidation and fresh rally preparation.

"Modi ji's Victory gap" supports was formed between 11426-11591 on 20-05-2019 after Exit Polls results on 19-05-2019 and Nifty closed within this range today. Firstly break out of this range should be watched for deeper correction beginning confirmation below 11426 and sustaining above 11591 for first signal of Pull Back rally beginning

Firstly watch next strong supports after crashing like situation in Asian markets
Pre-open Outlook(08-07-2019)

As most Asian markets are trading 1% to 2% down and Dow Jones's Futures is also more than 60 points weak today morning therefore sentiment is completely depressed and resultant negative opening will be seen in indian markets.

Next supports below last Friday lowest are lying between 11642-11727 and firstly sustaining it beyond should be watched after crashing like situation in Asian markets because this supports range is strong and finally sustaining beyond this range will confirm next big trend after
 Budget 2019-20.

Firstly consolidation and then Rally continuation after good Budget
Technical Analysis,Research & Weekly Outlook
(Jul 08 to Jul 12,2019)
Nifty-EOD Chart Analysis(Modi ji's Victory gap)
Nifty-EOD Chart (05-Jul-2019):-
Just click on chart for its enlarged view
Technical Patterns and Formations in EOD charts

1- 165 Points "Modi ji's Victory gap" supports formations between 11426-11591 on 20-05-2019 after Exit Polls results on 19-05-2019
2- Last 34 Sessions sideways trading between 11592-12103

Nifty-Intra Day Chart Analysis(05-07-2019)
Nifty-Intra Day Chart (05-Jul-2019):-
Just click on chart for its enlarged view
Technical Patterns formation in today intraday charts

1- Selling between 11912-11981(Immediate Resistances)
2- Sharp fall after Budget
3- Mixed Patterns formation between 11798-11879
4- Whole day actual trading between 11798-11981

Conclusions from EOD chart analysis 

Although 1.14% fall on  Budget 2019-20 day last Friday but Short Term Trend is still sideways because closing was within last 34 Sessions range(11592-12103) at 11811.15.

165 Points "Modi ji's Victory gap" was formed between 11426-11591 on 20-05-2019 after Exit Polls results on 19-05-2019 and this gap is a symbol on Indian Stock markets faith on Modi ji's Government. Until this gap will not be filled up after slipping below 11426 till then big strong rally expectation will remain alive. 

Conclusions from intra day chart analysis 

As high expectations from Budget and most of the general traders have come for buying therefore huge selling on Budget expectations led heated sentiments resultant sharp fall after Budget and closing at lower levels of the day.  

As last 2 hours trading with Mixed Patterns formation between 11798-11879 therefore firstly follow up moves within and near about this range and finally sustaining beyond this range should be watched in the beginning of next week for real reaction of markets on Budget 2019-20. 

Conclusions (After Putting All Studies Together)

Waves structure of Nifty-EOD Chart was updated in previous weekly analysis and no material change since then because Nifty remained sideways within last 34 Sessions range(11592-12103) and no signal of its break out till now therefore Waves structure of Nifty-EOD Chart is not being posted in this Weekly Outlook.

Next resistance of Nifty are as follows:-

1- 11912-12000
2- 12045-12097 

Next supports of Nifty below last Friday lowest are as follows:-

1- 11642-11727(Strong supports)
2- "Modi ji's Victory gap"(11426-11591)

As good Budget(2019-20) was presented therefore finally rally will remain continued above life time highest(12103) but firstly consolidation will be seen between 11727-11912in the next few sessions because heated sentiments led huge selling developed yesterday between 11912-11981.
Watch levels also amid rally continuation expectations above life time highest 
Intra Day Chart Analysis & Market Outlook
(05-07-2019)
Nifty-Intra Day Chart (04-Jul-2019):-
Just click on chart for its enlarged view
Technical Patterns formation in today intraday charts

1- Selling between 11950-11960
2- Down moves in Bullish Falling Channels
3- Whole day actual trading between 11924-11969

Conclusions from intra day chart analysis 

Following lines were told yesterday in "Firstly Watch Levels amid Economic survey led high volatility expectations":-

Although today closing near lower levels of the day after sharp fall in last hour but sufficient consolidation patterns formations also therefore expected that follow up consolidation will be seen tomorrow and finally rally is expected in next week. 

As sufficient consolidation patterns formations yesterday therefore whole day positive zone trading was seen today. Although some selling in first 2 hours but good consolidation through Down moves in Bullish Falling Channels in last hours also today therefore on going rally continuation expectations are alive despite today closing near lower levels of the day.

Following 3 resistance ranges were updated on 02-07-2019 in "Rally towards 12000 after follow up consolidation":-

1- 11842-11934(Crossed)
2- 11968-12000
3- 12045-12097 

Nifty was unable to move above 2nd resistance range bottom(11968) and slipped 30 points after making today highest at 11969.25. 

Union Budget 2019-20 tomorrow and Nifty failed to cross 2nd resistance today therefore view will be cautious because Budget led high volatility can not be ruled out tomorrow therefore next supports below today lowest should also be kept in mind:-

1- 11879-11896
2- 11815-11844
3- 11642-11727(Strong supports)
4- "Modi ji's Victory gap"(11426-11591)

Although multiple supports below today lowest but multiple resistances are also above today highest and Union Budget 2019-20 like big event by a new Finance Minister tomorrow therefore view will be cautious because Short Term Indicators have also turned overbought after last 12 sessions slow up moves.

As Indian markets have to react on Budget like big event tomorrow and Indian markets are sideways for the last 33 sessions therefore firstly sustaining beyond above levels should be watched also for next big moves confirmations amid finally rally continuation expectations above life time highest in next week.
Firstly Watch Levels amid Economic survey led high volatility expectations
Intra Day Chart Analysis & Market Outlook
(04-07-2019)
Nifty-Intra Day Chart (03-Jul-2019):-

Technical Patterns formation in today intraday charts

1- Sharp up from lower levels
2- Down moves in Bullish Falling Channel
3- Up moves in Bearish Rising Channel
4- 3 Hours Up moves with intraday corrections
5- Sharp fall in last hour
6- Whole day actual trading between 11888-11945

Conclusions from intra day chart analysis

As Indian markets have not shown strength after opening and one sided clear patterns formations were not seen also therefore following lines were told at 11:23 AM  today in "Firstly watch Levels after Global markets weakness today":-

firstly sustaining beyond 11879-11934 should be watched for next decisive moves confirmations because minor supports are above 11879 and old resistances are lying below 11934.

Nifty closed between 11879-11934 at 11916.75 today after whole day volatality within and near about this range. Although sharp fall in last hour but it will be understood a part consolidation because whole day sufficient consolidation and only minor selling was seen. As union Budget on 05-07-2019 and general traders would have come for buying in Mid-session after seeing 3 Hours Up moves therefore intraday correction of this up move was seen through sharp fall in last hour today.

Although today closing near lower levels of the day after sharp fall in last hour but sufficient consolidation patterns formations also therefore expected that follow up consolidation will be seen tomorrow and finally rally is expected in next week. 

As Economic survey led high volatility can not be ruled out tomorrow therefore firstly sustaining beyond 11815-12000 should be watched because this range will give final reaction on Budget also in the next 2/3 sessions.

Firstly watch Levels after Global markets weakness today
Post-open Outlook(03-07-2019)

Following line was told yesterday in "Rally towards 12000 after follow up consolidation":-

rally continuation is expected but follow up consolidation is firstky required near about today higher levels because last half hour quiet trading was at higher levels and resistances are lying upto 11934.

Resistances upto 11934 was told yesterday and Nifty is trading below it for the last 2 hours after today intraday highest formations in first minute at 11932.15.  

As flat trading in first 2 hours and one sided clear patterns formations have not been seen yet as well as all the Asian markets with Dow Jones's Futures are trading in negative zone since today opening therefore firstly sustaining beyond 11879-11934 should be watched for next decisive moves confirmations because minor supports are above 11879 and old resistances are lying below 11934.
Rally towards 12000 after follow up consolidation
Intra Day Chart Analysis & Market Outlook
(03-07-2019)
Nifty-Intra Day Chart (02-Jul-2019):-
Just click on chart for its enlarged view
Technical Patterns formation in today intraday charts

1- Minor selling after positive opening
2- Consolidation between 11815-11844(Immediate Supports)
3- Up moves with intraday corrections
4- Last half hour quiet trading at higher levels.
5- Whole day actual trading between 11815-11917

Conclusions from intra day chart analysis 

Following lines were told yesterday in "Rally continuation after fresh consolidation":-

1- some more consolidation is required within and near about today trading range for sustaining above today highest.
2- Nifty will firstly trade and prepare for next decisive up moves within today trading range
3- finally rally will remain continued after fresh consolidation

As was told 100% same happened and firstly Nifty consolidated within and near about yesterday trading range as well as finally strong recovery was seen from lower levels.

Following 3 resistances of Nifty were updated on 29-06-2019 in "Rally above 12103 and towards 13870.95 after Budget-2019":-

1- 11842-11934
2- 11968-12000
3- 12045-12097 

As firstly lower levels consolidation and after that up moves with intraday corrections therefore rally continuation is expected but follow up consolidation is firstky required near about today higher levels because last half hour quiet trading was at higher levels and resistances are lying upto 11934.

Expected that finaly rally will remain continued towards 12000 but follow up consolidation is must because next resistances are lying between 11968-12000.
Rally continuation after fresh consolidation
Intra Day Chart Analysis & Market Outlook
(02-07-2019)
Nifty-Intra Day Chart (01-Jul-2019):-
Just click on chart for its enlarged view
Technical Patterns formation in today intraday charts

1- Down moves in Bullish Falling Channels
2- Consolidation between 11851-11866
3- Up moves in Bearish Rising Channel
4- Mixed Patterns formations in last hour
5- Whole day actual trading between 11831-11884

Conclusions from intra day chart analysis 

As firstly consolidation through Down moves in Bullish Falling Channels and after that consolidation in sideways trading also therefore emergence of rally continuation expectations. Although minor selling at higher levels but Mixed Patterns formations in last hour also therefore some more consolidation is required within and near about today trading range for sustaining above today highest.

It should also be kept in mind that Indian markets completely under performed all the Global markets today and some selling on the back of Global markets led heated sentiments can not be ruled out. As lower levels good consolidation today therefore expected that Nifty will firstly trade and prepare for next decisive up moves within today trading range but expected that finally rally will remain continued after fresh consolidation within today trading range.  
Rally above 12103 and towards 13870.95 after Budget-2019
Technical Analysis,Research & Weekly Outlook
(Jul 01 to Jul 05,2019)
Nifty-EOD Chart Analysis(Waves structure)
Nifty-EOD Chart (28-Jun-2019):-
Just click on chart for its enlarged view
Technical Patterns and Formations in EOD charts

1- Impulsive Wave-1 beginning from 6825.80 on 29-02-2016 after 1 financial year(2015-16) correction completion.
2- Corrective  Wave 2 beginning after Wave 1 completion at 8968.70 on 07-09-2016
3- Wave 1 gained 2142.90 points
4- Impulsive Wave 3 beginning after Corrective Wave-2 completion at 7893.80 on 26-12-2016
5- Corrective  Wave 4 beginning after Wave 3 completion at 11760.20 on 28-08-2018 
6- Wave 3 gained 3866.40 points
7- Impulsive Wave 5 beginning after Corrective Wave-4 completion at 10004.55 on 26-10-2018
8- Impulsive Wave-5 continuation with new life time top formation at 12103.00 on 03-06-2019
9- Last 29 Sessions sideways trading between 11592-12103

Nifty-EOD Chart Analysis(Modi ji's Victory gap)
Nifty-EOD Chart (28-Jun-2019):-
Just click on chart for its enlarged view
Technical Patterns and Formations in EOD charts

1- 165 Points "Modi ji's Victory gap" supports formations between 11426-11591 on 20-05-2019 after Exit Polls results on 19-05-2019
2- Last 29 Sessions sideways trading between 11592-12103

Nifty-Previous 29 Sessions intraday charts analysis
Nifty-Intra Day Chart (May 20 to Jun 28,2019):-
Just click on chart for its enlarged view
Technical Patterns formation in last 29 Sessions intraday charts

1- Buying,selling and mixed Patterns formation in last 29 sessions 
2- 29 Sessions actual trading between 11592-12103 

Nifty-Intra Day Chart Analysis(01-07-2019)
Nifty-Intra Day Chart (28-Jun-2019):-
Just click on chart for its enlarged view
Technical Patterns formation in today intraday charts

1- Down moves in Bullish Falling Channels
2- More than 3 hours trading with Mixed Patterns formation between 11800-11832 
3- Whole day actual trading between 11776-11871

Conclusions from EOD charts analysis 

1- Long Term Trend is up
2- Intermediate Term Trend is up
3- Short Term Trend is sideways between 11592-12103 for the last 29 Sessions after 165 Points "Modi ji's Victory gap" formations between 11426-11591 on 20-05-2019 after Exit Polls results on 19-05-2019

Conclusions from 29 Sessions intra day chart analysis 

As first Budget of Modi ji Government 2nd term on 5th July 2019 therefore Indian markets are preparing for post Budget decisive big moves for the last 29 sessions between 11592-12103 after Exit Polls results on 19-05-2019 which is above 165 Points "Modi ji's Victory gap"(11426-11591) that was formed on 20-05-2019.  

Last 29 sessions trading is with lower levels Buying and higher levels selling as well as one sideed technical positions not formations yet therefore Nifty has to trade and prepare for next post Budget decisive moves within 11592-12103 and finally sustaining beyond this range will confirm next big moves.

Conclusions from intra day chart analysis 

Although last Friday closing was near the lower levels of the day but clear selling patterns were not seen and more than 3 hours trading with Mixed Patterns formation developed as well as consolidation took placed through Down moves in Bullish Falling Channels therefore Indian markets will be understood under consolidation process and emergence of rally continuation expectations but after follow up consolidations in the coming week.

Conclusions (After Putting All Studies Together)

As Long and Intermediate Term Trends are still up therefore Indian markets will be understood Bullish and as per following calculations on going Rally will be expected towards 13870.95 in the coming weeks:-

As per Elliott Wave theory "Wave-3 should not be shorter than both Wave-1 and Wave-5. Now impulsive Wave-5 is on and it should not gain more points than Wave-3 gained(3866.40 points).

Impulsive Wave-1 gained=2142.90 points(8968.70-6825.80)
Impulsive Wave-3 gained=3866.40 points(11760.20-7893.80)
Impulsive Wave-5 has gained 1851.60 points till 18-04-2018(11856.15-10004.55) 

As per Elliott Wave theory Wave-5 can gain 3866.40 points from its beginning level(10004.55 )which means that on going Wave-5 has potential to move up to 13870.95(10004.55+3866.40) 

As Short Term Trend is sideways between 11592-12103 for the last 29 Sessions therefore firstly sustaining beyond this range should be watched for next big moves confirmations.

Next supports of Nifty are as follows:-

1- 11642-11727
2- 55-Day SMA(today at 11697) 
3- "Modi ji's Victory gap"(11426-11591)

Next resistances of Nifty are as follows:-

1- 11842-11934
2- 11968-12000
3- 12045-12097

It is confirm that Indian markets are well riped for Post Budget big moves in the last 29 sessions sideways trading between 11592-12103 and its forceful break out will be seen just before or after Buget day(05-07-2019). Although high volatility can not be ruled out in the next Pre-Budget week but expected that:-

1- Nifty will not sustain below 29 sessions lowest(11592) 
2- Nifty will not fill "Modi ji's Victory gap"(11426-11591),means that Nifty will not slip below 11427.

Indian Stock markets reacted surprisingly on following news:-

1- No rally after Modi ji strong victory on 23rd May 2019.
2- Sharp fall after Smt Nirmala Sitaraman announcement as Finance minister on 31-05-2019

Although above surprising negative moves but Indian markets are well matured and have full faith in Modi ji as well as rally will remain continued above 12103 and towards 13870.95 after Budget-2019 but next one more week may remain sideways between 11427-12103 for consolidation and fresh rally preparation.
Firstly watch levels amid fresh rally beginning possibility
Intra Day Chart Analysis & Market Outlook
(28-06-2019)
Nifty-Intra Day Chart (27-Jun-2019):-
Just click on chart for its enlarged view
Technical Patterns formation in today intraday charts

1- Up moves in Bearish Rising Channels
2- Sharp falls in last hours
3- Whole day actual trading between 11822-11911

Conclusions from intra day chart analysis 

2nd Resistance range between 11842-11934 was updated 3 times in last 4 sessions outlooks and Nifty closed just below it at 11841.55 today.

Very Short Term correction possibility was told yesterday and it was seen through sharp falls higher levels today

As fresh selling at higher levels within above mentioned 2nd resistance range(11842-11934) therefore this resistance range has become stronger but consolidation was seen above 11758 last Wednesday therefore Nifty will have to firstly trade and prepare for next decisive moves between 11758-11934 and that will be done in the coming sessions.

Expected that finally rally will remain continued after fresh consolidation but let it develop and Nifty to sustain above 11758 then fresh rally beginning time frame will be updated. 

Firstly sustaining beyond 11758-11934 should be watched amid fresh rally beginning possibility.
Finally rally after Very Short Term correction
Intra Day Chart Analysis & Market Outlook
(27-06-2019)
Nifty-Intra Day Chart (26-Jun-2019):-
Just click on chart for its enlarged view
Technical Patterns formation in today intraday charts

1- Sharp up after weaker opening
2- Consolidation through Down moves in Bullish Falling Channels within more then 4 hours sideways trading range
3- Whole day actual trading between 11758-11871

Conclusions from intra day chart analysis 

Although weaker opening but immediately 38 points sharp up and after that consolidation through down moves in Bullish Falling Channels below yesterday mentioned 2nd resistance range(11842-11934) and within more then 4 hours sideways trading range.

As multiple resistances are above 11842 and Very Short Term indicators are bought therefore Very Short Term correction like today weaker opening can not be ruled out but expected that finally rally will remain continued after follow up consolidation in the coming sessions.