

"Modi ji's Victory gap"(11426-11591) will confirm next Trend
Technical Analysis,Research & Weekly Outlook
(Jul 15 to Jul 19,2019)
Nifty-EOD Chart Analysis(Waves structure)
Nifty-EOD Chart (12-Jul-2019):- |
| Just click on chart for its enlarged view |
1- Impulsive Wave-1 beginning from 6825.80 on 29-02-2016 after 1 financial year(2015-16) correction completion.
2- Corrective Wave-2 beginning after Wave-1 completion at 8968.70 on 07-09-2016
3- Wave 1 gained 2142.90 points
4- Impulsive Wave-3 beginning after Corrective Wave-2 completion at 7893.80 on 26-12-2016
5- Corrective Wave-4 beginning after Wave-3 completion at 11760.20 on 28-08-2018
6- Wave-3 gained 3866.40 points
7- Impulsive Wave-5 beginning after Corrective Wave-4 completion at 10004.55 on 26-10-2018
8- Impulsive Wave-5 Life time top formation at 12103.00 on 03-06-2019
9- Last 39 Sessions sideways correction between 11461-12103
Nifty-EOD Chart Analysis(Fibonacci Retracement levels)
Nifty-EOD Chart (12-Jul-2019):-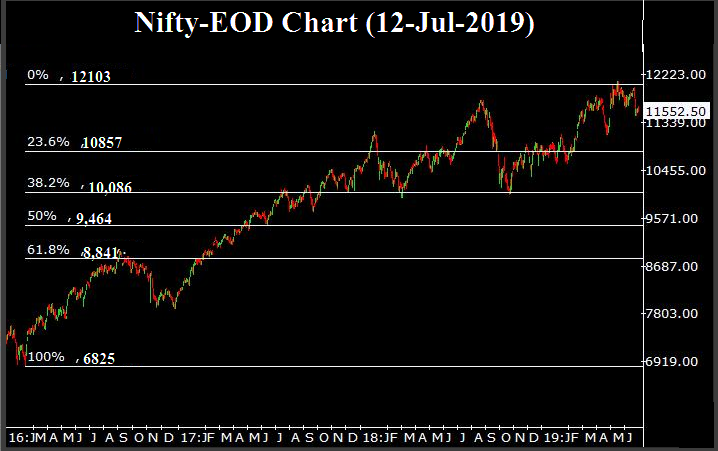 |
| Just click on chart for its enlarged view |
Technical Patterns and Formations in EOD charts
1- Fibonacci Retracement levels of Wave-1 to Wave-5(6825-12103)
Nifty-Previous 5 Sessions intraday charts analysis
Nifty-Intra Day Chart (Jul 08 to Jul 12,2019):- |
| Just click on chart for its enlarged view |
1- 165 Points "Modi ji's Victory gap" supports formations between 11426-11591 on 20-05-2019 after Exit Polls results on 19-05-2019
2- Last 5 sessions post Budget closing within "Modi ji's Victory gap" support(11426-11591)
Nifty-Intra Day Chart Analysis(12-07-2019)
Nifty-Intra Day Chart (12-Jul-2019):- |
| Just click on chart for its enlarged view |
1- Down moves in Bullish Falling Channels
1- Mixed Patterns formation between 11610-11639
3- Sharp fall in last hour
4- Whole day actual trading between 11539-11639
Conclusions from EOD charts analysis
1- Long Term Trend is up
2- Intermediate Term Trend has turned down after last 5 sessions closing below 55-Day SMA(today at 11719)
3- Short Term Trend is down
Fibonacci Retracement levels of Wave-1 to Wave-5(6825-12103) are as follows:-
1- 13.0%-11,416
2- 23.6%-10,857
3- 27.0%-10,677
4- 38.2%-10,086(Crucial)
5- 50.0%-9,464(Crucial)
6- 61.8%-8,841(Crucial)
7- 70.7%-8,371
8- 76.4%-8,070
9- 78.6%-7,954
10-88.6%-7,426
Conclusions from 5 Sessions intra day chart analysis
"Modi ji's Victory gap" support was formed between 11426-11591 on 20-05-2019 after Exit Polls results on 19-05-2019 and after that Nifty traded above it 34 sessions and after slipped within it on 08-07-2019 after post Budget down moves beginning on 05-07-2019.
"Modi ji's Victory gap" support(11426-11591) is the last hope for Bulls and it's final break out will confirm next big moves in Indian stock markets.
Conclusions from intra day chart(12-Jul-2019) analysis
Although firstly slipping after positive opening but good consolidation was seen through Down moves in Bullish Falling Channels therefore sharp recovery was seen in Mid-session. Although sharp fall in last hour and closing at lower levels of the day but view will not be Bearish because Mixed Patterns formation at higher levels and genuine selling patterns were not seen as well as consolidation developed in last half hour through Down moves in Bullish Falling Channel.
As sufficiently good intraday consolidation patterns formations last Friday and if follow up consolidation develops in next week also then fresh rally will be seen.
Conclusions (After Putting All Studies Together)
Although 165 Points "Modi ji's Victory gap" supports formations between 11426-11591 on 20-05-2019 after Exit Polls results on 19-05-2019 and after that new life time high formations also at 12103 on 03-06-2019 but strong rally was not seen after such strong Government formation and Nifty remained 34 sessions sideways between 11615-12103 which was above the top of gap(11591).
Sharp down moves which started after Union Budget presentation on 05-07-2019,remain continued on 08-07-2019 and 34 sessions sideways trading range(11615-12103) broken down as well as Nifty closed in all the last 5 sessions within "Modi ji's Victory gap"(11426-11591).
As correction is on and both Short with Intermediate Term Trends have also turned down therefore Fibonacci Retracement levels of whole rally(6825-12103) has been updated above. Next supports/resistances of Nifty are as follows:-
Supports:-
1- 11520-11560
2- 11461-11500
3- Lowest of "Modi ji's Victory gap"(11426)
Resistances:-
1- 11607-11638
2- 11676-11702
3- 11798-11879
4- 11912-11981
As 165 Points "Modi ji's Victory gap"(11426-11591) has shown its significance from on 20-05-2019 and last 5 sessions closing was also within this range after Budget therefore finally break out of this range will confirm next trend through following decisive moves which should be kept in mind:-
1- Sustaining above 11591 for first signal of strong Pull Back rally beginning.
2- Deeper correction beginning confirmation below 11426.


