As not recovered yet therefore has not been able to update Stock Market Outlooks of this week. Expecting that I shal be able to post outlooks in next week(after 21-05-2018).

ॐ ह्रीं श्रीं लक्ष्मीभयो नमः॥

Donald Trump announcement on Iran nuclear accord
President Donald Trump wrote in a tweet that he will announce his decision on whether the US will pull out of the Iran nuclear accord at 2 p.m. ET on Tuesday(11:30 PM IST on Tuesday) in place of 12th May.
Just open following links for detailed news:-
1- https://edition.cnn.com/2018/05/07/politics/donald-trump-iran-nuclear-announcement/index.html
2- https://www.nytimes.com/2018/05/07/us/politics/trump-announce-withdraw-us-iran-deal.html
Crucial levels will confirm next trend
Intra Day Chart Analysis & Market Outlook
(08-05-2018)
Nifty-Intra Day Chart (07-May-2018):-
 |
| Just click on chart for its enlarged view |
1- Consolidation between 10636-10663
2- Up moves with intraday corrections
3- Whole day actual trading between 10636-10725
Conclusions from intra day chart analysis
As good intraday consolidation between 10602-10666 last Friday therefore strong rally today after positive opening because sharp up moves were seen in US markets last Friday and most Asian and European markets also remained positive whole day today.
Nifty will firstly prepare for next decisive moves within last 6 sessions trading range(10602-10770) which is having following supports and resistances:-
1- Supports between 10602-10663
2- Resistances between 10722-10770
As per our view Indian markets have to react following 2 big news in next week:-
1- Donald Trump decision of sanctioning on Iran on 12-05-2018. Indian markets will react on this news on 14-05-2018
2- Karnataka assembly election results which was previously indicaing hung Assembly after results but heavy crowd in Modi ji's public meetings is suggesting clear victory of BJP also. Indian markets will also react on this news on 14-05-2018 after Exit poll results on 12th May evening.
As last 6 sessions trading levels(10602-10770) has become most crucial therefore firstly sustaining it beyond should be watched for next trend confirmations
Correction continuation after follow up selling
Intra Day Chart Analysis & Market Outlook
(04-05-2018)
Nifty-Intra Day Chart (03-May-2018):-
 |
| Just click on chart for its enlarged view |
1- Selling between 10680-10710
2- Selling between 10690-10708
3- Consolidation between 10648-10669
4- Whole day actual trading between 10648-10712
Conclusions from intra day chart analysis
Although Short Term correction is on but slow and Nifty out performed also all Global markets today therefore follow up selling is firstly required for correction continuation because lower levels consolidation was also seen after higher levels selling.
As selling in last 3 sessions and Intermediate Term indicators are overbought therefore correction continuation is expected but follow up selling is fistly reuqired for sustaining below today lowest.
Firstly watch levels for next trend confirmations
Intra Day Chart Analysis & Market Outlook
(03-05-2018)
Nifty-Intra Day Chart (02-May-2018):-
 |
| Just click on chart for its enlarged view |
1- Slipping after positive opening
2- Mid-Session Up moves in Bearish Rising Channel
3- Down moves in Bullish Falling Channel
4- Whole day actual trading between 10690-10770
Conclusions from intra day chart analysis
Although Nifty spot opened more than 30 points up but Nifty May Fut opened negative and whole day traded in negative zone today therefore it will be understood first signal of weakness since opening.
Firstly slipping and after that more than 3 hours Up moves in Bearish Rising Channel are suggesting selling patterns formations but last hours Down moves in Bullish Falling Channel also therefore today intraday charts will be understood Mixed Patterns formations.
Last 2 sessions trading with Mixed Patterns formations between 10690-10770 is suggesting that Nifty will have to prepare for next decisive moves within and near about this range and finally sustaining beyond this range should be firstly watched in the coming sessions and next trend confirmations.
7 sessions trading range will confirm next Trend
Intra Day Chart Analysis & Market Outlook
(02-05-2018)
Nifty-Intra Day Chart (30-Apr-2018):-
 |
| Just click on chart for its enlarged view |
1- Selling between 10722-10759
2- Whole day actual trading between 10722-10759
Conclusions from intra day chart analysis
As most Asian markets were trading strong last Friday therefore positive opening but completely underperformed and closed 0.44% up while most Asian markets closed after gaining more than 0.90% points.
Whole day actual trading within 37 points between 10722-10759 with selling patterns formations is indicating fresh down moves beginning below 10722.
I am Bearish since long but sorry to say that I have proved completely wrong this time because rally extended due to good Quarterly results of IT companies and strong Global markets also.
7 sessions sideways trading was between 10510-10638 before 27-04-2018 and this range was broken out last Friday on the expectation of strong RIL quarterly results as well as whole day selling was seen on 30-04-2018 therefore firstly sustaining above 7 sessions trading range highest(10638) should be firstly watched in next week for the confirmation of on going rally continuation. If finally Nifty sustainins below 10638 then be cautious because sustaining below 7 sessions trading range lowest(10510) will be strong signal of on going rally completion and correction continuation towards and below 10000.
Finally slipping below 10000 without sustaining above 10638
Intra Day Chart Analysis & Market Outlook
(27-04-2018)
Nifty-Intra Day Chart (26-Apr-2018):-
 |
| Just click on chart for its enlarged view |
1- Mixed Patterns formation between 10560-10595
2- Sharp up after 03:00 PM
3- Whole day actual trading between 10560-10628
Conclusions from intra day chart analysis
Although sharp up after 03:00 PM but before that whole day trading was with Mixed Patterns formation therefore view will not be Bullish because such intraday volatailty is being seen for the last 7 sessions between 10510-10638 and until Nifty will not sustain above this range till then view will not be Bullish.
As Short and Intermediate Term indicators are overbought therefore correction was expected but not being seen and still having same view of not sustaining above 10638 as well as finally slipping too much below 10000 despite SGX Nifty today closing was 50 points up after Dow Jones strong closing with gaining 238 points.
Correction continuation expectations after follow up selling
Intra Day Chart Analysis & Market Outlook
(26-04-2018)
Nifty-Intra Day Chart (25-Apr-2018):-

1- Selling between 10577-10612
2- Support between 10537-10559
3- Whole day actual trading between 10537-10612
Conclusions from intra day chart analysis
As firstly more than 4 hours selling between 10577-10612 therefore slipping from higher levels but not with force and some supports also seen at lower levels.
Last 3 sessions selling between 10577-10638 and this range will be immediate resistance of Nifty but some supports are lying above 10450 therefore follow up selling is firstly required for decisive down moves. Expected that finally correction will remain continued after follow up selling in the coming sessions.
Sharp down moves once after correction beginning confirmations
Intra Day Chart Analysis & Market Outlook
(25-04-2018)
Nifty-Intra Day Chart (24-Apr-2018):-
 |
| Just click on chart for its enlarged view |
1- Selling between 10588-10609
2- Up moves in Bearish Rising Channels
3- Volatility in last hour
4- Whole day actual trading between 10569-10636
Conclusions from intra day chart analysis
Although Green closing today after 67 points recovert from lower levels but view will not be Bullish because:-
1- Firstly selling developed between 10588-10609
2- Mid sessions Up moves were in Bearish Rising Channels and with strong up moves in Dow's Futures also after Positive opening of European markets.
Nifty made the highest at 10637.90 on 15-02-2018 before fomation the lowest at 9951.90 on 23-03-2018 and it will be maximum target of on going Wave-B as well as until Nifty will not sustain above 10637.90 till then possibility of slipping and sustaining below 9951.90 will remain alive.
April month expiry will be seen below 10637.90 but lower levels can not be told with confirmation because previous weeks up moves were not on the base of complete consolidation and were on the back of positive news from quarterly results therefore sharp down moves may be once after correction beginning confirmations.
Remain prepared for more than 1000 points correction
Intra Day Chart Analysis & Market Outlook
(24-04-2018)
Nifty-Intra Day Chart (23-Apr-2018):-
 |
| Just click on chart for its enlarged view |
Technical Patterns formation in today intraday charts
1- Up moves in Bearish Rising Channel
1- Selling between 10596-10638
3- Whole day actual trading between 10552-10638
Conclusions from intra day chart analysis
As immediate after opening strong rally in heavy weight TCS therefore sharp up moves were seen in 2.76% strong rally of NIFTY IT and resultant up moves developed in Nifty also after flat opening.
Firstly Nifty moved up in Bearish Rising Channel and after that more than 3 hours selling therefore closing near the lower levels of the day after slipping from hingr levels in last half hour.
As Short term indicators had turned over bought therefore its correction was very much due but last 10 sessions 2.25% up moves of Nifty were only on the back of strong 14% rally of NIFTY IT.
Now Intermediate term indicators have also turned over bought therefore correction of on going rally has become imminent which may be seen any day.
Expected Correction Wave will be Wave-C which will correct 100% to 161.8% of that Wave-A correction which begun from 11171.55 on 29-01-2018 and completed at 9951.90 on 23-03-2018 after Wave-B completion near about today highest. I shall discuss above mentioned waves structured on EOD charts also.
As per our view we should remain prepared for more than 1000 points Wave-C correction in the coming weeks and months,
Fresh down moves beginning expectations
Intra Day Chart Analysis & Market Outlook
(23-04-2018)
Nifty-Intra Day Chart (20-Apr-2018):-
 |
| Just click on chart for its enlarged view |
1- Selling Patterns formation between 10528-10522
2- Sharp up in last half hour
3- Whole day actual trading between 10528-10582
Conclusions from intra day chart analysis
As good quarterly results of TCS therefore whole day 4.80% strong rally of NIFTY IT and resultant sharp up in last half hour in Nifty and other Indices also.
Although last Friday Last Traded Price was at the top of the day but most time trading was with selling Patterns formation between 10528-10522 therefore expected that fresh down moves will be seen below last Friday(10528) lowest despite good quarterly results of HDFC Bank.
As per hour view finally Nifty has to move and sustain below 10000 and for this decisive down moves beginning will be seen any day.
Huge correction beginning expectations in next week
Intra Day Chart Analysis & Market Outlook
(13-04-2018)
Nifty-Intra Day Chart (12-Apr-2018):-
 |
| Just click on chart for its enlarged view |
1- Up moves in Bearish Rising Channel
2- Mixed Patterns formation between 10442-10469
3- Whole day actual trading between 10396-10469
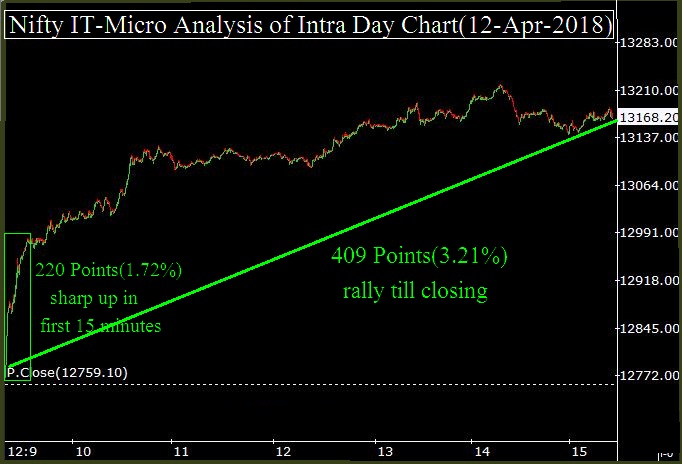
Nifty IT-Intra Day Chart (12-Apr-2018):-
 |
| Just click on chart for its enlarged view |
1- 220 Points(1.72%) sharp up in first 15 minutes
2- 409 Points(3.21%) rally till closing
Conclusions from intra day chart analysis
Although Nifty opened weak and traded first 15 minutes in negative zone also but first 45 minutes up moves were in Bearish Rising Channel and last more than 2 hours trading was with Mixed Patterns formation therefore view will not be Bullish because:-
1- Whole day today up moves were on the back of Infosys quarterly reaults(will be declared on 13-04-2018) driven sharp 3.21% rally of Nifty IT
2- Intraday charts of previous trading sessions are showing selling patterns also.
As Nifty traded last more than 2 hours within next resistance range(10446-10478) with Mixed Patterns formation therefore firstly Nifty has to trade and prepare for next trend within and near about this range.
As Short Term indicators are overbought and 23-03-2018 started Pull Back rally is demanding its correction after gaining 514 points in 12 sessions therefore huge correction beginning is expected in next week because intraday charts of previous 4 sessions are showing selling Patterns formations also.
Expected that finally Nifty will slip below the lowest(9951.90) of on going correction because on going rally is only a Pull Back rally which will fuse below the top of previous rally and has to slip below its origin point.
Decisive down moves towards next supports
Intra Day Chart Analysis & Market Outlook
(11-04-2018)
 |
Just click on chart for its enlarged view |
1- More than 5 hours selling between 10400-10424
2- Whole day actual trading between 10382-10424
Conclusions from intra day chart analysis
Resistances betweeen 10378-10420 was updated on 05-04-2018 and was repeated yesterday also,Nifty could not sustain above 10420 today after follow up more than 5 hours selling between 10400-10424 therefore expected that finally nifty will slip below today lowest(10382) and decisive down moves will be seen towards following next supports in the next 1/2 sessions despite Dow Jones now trading 490 points up:-
1- 10228-10285
2- 10115-10150
3- 9952-10015(Last supports of on going Pull Back rally)
Finally view is turning Bearish
Intra Day Chart Analysis & Market Outlook
(10-04-2018)
Nifty-Intra Day Chart (09-Apr-2018):-
 |
| Just click on chart for its enlarged view |
1- Sharp up after flat opening
2- Selling Patterns formation between 10378-10397
3- Whole day actual trading between 10340-10397
Conclusions from intra day chart analysis
Following lines were told on 05-04-2018 in "US markets led rally continuation toward next resistances":-
US markets led rally continuation is expected toward following next resistances:-
1- 10378-10420
2- 10446-10478
Although US markets tumbled more than 2% last Friday but Asian markets were trading strong today morning therefore sharp up after flat opening.
Next resistances between 10378-10420 were updated on 05-04-2018 and fresh selling was seeen within this range today between 10378-10397 therefore view is turning Bearish because Short Term indicators have also turned overbought.
US markets are now trading more than 1.5% up at this moment and if such strength develops in asian markets also then some up moves can not be ruled in Indian markets tomorrow morning but until Nifty will not sustain above 10420 till then any type of up moves will not be considered. Fresh selling and once sustaining below 10378 will mean correction of that Pull Back rally which begun on 23-03-2018 from 9951.90.
Finally view is turning Bearish despite 0.46% positive closing after whole day positive zone trading today and strong US markets at this moment.
Signals of correction beginning
Intra Day Chart Analysis & Market Outlook
(09-04-2018)
Nifty-Intra Day Chart (08-Apr-2018):-
 |
| Just click on chart for its enlarged view |
1- Mixed Patterns formation between 10291-10331
2- Whole day actual trading between 10291-10350
Conclusions from intra day chart analysis
As most time trading with Mixed Patterns formation therefore technically Nifty has to prepare for next decisive moves within and near about last Friday range but Short Term indicators have turned overbought therefore signals of correction beginning also.
US markets tumbled more than 2% last Friday and if such weakness develops in Asian markets also tomorrow morning then nifty will correct that Pull Back rally which begun from 9951.90 on 23-03-2018 and will test following supports:-
1- Supports between 10228-10285
2- Supports between 10115-10150
3- Supports between 9952-10015(Last supports of on going Pull Back rally)
Subscribe to:
Posts (Atom)