Remain prepared for more than 1000 points correction
Intra Day Chart Analysis & Market Outlook
(24-04-2018)
Nifty-Intra Day Chart (23-Apr-2018):-
 |
| Just click on chart for its enlarged view |
Technical Patterns formation in today intraday charts
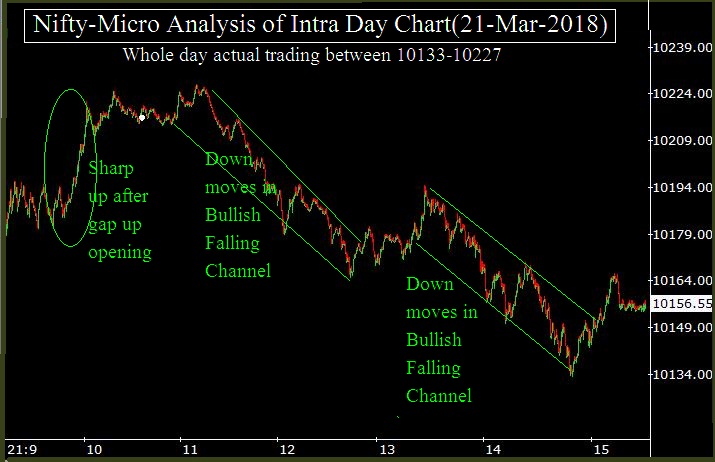
1- Up moves in Bearish Rising Channel
1- Selling between 10596-10638
3- Whole day actual trading between 10552-10638
Conclusions from intra day chart analysis
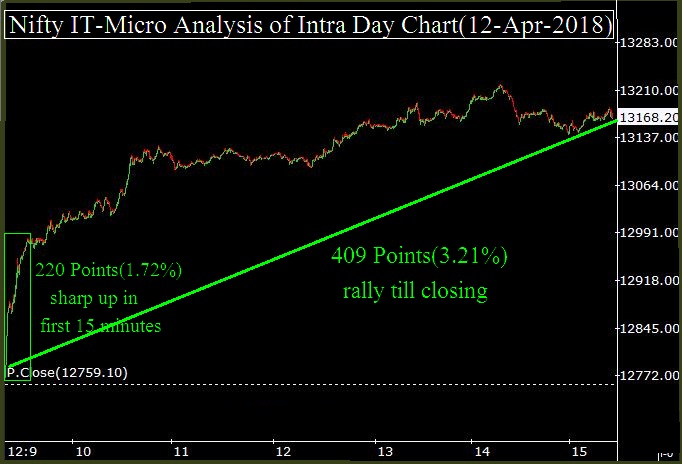
As immediate after opening strong rally in heavy weight TCS therefore sharp up moves were seen in 2.76% strong rally of NIFTY IT and resultant up moves developed in Nifty also after flat opening.
Firstly Nifty moved up in Bearish Rising Channel and after that more than 3 hours selling therefore closing near the lower levels of the day after slipping from hingr levels in last half hour.
As Short term indicators had turned over bought therefore its correction was very much due but last 10 sessions 2.25% up moves of Nifty were only on the back of strong 14% rally of NIFTY IT.
Now Intermediate term indicators have also turned over bought therefore correction of on going rally has become imminent which may be seen any day.
Expected Correction Wave will be Wave-C which will correct 100% to 161.8% of that Wave-A correction which begun from 11171.55 on 29-01-2018 and completed at 9951.90 on 23-03-2018 after Wave-B completion near about today highest. I shall discuss above mentioned waves structured on EOD charts also.
As per our view we should remain prepared for more than 1000 points Wave-C correction in the coming weeks and months,