ॐ ह्रीं श्रीं लक्ष्मीभयो नमः॥


Trading "calls" from our "Software" with more than "90% accuracy"

More than "12 years" old "only site of whole world" 
with more than "9700 accurate Outlooks" of 
"Indian Stock Markets" 
Huge correction beginning expectations in next week
Intra Day Chart Analysis & Market Outlook
(13-04-2018)

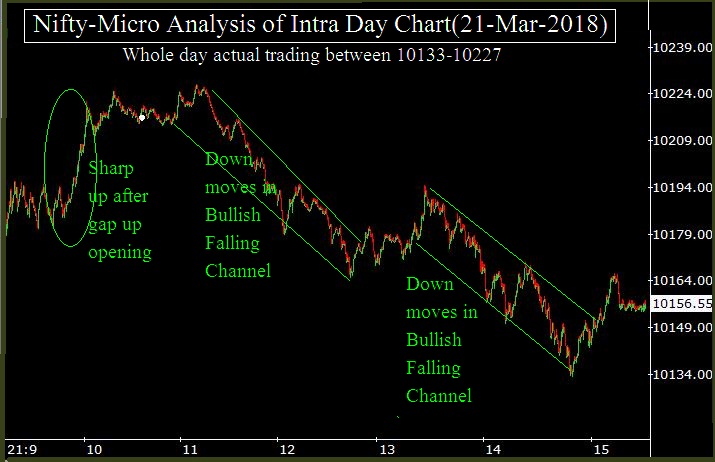
Nifty-Intra Day Chart (12-Apr-2018):-
Just click on chart for its enlarged view
Technical Patterns formation in today intraday charts

1- Up moves in Bearish Rising Channel
2- Mixed Patterns formation between 10442-10469
3- Whole day actual trading between 10396-10469

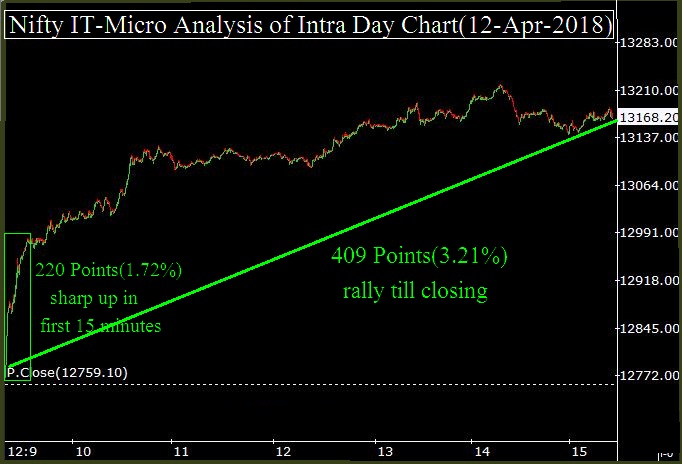
Nifty IT-Intra Day Chart (12-Apr-2018):-
Just click on chart for its enlarged view
Technical Patterns formation in today intraday charts

1- 220 Points(1.72%) sharp up in first 15 minutes
2- 409 Points(3.21%) rally till closing

Conclusions from intra day chart analysis 

Although Nifty opened weak and traded first 15 minutes in negative zone also but first 45 minutes up moves were in Bearish Rising Channel and last more than 2 hours trading was with Mixed Patterns formation therefore view will not be Bullish because:-

1- Whole day today up moves were on the back of Infosys quarterly reaults(will be declared on 13-04-2018) driven sharp 3.21% rally of Nifty IT 
2- Intraday charts of previous trading sessions are showing selling patterns also.

As Nifty traded last more than 2 hours within next resistance range(10446-10478) with Mixed Patterns formation therefore firstly Nifty has to trade and prepare for next trend within and near about this range.

As Short Term indicators are overbought and 23-03-2018 started Pull Back rally is demanding its correction after gaining 514 points in 12 sessions therefore huge correction beginning is expected in next week because intraday charts of previous 4 sessions are showing selling Patterns formations also. 

Expected that finally Nifty will slip below the lowest(9951.90) of on going correction because on going rally is only a Pull Back rally which will fuse below the top of previous rally and has to slip below its origin point. 
As busy therefore Stock Market Outlook of today(12-04-2018) is not being updated
Decisive down moves towards next supports
Intra Day Chart Analysis & Market Outlook
(11-04-2018)

Nifty-Intra Day Chart (10-Apr-2018):-

Just click on chart for its enlarged view
Technical Patterns formation in today intraday charts

1- More than 5 hours selling between 10400-10424
2- Whole day actual trading between 10382-10424

Conclusions from intra day chart analysis 

Resistances betweeen 10378-10420 was updated on 05-04-2018 and was repeated yesterday also,Nifty could not sustain above 10420 today after follow up more than 5 hours selling between 10400-10424 therefore expected that finally nifty will slip below today lowest(10382) and decisive down moves will be seen towards following next supports in the next 1/2 sessions despite Dow Jones now trading 490 points up:- 

1- 10228-10285
2- 10115-10150
3- 9952-10015(Last supports of on going Pull Back rally)
Finally view is turning Bearish
Intra Day Chart Analysis & Market Outlook
(10-04-2018)

Nifty-Intra Day Chart (09-Apr-2018):-
Just click on chart for its enlarged view
Technical Patterns formation in today intraday charts

1- Sharp up after flat opening
2- Selling Patterns formation between 10378-10397
3- Whole day actual trading between 10340-10397

Conclusions from intra day chart analysis

Following lines were told on 05-04-2018 in "US markets led rally continuation toward next resistances":-

US markets led rally continuation is expected toward following next resistances:-

1- 10378-10420
2- 10446-10478

Although US markets tumbled more than 2% last Friday but Asian markets were trading strong today morning therefore sharp up after flat opening.

Next resistances between 10378-10420 were updated on 05-04-2018 and fresh selling was seeen within this range today between 10378-10397 therefore view is turning Bearish because Short Term indicators have also turned overbought.

US markets are now trading more than 1.5% up at this moment and if such strength develops in asian markets also then some up moves can not be ruled in Indian markets tomorrow morning but until Nifty will not sustain above 10420 till then any  type of up moves will not be considered. Fresh selling and once sustaining below 10378 will mean correction of that Pull Back rally which begun on 23-03-2018 from 9951.90. 

Finally view is turning Bearish despite 0.46% positive closing after whole day positive zone trading today and strong US markets at this moment.
Signals of correction beginning
Intra Day Chart Analysis & Market Outlook
(09-04-2018)

Nifty-Intra Day Chart (08-Apr-2018):-
Just click on chart for its enlarged view
Technical Patterns formation in today intraday charts

1- Mixed Patterns formation between 10291-10331 
2- Whole day actual trading between 10291-10350

Conclusions from intra day chart analysis 

As most time trading with Mixed Patterns formation therefore technically Nifty has to prepare for next decisive moves within and near about last Friday range but Short Term indicators have turned overbought therefore signals of correction beginning also.

US markets tumbled more than 2% last Friday and if such weakness develops in Asian markets also tomorrow morning then nifty will correct that Pull Back rally which begun from 9951.90 on 23-03-2018 and will test following supports:- 

1- Supports between 10228-10285
2- Supports between 10115-10150
3- Supports between 9952-10015(Last supports of on going Pull Back rally) 
Traders should remain cautious amid US markets led violent volatility
Pre-open Outlook(06-04-2018)

Dow Jones closed 240 points up yesterday and only after 7 hours Dow's Fututes is trading 284 points down while once it was trading 450 points down also 3 hours before.

Dow's Fututes was traing 450 points down when Indian markets closed on 04-04-2018 but Dow Jones closed more than 200 points up same day.

As per my view it is only manipulation by international operators because all the Global markets takes cues from US markets and react on its price movements otherwise economic situation never change as fast as being shown by US markets.

Certainly this US markets led violent volatility like situation is beyond the imagination and control of general traders therefore traders should remain cautious and overnight positions should be avoided if there is no confirmation.
US markets led rally continuation toward next resistances  
Intra Day Chart Analysis & Market Outlook
(06-04-2018)
Nifty-Intra Day Chart (05-Apr-2018):-
Just click on chart for its enlarged view
Technical Patterns formation in today intraday charts

1- Consolidation between 10228-10260
2- Consolidation between 10258-10285
3- Sharp up after RBI Credit policy announcements
4- Whole day actual trading between 10228-10331

Conclusions from intra day chart analysis 

As higher levels good selling between 10242-10279 yesterday therefore correction continuation was expected after follow up selling but blasting US markets led Bullish moves were seen in all the Global markets resultant strong rally developed in Indian markets also.

Although good selling was seen between 10242-10279 yesterday but more than 5 hours consolidation within and near about this range between 10228-10285 today therefore sharp up moves after RBI Credit policy announcements.

Last 11 sessions trading was between 9952-10279 and this range was forcefully broken out today therefore US markets led rally continuation is expected toward following next resistances:-

1- 10378-10420
2- 10446-10478

Technical analysis has been updated above but US markets led violent volatility in all the Global markets therefore its impact on Indian markets moves should also be watched. 
Finally today started correction continuation towards next supports
Intra Day Chart Analysis & Market Outlook
(05-04-2018)
Nifty-Intra Day Chart (04-Apr-2018):-
Just click on chart for its enlarged view
Technical Patterns formation in today intraday charts

1- More than 3 hours selling between 10242-10279
2- Sharp down
3- Last 2 hours sideways trading between 10112-10154
4- Whole day actual trading between 10112-10279

Conclusions from intra day chart analysis 

Following lines were told yesterday in "10227 will confirm life of on going Pull Back Rally":-

1- Short Term indications are over bought therefore Short Term correction has become very much due
2- firstly 3/4 hours trading patterns and its resultant finally sustaining beyond 10227 should be watched tomorrow for the life of on going Pull Back Rally

As firstly more than 3 hours selling between 10242-10279 therefore sharp down in Mid-session and closing 98 points below 10227 today.

Immediate supports were between 10105-10150 and today closing was within this range after last 2 hours sideways trading between 10112-10154 therefore Nifty will firstly trade within and near about this range and finally sustaining beyond 10105-10279 will confirm next decisive moves

Last 11 sessions trading between 9952-10279 and expected that finally today started correction will remain continued towards next supports(9952-10019) after follow up selling in the next 1/2 sessions.
10227 will confirm life of on going Pull Back Rally
Intra Day Chart Analysis & Market Outlook
(04-04-2018)

Nifty-Intra Day Chart (03-Apr-2018):-
Just click on chart for its enlarged view
Technical Patterns formation in today intraday charts

1- Mixed Patterns formation till 03:00 PM between 10172-10229
2- Up moves after 03:00 PM
3- Whole day actual trading between 10172-10255

Conclusions from intra day chart analysis

Last 9 sessions trading was between 9952-10227 and today closing was above it but before that almost whole day trading was with Mixed Patterns formation therefore follow up consolidation and sustaining above 10227 is must for the confirmation of 9 sessions trading range valid break out.

Although last half hour up moves but Short Term indications are over bought therefore Short Term correction has become very much due. As complete selling patterns formation have not been seen yet therefore firstly 3/4 hours trading patterns and its resultant finally sustaining beyond 10227 should be watched tomorrow for the life of on going Pull Back Rally
Watch levels amid correction possibility
Intra Day Chart Analysis & Market Outlook
(03-04-2018)

Nifty-Intra Day Chart (02-Apr-2018):-
                                                 Just click on chart for its enlarged view
Technical Patterns formation in today intraday charts

1- Consolidation between 10128-10154
2- Intraday corrections
3- Last hour Up moves in Bearish Rising Channel
4- Whole day actual trading between 10128-10220

Conclusions from intra day chart analysis 

As good consolidation in first hour and whole day up moves with intraday correction therefore closing at higher levels of the day. Last hour Up moves were in Bearish Rising Channel and Short Term indications have turned over bought as well as today closing in resistance range(10177-10227) therefore emergence of last 5 sessions Pull Back rally(9952-10220) correction possibility.

Following conclusive lines were updated yesterday in "Firstly Watch levels for next big moves confirmations" and being repeated for final conclusions:-

Last 8 sessions trading between 9952-10227 with lower levels following supports and higher levels following resistances therefore firstly Nifty has to trade and prepare for next big moves within and near about this range as well as finally sustaining beyond this range will confirm next big moves which should also be watched in next week.

1- Supports between 9952-10019 
2- Resistances between 10177-10227 
Firstly Watch levels for next big moves confirmations
Intra Day Chart Analysis & Market Outlook
(02-04-2018)

Nifty-Intra Day Chart (28-Mar-2018):-
Just click on chart for its enlarged view
Technical Patterns formation in today intraday charts

1- Down moves in Bullish Falling Channel
2- Derivative expiry led high volatility in last hours
3- Whole day actual trading between 10097-10158

Conclusions from intra day chart analysis 

As all the Global markets were weak last Friday therefore whole day negaive zone trading after gap down opening but some consolidation was also seen therefore indications of some up moves in the beginning of next week. 

Derivative expiry led high volatility in last hours and technical positions reverses during such high volatility therefore firstly sustaining beyond last Friday trading range(10097-10158) should be watched for the beginning of next decisive moves.

Last 8 sessions trading between 9952-10227 with lower levels following supports and higher levels following resistances therefore firstly Nifty has to trade and prepare for next big moves within and near about this range as well as finally sustaining beyond this range will confirm next big moves which shou;d also be watched in next week.

1- Supports between 9952-10019 
2- Resistances between 10177-10227 
As busy therefore Stock Market Outlook of today(28-03-2018) is not being updated
Levels will confirm the life of today started Pull Back Rally
Intra Day Chart Analysis & Market Outlook
(27-03-2018)

Nifty-Intra Day Chart (26-Mar-2018):-
Just click on chart for its enlarged view
Technical Patterns formation in today intraday charts

1- Down moves in Bullish Falling Channel
2- Up moves with intraday corrections
3- Sharp Jump
4- Up moves in Bearish Rising Channel
5- Whole day actual trading between 9959-10143

Conclusions from intra day chart analysis 

As first 4 hours consolidation through down moves in Bullish Falling Channel and after that up moves with intraday corrections therefore after that sharp jump was seen. 

Minor profit booking also developed in last hours through Up moves in Bearish Rising Channel therefore firstly Nifty has to preperae for next decisive moves within today trading range,

Following levels are most important which should be firstly watchd in the coming sessions for the life of today started Pull Back Rally:-

1- 10175(Long Term trend decider 200 Day SMA)
2- 10142-10164(Resistances)
3- 10177-10207(Resistances)
4- 10214-10224(Resistances)
Pull Back rally towards and above 10100 in next week
Intra Day Chart Analysis & Market Outlook
(26-03-2018)
Nifty-Intra Day Chart (23-Mar-2018):-
Just click on chart for its enlarged view
Technical Patterns formation in today intraday charts

1- Consolidation between 9962-10002
2- Consolidation between 9977-9987
3- All the down moves in Bullish Falling Channels
4- Whole day actual trading between 9952-10027

Conclusions from intra day chart analysis 

Although 1.15% negative closing after huge gap down opening and whole day deep Red trading last Friday but view is Bullish and Pull Back rally is expected towards and above 10100 in next week despite Dow Jones yesterday closing after loosing 424.69 points and SGX Nifty closing at 9916.50 after the loss of 75 points because:-

1- Good consolidation patterns formations in Indian markets.
2- Nifty out performed most Global markets and lost only 1.15% points while most Globl markets closed after loosing more than 2% points.
Correction continuation towards and below 10000 
Intra Day Chart Analysis & Market Outlook
(23-03-2018)

Nifty-Intra Day Chart (22-Mar-2018):-
Just click on chart for its enlarged view
Technical Patterns formation in today intraday charts

1- 60 Points jump after flat opening
2- Selling between 10177-10207
3- Selling between 10142-10164
4- Volatility in last 2 hours
5- Whole day actual trading between 10105-10207

Conclusions from intra day chart analysis 

Pull Back rally continuation was told yesterday and 60 Points jump was seen immediate after opening today despite weaker most Global markets but selling developed at higher levels therefore whole day slipping and closing at lower levels of the day. 

As follow up selling in Mid-session and volatility in last 2 hours which is also selling signal therefore following same view which was updated on 19-03-2018 in "Finally correction continuation towards and below 10000 amid only a Pull Back rally possibility ":- 

finally on going correction continuation towards and below 10000 
Pull Back rally continuation
Intra Day Chart Analysis & Market Outlook
(22-03-2018)

Nifty-Intra Day Chart (21-Mar-2018):-
Just click on chart for its enlarged view
Technical Patterns formation in today intraday charts

1- Sharp up after gap up opening
2- Down moves in Bullish Falling Channel 
3- Whole day actual trading between 10133-10227

Conclusions from intra day chart analysis 

Although whole day slipping after gap up strong opening but Down moves were in Bullish Falling Channels therefore still Pull Back rally continuation is expected despite today closing near the lower levels of the day.
Today started Pull Back rally continuation expectations
Intra Day Chart Analysis & Market Outlook
(21-03-2018)

Nifty-Intra Day Chart (20-Mar-2018):-
Just click on chart for its enlarged view
Technical Patterns formation in today intraday charts

1- Recovery from lower levels
2- Consolidation between 10092-10155
3- Whole day actual trading between 10050-10155

Conclusions from intra day chart analysis 

Although most depressed sentiment today morning due to weakness in most of the Global markets but firstly recovery from lower levels after weak opening and more than 4 hours consolidation therefore today started Pull Back rally continuation is expected tomorrow. 

As all the Asian markets will react on FOMC announcements on Thursday therefore intraday charts patterns formations of tomorrow will confirm post FOMC decisive moves which should also be firsly watched tomorrow for the strength of today started Pull Back rally. 
Finally correction continuation towards and below 10000 amid only a Pull Back rally possibility 
Intra Day Chart Analysis & Market Outlook
(20-03-2018)

Nifty-Intra Day Chart (19-Mar-2018):-
Just click on chart for its enlarged view
Technical Patterns formation in today intraday charts

1- Whole day selling with intraday corrections
2- Whole day actual trading between 10076-10224

Conclusions from intra day chart analysis 

Although today lowest formations at 10075.30 but following topics are live proofs of this fact that we are continuously telling for such deepeer this level correction from 28-01-2018:-  

1- Following lines were told 4 days before Budget 2018-19 on 28-01-2018 in "11413.85 will confirm Rally continuation or 5 Waves Correction after Budget":-

1- firstly sustaining beyond 11413.85 should be watched in the coming weeks after Budget 
2- sustaining below it will mean 5 waves correction of whole rally from 2252.75 to any highest below 11413.85.

2- Following lines were told on 06-02-2018 in "Watch psychological level amid correction continuation expectations":-

Correction is on and its continuation is expected. As 13.0% retracement level(10,011) and 3rd supports range(10040-10175) are just above psychological of 10000 therefore firstly sustaining beyond 10000 should be watched in the coming weeks for the life of on going correction.

3- Following lines were told on 06-03-2018 in "Correction continuation is expected towards 10000":-

correction continuation is expected towards 10000

4- Following lines were told on 11-03-2018 in "Watch Levels amid correction continuation expectations":-

correction continuation towards and below 10000

As whole day selling with intraday corrections today also therefore same view of finally on going correction continuation towards and below 10000 but Very Short Term indicators have turned oversold thereforeonly a Pull Back rally may be seen any day.

(Just click above topic links and understand complete analysis)

As out of station therefore Stock Market Outlook of today(19-03-2018) is not being updated
Correction continuation towards next supports
Intra Day Chart Analysis & Market Outlook
(16-03-2018)

Nifty-Intra Day Chart (15-Mar-2018):-
Just click on chart for its enlarged view
Technical Patterns formation in today intraday charts

1- Selling between 10407-10420
2- Selling between 10390-10405
3- Selling between 10378-10388
4- Whole day actual trading between 10347-10420

Conclusions from intra day chart analysis 

As whole day continuous selling therefore on going correction continuation is expected towards yesterday mentioned next supports.
Firstly watch supports and resistances for the life of on going correction
Intra Day Chart Analysis & Market Outlook
(15-03-2018)
Nifty-Intra Day Chart (14-Mar-2018):-
Just click on chart for its enlarged view
Technical Patterns formation in today intraday charts

1- Down moves in Bullish Falling Channels
2- Sharp up moves in last hour
3- Whole day actual trading between 10337-10420

Conclusions from intra day chart analysis 

Although corection continuation through whole day negative zone trading but intraday consolidation patterns formations also through Down moves in Bullish Falling Channels and today closing near the higher levels of the day therefore signals of some up moves towards following resistances:-

1- 10446-10478
2- 10480-10520
3- 10548-10587

Next supports of Nifty are as follows:-

1- 10314-10341
2- 10150-10205

As last 1 month US markets led violent volatility in all the Global markets therefore firstly watch above mentioned supports and resistances for the life of on going correction and firstly sustaining beyond 10314-10478 should be watched for its 1st signal.