Rally continuation expectations after follow up consolidations
Intra Day Chart Analysis & Market Outlook
(25-01-2018)
Nifty-Intra Day Chart (24-Jan-2018):-
 |
| Just click on chart for its enlarged view |
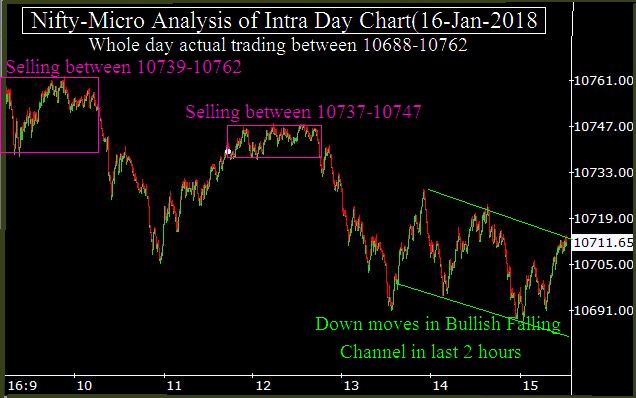
1- Down moves in Bullish Falling Channel
2- Whole day sideways trading between 11047-11109
Conclusions from intra day chart analysis
Although Whole day sideways trading and flat closing today but some consolidation was also seen through Down moves in Bullish Falling Channel therefore signals of rally continuation above today highest.
As Very Short Term indicators are overbought therefore Very Short Term correction is very much due and it was seen today through sideways trading with some consolidation but expected that finally rally will remain continued after follow up consolidation within and near about today trading range.