As I was out of station therefore Stock Market Outlook of today(31-05-2017) is not being updated.

ॐ ह्रीं श्रीं लक्ष्मीभयो नमः॥

Next decisive moves strong signal from today trading range break out
Intra Day Chart Analysis & Market Outlook
(02-06-2017)
Nifty-Intra Day Chart (01-Jun-2017):-
 |
| Just click on chart for its enlarged view |
1- Selling between 9616-9634
2- Consolidation between 9590-9606
3- Last 2 hours Mixed Patterns formations between 9606-9622
4- Whole day actual trading between 9590-9634
Conclusions from intra day chart analysis
Whole day sideways trading with higher levels selling and lower levels buying as well as last 2 hours Mixed Patterns formations therefore again today trading will be understood with mixed patterns formations and same following view which was updated in yesterday Outlook:-
As sustaining beyond 9548-9649 will be break out of 4 sessions trading range and one sided decisive 2% moves will be seen as well as valid break out of today trading range(9590-9634) will be strong signal of last 4 sessions trading range break out therefore should be firstly watched in the coming sessions
Firstly Watch Levels for one sided decisive moves
Intra Day Chart Analysis & Market Outlook
(01-06-2017)
Nifty-Intra Day Chart (31-May-2017):-
 |
| Just click on chart for its enlarged view |
1- Down moves in Bullish Falling Channel
2- Up moves in Bearish Rising Channel
3- Volatility in last 2 hours
4- Whole day actual trading between 9610-9649
Conclusions from intra day chart analysis
Following lines were told on 29-05-2017 in "Firstly Watch Levels for Rally Continuation or Short Term Correction beginning":-
valid break out of today trading range should be firstly watched in the coming sessions for on going rally continuation above 9637 or Short Term Correction beginning below 9548.
Nifty closed within mentioned range(9548-9637) in last 2 sessions with Mixed patterns formations and volatility was seen in last 2 hours also today therefore same view that valid break out of last 3 sessions trading range should be firstly watched in the coming sessions for on going rally continuation above 9649 or Short Term Correction beginning below 9548.
As sustaining beyond 9548-9649 will be break out of 3 sessions trading range and one sided decisive 2% moves will be seen therefore should be firstly watched in the coming sessions.
Firstly Watch Levels for Rally Continuation or Short Term Correction beginning
Intra Day Chart Analysis & Market Outlook
(30-05-2017)
Nifty-Intra Day Chart (29-May-2017):-
 |
| Just click on chart for its enlarged view |
1- Sharp up after weak opening
2- Down moves in Bullish Falling Channel
3- Up moves with intraday corrections
4- Selling between 9593-9615
5- Selling between 9616-9637
6- Whole day actual trading between 9548-9637
Conclusions from intra day chart analysis
Although weaker opening but Sharp up moves immediately after weak opening and next 3 hours consolidation also through:-
1- Down moves in Bullish Falling Channel
2- Up moves with intraday corrections
As selling was also seen at higher levels in last 3 hours therefore today trading will be understood with Mixed patterns formations and valid break out of today trading range should be firstly watched in the coming sessions for on going rally continuation above 9637 or Short Term Correction beginning below 9548.
Finally Rally Continuation after Very Short Term Correction
Intra Day Chart Analysis & Market Outlook
(29-05-2017)
Nifty-Intra Day Chart (26-May-2017):-
 |
| Just click on chart for its enlarged view |
1- Whole day up moves with intraday corrections
2- Minor selling patterns at higher levels
3- Whole day actual trading between 9495-9604
Conclusions from intra day chart analysis
Although Nifty closed negative below all the immediate supports on 24-05-2017 but we told following lines on 24-05-2017 in "Pull Back Rally possibility":-
1- view will not be Bearish despite today closing near the lower levels of the day.
2- Pull Back Rally may be seen any day in this week
As was told 100% same happened and strong rally was seen in next 2 sessions after 24-05-2017.
It should be kept in mind that until complete selling patterns will not develop till then decisive down moves will not be seen and follow up consolidation in the beginning of next week will mean Rally continuation towards 10,000.
Pull Back Rally possibility
Intra Day Chart Analysis & Market Outlook
(25-05-2017)
Nifty-Intra Day Chart (24-May-2017):-
 |
| Just click on chart for its enlarged view |
1- Whole day Down moves in Bullish Falling Channels
2- Whole day actual trading between 9342-9432
Conclusions from intra day chart analysis
As Pakistan air Force activity on Siachen border today morning and Pakistan jets flied also near Siachen border therefore whole day slipping from higher levels after positive opening. All the Down moves were in Bullish Falling Channels therefore view will not be Bearish despite today closing near the lower levels of the day.
Although today closing was below all the immediate supports but were due to above mentioned negative news led and consolidation patterns were also seen today therefore a Pull Back Rally may be seen any day in this week. Certainly Short Term Correction is on and no confirmation of its completion yet but sustaining beyond today lowest(9360.55) should be watched in the coming sessions after last 2 sessions negative news led trading.
9400 will confirm fresh Rally
Intra Day Chart Analysis & Market Outlook
(24-05-2017)
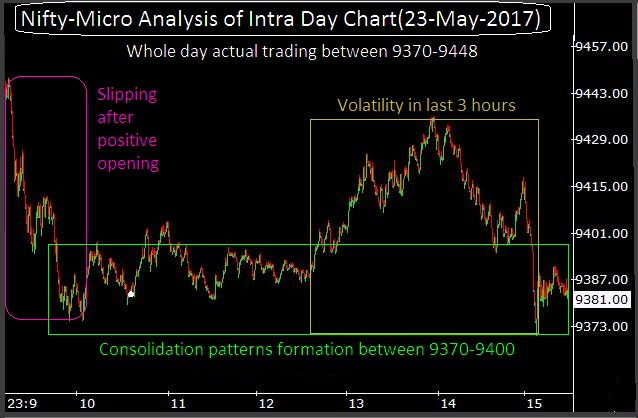
Nifty-Intra Day Chart (23-May-2017):-
 |
| Just click on chart for its enlarged view |
1- Slipping after positive opening
2- Consolidation patterns formation between 9370-9400
3- Volatility in last 3 hours
4- Whole day actual trading between 9370-9448
Conclusions from intra day chart analysis
As news of Indian Army attacks on Pakistani bunkers along LoC in Kashmir's Nowshera sector was in the pipe line therefore following reaction on Indian financial markets today morning:-
1- Indian Rupee weakened against USD($) by 28 Paise within first 32 minutes.
2- Nifty weakened by 64 points within first 40 minutes.
Although today closing was near the lower levels of the day but consolidation patterns formation between 9370-9400 there view will not be Bearish and until Nifty will not sustain below 9370 till then decisive down moves will not be seen.
Last supports between 9373-9387 was updated yesterday in "Up moves expectations towards next resistances" and Nifty closed within this range at 9386.15 today as well as fresh consolidation was seen within this range today therefore expectations of fresh rally above 9400 are alive but sustaining it above should also be firstly watched for its continuation confirmations because today market and last hours volatility was above mentioned new led and technical positions reverses in such news led volatility also.
Up moves expectations towards next resistances
Intra Day Chart Analysis & Market Outlook
(23-05-2017)
Nifty-Intra Day Chart (22-May-2017):-
 |
| Just click on chart for its enlarged view |
1- Whole day Down moves in Bullish Falling Channels
2- Whole day actual trading between 9428-9498
Conclusions from intra day chart analysis
Following lines were told on 20-05-2017 in "Firstly Watch Most Crucial Level in Next Week":-
1- firstly up moves are expected in next week
2- but within last Friday trading range(9391-9505).
As was told 100% same happened and:-
1- Nifty moved up 70 points in first minute today.
2- Nifty traded whole day within last Friday trading range(9391-9505) between 9427.90-9498.65 today.
Immediate supports of Nifty are as follows:-
1- 9427-9440
2- 9391-9425
3- 9373-9387
Next resistances of Nifty are as follows:-
1- 9479-9505
2- 9518-9532
Last 9 sessions most time trading within 9373-9532 with above mentioned supports and resistance but up moves are firstly expected tomorrow towards next resistances because Whole day consolidation today through Down moves in Bullish Falling Channels and follow up consolidation is also firstly required in the coming sessions to cross resistances.
Firstly Watch Most Crucial Level in Next Week
Intra Day Chart Analysis & Market Outlook
(22-05-2017)
Nifty-Intra Day Chart (19-May-2017):-
 |
| Just click on chart for its enlarged view |
1- Selling between 9479-9505
2- 2 Hours down moves
3- Consolidation between 9391-9425
4- Whole day actual trading between 9391-9505
Conclusions from intra day chart analysis
As positive Asian markets and in reaction good up moves after Green opening but selling at higher levels also therefore after that 2 hours more than 100 points down moves. Although slipping below 9400 but good consolidation at lower levels of the day therefore firstly up moves are expected in next week but within last Friday trading range(9391-9505).
Following conclusive lines were told on 18-05-2017 in "Firstly watch immediate Supports for the life of today started correction continuation/completion":-
firstly valid break out of above mentioned immediate support ranges(9427-9472) should be watched for the life of today started correction continuation/completion.
Immediate supports Were told above 9427 and Nifty closed at 9427.90 yesterday as well as good consolidation was seen just below it between 9391-9425 therefore these supports levels has become most crucial. Above mentioned supports should be firstly watched amid on going correction because until Nifty will not sustain below them after complete fresh selling till then decisive down moves will not be seen and finally sustaining above 9427 will mean rally continuation after correction completion yesterday.
Firstly watch immediate Supports for the life of today started correction continuation/completion
Intra Day Chart Analysis & Market Outlook
(19-05-2017)
Nifty-Intra Day Chart (18-May-2017):-
 |
| Just click on chart for its enlarged view |
1- Selling between 9481-9489
2- Down moves in Bullish Falling Channel
3- Selling between 9467-9477
4- Last 2 hours Down moves in Bullish Falling Channel
5- Whole day actual trading between 9418-9489
Conclusions from intra day chart analysis
Following lines were told yesterday in "Very short term correction expectations":-
1- very short term correction is expected tomorrow
2- As following supports are lying therefore until Nifty will not sustain below them after follow up selling till then decisive down moves will not be seen:-
1- 9462-9472
2- 9427-9440
Very short term correction was seen today after gap down opening and Nifty closed within above mentioned 2nd support range at 9429.45. Although some selling but good consolidation also developed through Down moves in Bullish Falling Channels today therefore firstly valid break out of above mentioned immediate support ranges(9427-9472) should be watched for the life of today started correction continuation/completion.
Very short term correction expectations
Intra Day Chart Analysis & Market Outlook
(18-05-2017)
Nifty-Intra Day Chart (17-May-2017):-
 |
| Just click on chart for its enlarged view |
1- Up moves in Bearish Rising Channels
2- Selling between 9518-9532
3- Whole day actual trading between 9487-9532
Conclusions from intra day chart analysis
Although today closing near the higher levels of the day but sufficient intraday selling patterns formations today therefore very short term correction is expected tomorrow. As following supports are lying therefore until Nifty will not sustain below them after follow up selling till then decisive down moves will not be seen:-
1- 9462-9472
2- 9427-9440
Valid break out crucial levels will decide next trend
Intra Day Chart Analysis & Market Outlook
(15-05-2017)
Nifty-Intra Day Chart (12-May-2017):- |
| Just click on chart for its enlarged view |
1- Whole day Down moves in Bullish Falling Channels
2- Whole day actual trading between 9373-9437
Conclusions from intra day chart analysis
Following lines were told on 11-05-2017 in "Today started correction continuation expectations":-
1- As good intraday consolidation above 9374 yesterday and equally good selling below 9450 today
2- therefore Nifty will firstly slip towards 9374 and prepare for next decisive moves within 8374-9450
As was told 100% same happened and firstly Nifty slipped towards 9374 and recovered after intraday lowest formations at 9372.55 as well as closed within mentioned trading range(8374-9450) at 9400.90 on 12-05-2017.
Whole day good consolidation through Down moves in Bullish Falling Channels on 12-05-2017 therefore up moves are expected towards 9450 next Monday but sustaining above it is must after follow up complete consolidation because good selling was seen below 9450 on 11-05-2017.
Finally same view which was updated on 11-05-2017 that Nifty will prepare for next decisive moves within 8374-9450 as well as valid break out this range will decide next trend which should be watched in the coming sessions because these levels have become crucial now.
Today started correction continuation expectations
Intra Day Chart Analysis & Market Outlook
(12-05-2017)
Nifty-Intra Day Chart (11-May-2017):-
 |
| Just click on chart for its enlarged view |
1- Up moves in Bearish Rising Channel
2- Selling between 9446-9450
3- Selling between 9436-9445
4- Whole day actual trading between 9412-9450
Conclusions from intra day chart analysis
Very Short Term Correction possibility was told yesterday and Nifty closed near the intraday lower levels of the day today after higher levels good selling therefore firstly today started correction continuation is expected tomorrow,
As good intraday consolidation above 9374 yesterday and equally good selling below 9450 today therefore Nifty will firstly slip towards 9374 and prepare for next decisive moves within 8374-9450 as well as valid break out this range will decide next trend which should be watched in the coming sessions.
Rally Continuation after Very Short Term Correction completion
Intra Day Chart Analysis & Market Outlook
(11-05-2017)
Nifty-Intra Day Chart (10-May-2017):-
 |
| Just click on chart for its enlarged view |
1- Up moves after opening
2- Consolidation between 9374-9392
3- Slow up moves in last hour
4- Whole day actual trading between 9336-9414
Conclusions from intra day chart analysis
As IMD forecast of better Mansoon yesterday evening therefore firstly up moves after positive opening and after that consolidation also between 9374-9392 but after that slow up moves in last hour therefore rally continuation is expected after Very Short Term Correction completion and until Nifty will not sustain below 9374 after complete selling till then decisive down moves will not be seen.
8308-8338 will confirm next Big Moves
Intra Day Chart Analysis & Market Outlook
(10-05-2017)
Nifty-Intra Day Chart (09-May-2017):- |
| Just click on chart for its enlarged view |
1- Consolidation between 8308-8321
2- Consolidation between 8310-8320
3- Selling between 8330-8338
4- Selling between 8324-8330
5- Selling between 8323-8330
6- Whole day actual trading between 8308-8338
Conclusions from intra day chart analysis
Following lines were told yesterday in "Intra Day Chart Analysis & Market Outlook(09-05-2017)":-
Firstly lower levels supports but after that most time sideways trading with Mixed Patterns formations therefore on going correction continuation/completion will get confirmation from valid break out today trading range(9298-9338) which should be firstly watched in the coming sessions.
As again whole day narrow range today trading with higher levels selling and lower levels consolidation means Mixed Patterns today and:-
1- Today whole day 30 points trading within yesterday trading range
2- Today closing within yesterday trading range at 8316.85
As last 2 sessions trading within 8308-8338 with Mixed Patterns formations and its valid break out will give first strong signal of next big moves which should be watched in the coming sessions for confirmations.
Intra Day Chart Analysis & Market
Outlook(09-05-2017)
Nifty-Intra Day Chart (08-May-2017):- |
| Just click on chart for its enlarged view |
1- Support between 9298-9310
2- Most time sideways trading with Mixed Patterns formations between 9307-9329
3- Whole day actual trading between 9298-9338
Conclusions from intra day chart analysis
Firstly lower levels supports but after that most time sideways trading with Mixed Patterns formations therefore on going correction continuation/completion will get confirmation from valid break out today trading range(9298-9338) which should be firstly watched in the coming sessions.
Subscribe to:
Posts (Atom)