ॐ ह्रीं श्रीं लक्ष्मीभयो नमः॥


Trading "calls" from our "Software" with more than "90% accuracy"

More than "12 years" old "only site of whole world" 
with more than "9700 accurate Outlooks" of 
"Indian Stock Markets" 
Intra Day Chart Analysis & Market 
Outlook(07-09-2016)
Nifty-Intra Day Chart (06-Sep-2016):-
Just click on chart for its enlarged view
Technical Patterns and Formations in today intraday charts

1- First 4 hours slow up moves
2- Fast Up  moves in last hours
3- Whole day actual trading between 8849-8950

Conclusions from intra day chart analysis 

Firstly more than 40 points gap up opening and after that slow up moves which may be a selling indication but after that fast Up  moves also in last hours therefore as such no one sided intraday position formations today. 

As complete selling was not seen and whole day strong rally continuation therefore more up moves can not be ruled out in the coming sessions because strong rally is on and as such no intraday selling yet.

It must be kept in mind that until clear and complete fresh selling patterns formations will not develop till then correction will not be seen,let it happen then correction beginning will be considered despite overbought indicators.
8824 will confirm Rally Continuation towards 9764.10 
Technical Analysis,Research & Weekly Outlook
(Sep 06 to Sep 09,2016)

Nifty-EOD Chart (02-Sep-2016):-
Just click on chart for its enlarged view
Technical Patterns and Formations in EOD charts

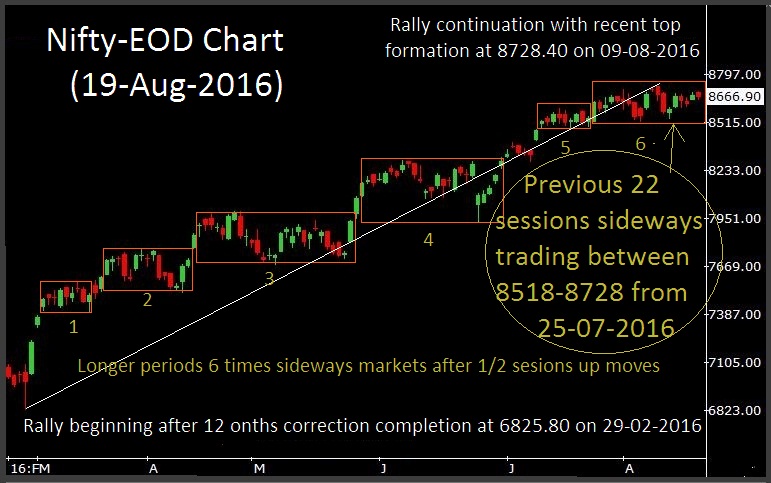
1- Impulsive Wave-1 beginning after bottom formation at 6825.80 on 29-02-2016
2- Wave-1(7992 on 28-04-2016)
3- Wave-2(7678.35 on 06-05-2016)
4- Wave-i of Wave-3(8294.95 on 07-06-2016)
5- Wave-ii of Wave-3(7927.05 on 24-06-2016)
6- Wave-iii of Wave-3 continuation with recent top formation at 8824.10 on 02-09-2016)

Intra Day Chart Analysis(02-09-2016)

Nifty-Intra Day Chart (02-Sep-2016):-
Just click on chart for its enlarged view
Technical Patterns and Formations in today intraday charts

1- Consolidation between 8769-8787
2- Mixed Patterns formations in last hours between 8805-8824 
3- Whole day actual trading between 8769-8824

Conclusions from intra day chart analysis 

Following lines were told at 10:08 AM on 02-09-2016 in "Post-open Outlook(02-09-2016)":-

1- some indications of consolidation in first 50 minutes today
2- therefore sustaining below yesterday lowest(8760) should be firstly watched for fresh down moves.

Firstly some indications of consolidation in first 50 minutes and after that follow up consolidation between 8769-8787 therefore it will be immediate support of Nifty and until Nifty will not sustain below 8760 after fresh selling till then decisive down moves will not be seen.  

Conclusions (After Putting All Studies Together)

Following lines were told on 16-08-2016 in "Valid break out last 18 sessions sideways trading range will confirm next trend":-

Nifty should not move above 8810.80 otherwise Waves will be counted in that manner which has been updated in previously Weekly Analysis topics. 

As Nifty had moved above 8810.80 in previous week therefore Waves of Post Budget 1916-1917 Rally is being counted in above mentioned manner because that will be applicable now.

Nifty traded 28 sessions between 8518-8728 and this range was broken out 30-08-2016 as well as closed above it in all 3 sessions after that therefore all trends are up. Although some selling on 31st Aug and 01 Sep but lower levels good consolidation was also seen on 02-09-2016 therefore rally continuation hopes are alive and once valid break out of last 3 sessions highest(8824) will mean on going rally continuation towards next target(9764.10). Just click following topic link which was posted on 10-07-2016 and understand the calculation of mentioned target:-


Now Wave-iii of Wave-3 is on and as per Elliott Wave theory Wave-3 of any degree can gain maximum points therefore high possibility of rally continuation and for precaution and confirmations only watch valid break out of last 3 sessions highest(8824).  
Post-open Outlook(02-09-2016)

As intraday selling patterns formations in last 2 sessions therefore not sustaining at higher levels and slipping as well but some indications of consolidation in first 50 minutes today therefore sustaining below yesterday lowest(8760) should be firstly watched for fresh down moves.
Today Started Correction Continuation Expectations
Intra Day Chart Analysis & Market Outlook
(02-09-2016)

Nifty-Intra Day Chart (01-Sep-2016):-
Just click on chart for its enlarged view
Technical Patterns and Formations in today intraday charts

1- Selling between 8792-8811
2- Selling between 8800-8813
3- Whole day actual trading between 8760-8813

Conclusions from intra day chart analysis 

Following lines were told yesterday in "Down Moves Expectations":-

sufficiently good intraday selling patterns formations today therefore some down moves are being expected in the coming sessions.

As follow up selling today after yesterday selling therefore today started down moves continuation is expected in the coming sessions and correction of that rally will be firstly seen which started on 29-08-2016 from 8544.
Down Moves Expectations
Intra Day Chart Analysis & Market Outlook
(01-09-2016)

Nifty-Intra Day Chart (31-Aug-2016):-
Just click on chart for its enlarged view
Technical Patterns and Formations in today intraday charts

1- Selling between 8778-8801
2- Up moves in Bearish Rising Channel
3- Selling between 8802-8819
4- Whole day actual trading between 8755-8819

Conclusions from intra day chart analysis 

Although whole day Green zone trading and 0.42% positive closing as well but sufficiently good intraday selling patterns formations today therefore some down moves are being expected in the coming sessions.
As busy therefore Stock Market Outlook of today and tomorrow will not be updated 
Deeper Correction Possibility

We told many times for "Deeper Correction Possibility" in the previous Outlooks from 18-08-2016 which can be verified also from all the Outlooks on Home page. As following news may be its trigger therefore just click following topic link and prepare yourself:-

Crucial Levels Breaking Down will confirm Deeper Correction
Technical Analysis,Research & Weekly Outlook
(Aug 29 to Sep 02,2016)
Nifty-EOD Chart (26-Aug-2016):-
Just click on chart for its enlarged view
Technical Patterns and Formations in EOD charts

1- Wave 1 of fresh Rally beginning after 12 months correction completion at 6825.80 on 29-02-2016
2- Wave-1(7583.70 on 14-03-2016) 
3- Wave-2(7405.20 on 16-03-2016)
4- Wave-3(8288.90 on 08-06-2016)
5- Wave-4(7927.10 on 24-06-2016)
6- Wave-5(8728.40 on 09-08-2016) 
7- Previous 27 sessions sideways trading between 8518-8728 from 25-07-2016 
8- Previous 9 sessions sideways trading range(8580-8687) broken down on 26-08-2016 

Fibonacci Retracement levels of Post Budget 2016-2017 Rally(6826-8728)

Nifty-EOD Chart (26-Aug-2016):-
Just click on chart for its enlarged view
Fibonacci retracement levels in EOD charts

1- 13.0%- 8480
2- 23.6%- 8279
3- 27.0%- 8214
4- 38.2%- 8001(Crucial)
5- 50.0%- 7777(Crucial)
6- 61.8%- 7552(Crucial)
7- 70.7%- 7383
8- 76.4%- 7274
9- 78.6%- 7233 
10-88.6%- 7042 

Intra Day Chart Analysis(26-08-2016)

Nifty-Intra Day Chart (26-Aug-2016):-
Just click on chart for its enlarged view
Technical Patterns and Formations in today intraday charts

1- All Down moves in Bullish Falling Channels
2- Whole day actual trading between 8548-8622

Conclusions from intra day chart analysis 

Although whole day down moves but all in  Bullish Falling Channels therefore an indication of some up moves in the beginning of next week.

Conclusions (After Putting All Studies Together)

Trends of Nifty are as follows:-

1- Long Term Trend is up. 
2- Intermediate Term Trend is up. 
3- Short Term Trend is sideways for the last 27 sessions between 8518-8728 

Next resistances of Nifty are as follows:-

1- 8602-8635
2- 8658-8687
3- 8686-8710
4- 8708-8723

Next supports of Nifty are as follows:-

1- 8546-8565
2- 8518-8540
3- 8476-8506
4- 8448-8463

Post Budget Rally started from 6825.80 on 29-02-2016 and now it is on with its Wave-5 highest formation at 8728.40 on 09-08-2016. As oscillators have turned overbought on weekly Charts and some have started to show negative divergence also therefore possibility of Intermediate Term Correction is very much on and its first indication was seen on 26-08-2016 through breaking down of last 9 sessions sideways trading range(8580-8687). Although closing was below the lowest of last 9 sessions trading range lowest(8580) at 8572.55 but intraday charts have not shown fresh selling patterns and some intraday consolidation was also seen therefore some up moves above 8580 can not be ruled out in the beginning of next week. 

It should be kept in mind that correction beginning confirmation will mean correction after Wave-5 completion therefore possibly deeper correction of whole Post Budget rally(6826-8728) will be seen according to above mentioned Fibonacci Retracement levels and its beginning confirmation will be according to valid break down of following levels:-

1- Previous 9 sessions trading range(8580-8687) will be first strong indication
2- Previous 27 sessions trading range(8518-8728) will be confirmation.

Certainly deeper correction is very much due but confirmation is also required from above mentioned levels because Post Budget Rally is having history of fresh moves after sideways market therefore confirmation is must from above mentioned crucial levels breaking down. 
Deeper Correction is on Cards Now
Intra Day Chart Analysis & Market Outlook
(26-08-2016)

Nifty-Intra Day Chart (25-Aug-2016):-
Just click on chart for its enlarged view
Technical Patterns and Formations in today intraday charts

1- Selling between 8666-8683(Immediate Resistances)
2- Down moves beginning after sharp fall beginning in European markets and Dow's Futures
3- Whole day actual trading between 8584-8683

Conclusions from intra day chart analysis 

Following lines were told yesterday in "Firstly Watch Crucial Levels after Global markets led volatility Today":-

Last 8 Sessions trading between 8580-8687 with higher levels selling therefore view will not be Bullish until Nifty will not sustain above 8687 after follow up complete consolidation. Follow up selling and valid break down below 8580 will confirm decisive down moves and deeper correction possibility also.  

Although Nifty closed after strong recovery from lower levels yesterday but we were not Bullish and updated the levels between 8580-8687 in which Nifty traded whole day today within 8583.65-8683.05.

As fresh selling between 8666-8683 today and sharp fall beginning in European markets and Dow's Futures also therefore down moves were seen in last hours of the day today. Nifty traded between 8580-8687 in last 9 sessions with higher levels good selling and minor supports at lower levels therefore possibility of slipping below 8580 and deeper correction beginning can not be ruled out. As last 9 sessions lowest(8580) has become most crucial today therefore its valid break down should be firstly watched in the coming sessions for deeper correction confirmations which is on cards now.
Firstly Watch Crucial Levels after Global markets led volatility Today
Intra Day Chart Analysis & Market Outlook
(25-08-2016)

Nifty-Intra Day Chart (24-Aug-2016):-
Just click on chart for its enlarged view
Technical Patterns and Formations in today intraday charts

1- Mixed Patterns between 8634-8653
2- Volatility according to European markets and Dow's Futures
3- Up moves after sharp up in European markets and Dow's Futures
4- Whole day actual trading between 8621-8661

Conclusions from intra day chart analysis 

Although closing near the higher levels of the day but as such consolidation patterns were not seen and today moves were on the back of Global markets volatility therefore next immediate moves will be decided through previous sessions technical positions formations and Crucial levels.

Last 8 Sessions trading between 8580-8687 with higher levels selling therefore view will not be Bullish until Nifty will not sustain above 8687 after follow up complete consolidation. Follow up selling and valid break down below 8580 will confirm decisive down moves and deeper correction possibility also.  
Possibility of Correction below 8600
Intra Day Chart Analysis & Market Outlook
(24-08-2016)
Nifty-Intra Day Chart (23-Aug-2016):-
Just click on chart for its enlarged view
Technical Patterns and Formations in today intraday charts

1- Selling between 8622-8635
2- Selling between 8602-8620
3- Up moves after strong rally in European markets and Dow's Futures
4- Whole day actual trading between 8580-8642

Conclusions from intra day chart analysis 

Although closing at higher levels of the day after last hour up moves but sufficiently good selling patterns formations were also seen therefore expected that Nifty will not be able to sustain above the top(8642.15) of today. As selling was also seen in previous sessions and today as well therefore expected that finally Nifty will again slip below 8600 and deeper correction possibility also can not be ruled out despite Dow Jones now trading more than 90 points up.
Deeper Correction Confirmations from 8604 amid More Down Moves Possibility
Intra Day Chart Analysis & Market Outlook
(23-08-2016)
Nifty-Intra Day Chart (22-Aug-2016):-
Just click on chart for its enlarged view
Technical Patterns and Formations in today intraday charts

1- Slipping fast after flat opening
2- Up moves in Bearish Rising Channel
3- Whole day actual trading between 8614-8684

Conclusions from intra day chart analysis 

Firstly Slipping fast after flat opening and Up moves in Bearish Rising Channel also during last trading hours therefore more down moves can not be ruled out in the coming sessions. As deeper correction will get confirmations after breaking down confirmation of last 6 sessions trading range lowest(8604) therefore should also be watched for its confirmations.
A Correction of Typing Mistake 

Following typing mistake in levels was incurred yesterday in "Firstly Watch Crucial Levels one by one for Next Trend Confirmations":-

Following line was with wrong levels was posted:-
5 Sessions actual trading between 8503-8687 

Same line with correct levels are as follows:-
5 Sessions actual trading between 8604-8687
Firstly Watch Crucial Levels one by one for Next Trend Confirmations
Technical Analysis,Research & Weekly Outlook
(Aug 22 to Aug 26,2016)

Nifty-EOD Chart (19-Aug-2016):-
Just click on chart for its enlarged view
Technical Patterns and Formations in EOD charts

1- Wave 1 of fresh Rally beginning after 12 months correction completion at 6825.80 on 29-02-2016
2- Wave-1(7583.70 on 14-03-2016) 
3- Wave-2(7405.20 on 16-03-2016)
4- Wave-3(8288.90 on 08-06-2016)
5- Wave-4(7927.10 on 24-06-2016)
6- Wave-5 continuation with recent top formation at 8728.40 on 09-08-2016 
7- Previous 22 sessions sideways trading between 8518-8728 from 25-07-2016 

6 times sideways markets of whole Post-Budget Rally

Nifty-EOD Chart (19-Aug-2016):-
Just click on chart for its enlarged view
Technical Patterns and Formations in EOD charts

1- Rally beginning after 12 months correction completion at 6825.80 on 29-02-2016
2- Longer periods 6 times sideways markets after 1/2 sessions up moves.
3- Previous 22 sessions sideways trading between 8518-8728 from 25-07-2016 
4- Rally continuation with recent top formation at 8728.40 on 09-08-2016

Previous 5 Sessions intraday charts analysis

Nifty-Intra Day Chart (Aug 12  to Aug 19,2016):-
Just click on chart for its enlarged view
Technical Patterns and Formations in last 5 Sessions intraday charts

1- Higher levels selling and lower levels consolidation in last 5 sessions
2- 5 Sessions actual trading between 8503-8687 

Conclusions from 5 Sessions intra day chart analysis 

As higher levels selling and lower levels consolidation in last 5 sessions between 8503-8687 and its valid break out will result strong indication of next trend therefore should be firstly watched in next week.

Intra Day Chart Analysis(19-08-2016)

Nifty-Intra Day Chart (19-Aug-2016):-
Just click on chart for its enlarged view
Technical Patterns and Formations in today intraday charts

1- Selling patterns formation between 8678-8687
2- Selling patterns formation between 8658-8670
3- Down moves in Bullish Falling Channel
4- Whole day actual trading between 8648-8687

Conclusions from intra day chart analysis 

Whole day trading within 39 points with sufficient selling patterns formations but Indian markets out performed European markets and Dow's Futures because when these 2 moved down sharply then Nifty was down moves in Bullish Falling Channel and was little weak while these 2 were too much down. 

Although selling at higher levels but some buying also can not be ruled out thorugh 3 times Down moves in Bullish Falling Channels therefore Mixed intraday patterns formations will be understood and valid break out of day's trading range(8648-8687) will give 1st indication of nrxt trend therefore should be firstly watched in the beginning of next week.

Conclusions (After Putting All Studies Together)

Trends of Nifty are as follows:-

1- Long Term Trend is up
2- Intermediate Term Trend is up
3- Short Term Trend is sideways for the last 22 sessions between 8518-8728 

Next resistances of Nifty are as follows:-

1- 8658-8687
2- 8686-8710
3- 8708-8723

Next supports of Nifty are as follows:-

1- 8546-8565
2- 8518-8540
3- 8476-8506
4- 8448-8463

Post Budget Rally started from 6825.80 on 29-02-2016 and now it is very much on. It has been a peculiar character of this rally that it turned sideways  after 1/2 sessions up moves and now also its 6th sideways market is in continuation for the last 22 sessions between 8518-8728. As sustaining it beyond will form next trend therefore should be watched for its confirmation in the coming sessions/weeks.

Maximum target of on going Waves structure is at 8810.80 and its calculations has already been updated on 16-08-2016 in "Valid break out last 18 sessions sideways trading range will confirm next trend":-

Almost 6 months old Post Budget rally which has already gained 1902 points with its recent top formation at 8728.40 is 82 points less than its defined maximum target(8810.80). As correction is very much due now because Oscillators have turned overbought on weekly Charts and some have started to show negative divergence also therefore possibility of Intermediate Term Correction will also be considered because as per above defined Waves structure Wave-5 is on and its completion confirmation below 8810.80 will mean correction of that whole whole post Budget rally which(Wave-1) started from 6825.80 on 29-02-2016. 

All the crucial levels have already been updated above which will give next trend confirmation one by one and should be firstly watched in next week. As sustaining below 22 sessions lowest(8518) without testing 8810.80 will confirm deeper correction therefore should also be kept in mind. 
Post-open Outlook(19-08-2016)

Selling patterns formations between 8671-8690 in last 5 hours yesterday and today first hour most time trading within it with some indications of consolidations.  Although now trading only 2 points down but will be safer to watch valid break out of 8671-8690 for first strong indication of next decisive moves.
Firstly Watch last 21 sessions trading range amid Deeper Correction Possibility
Intra Day Chart Analysis & Market Outlook
(19-08-2016)

Nifty-Intra Day Chart (18-Aug-2016):-
Just click on chart for its enlarged view
Technical Patterns and Formations in today intraday charts

1- Consolidation between 8651-8663
2- Selling between 8678-8690
3- Selling between 8671-8678
4- Whole day actual trading between 8651-8690

Conclusions from intra day chart analysis 

Firstly consolidation after strong opening and after that up moves also but selling patterns formations developed in last 5 hours of the day therefore down moves below today lowest(8645.05) can not be ruled out in the coming sessions.

Following resistances were updated at 08:14 AM on 16-08-2016 in "Valid break out last 18 sessions sideways trading range will confirm next trend":-

1- 8664-8684
2- 8686-8710
3- 8708-8723

Nifty failed to sustain above 1st resistance and selling patterns were also seen in last 3 sessions therefore once slipping below last 3 sessions lowest(8600) will mean correction possibility towards following supports:-


1- 8546-8565
2- 8518-8540
3- 8476-8506
4- 8448-8463

Last 21 sessions sideways market between 8518-8728 and its valid down will confirm Intermediate Term Correction of Post Budget rally which has already gained 1902 points in last 6 months and its correction is very much due now because Oscillators have turned overbought on weekly Charts and some have started to show negative divergence also. 

Multiple supports between 8448-8565 and once valid break down of 8448 will mean sharp fall towards 8303 and below it also but firstly sustaining beyond last 21 sessions trading range(8518-8728) should be watched for next trend confirmations amid above mentioned deeper correction possibility because Post Budget rally is having character of rally continuation after consolidation within sideways market since its beginning from 29-02-2016.  
Intra Day Chart Analysis & Market 
Outlook(18-08-2016)
Nifty-Intra Day Chart (17-Aug-2016):-
Just click on chart for its enlarged view
Technical Patterns and Formations in today intraday charts

1- Up moves in Bearish Rising Channel
2- Consolidation between 8633-8642
3- Sharp up
4- Down moves in Bullish Falling Channel
5- Selling between 8617-8630
6- Whole day actual trading between 8604-8687

Conclusions from intra day chart analysis 

Although firstly up moves in Bearish Rising Channel but lower levels consolidation was also seen 8633-8642 therefore following lines were told today at 10:15 AM in "Post-open Outlook(17-08-2016)":-

1- today intraday charts are showing some consolidation indications 
2- therefore view will watchful and valid break out of yesterday trading range(8601-8682) should be watched for next decisive moves confirmations.

As some consolidation therefore up moves with new intraday highest formation was also seen but as soon as European markets and Dow's Futures slipped fast from higher levels then Indian markets also moves down fast and new intraday lowest formation was also seen as well as new intraday highest and lowest formation was also seen within 1 hour.

As both intraday consolidation and selling patterns were seen today therefore valid break out of yesterday trading range(8601-8682) should be watched for next decisive moves confirmations but final trend will be decided through sustaining beyond last 20 sessions trading range(8518-8728). 

Nifty is not trending and sideways for the last 20 sessions within 210 points between 8518-8728 and next decisive moves will be seen only after sustaining it beyond otherwise today like volatility without any specific technical position formation within this range can not be ruled out in the coming sessions.
Post-open Outlook(17-08-2016)

Although flat market since opening today and now trading in Red also but today intraday charts are showing some consolidation indications therefore view will watchful and valid break out of yesterday trading range(8601-8682) should be watched for next decisive moves confirmations.
Down Moves below Today Lowest
Intra Day Chart Analysis & Market Outlook
(17-08-2016)
Nifty-Intra Day Chart (16-Aug-2016):-
Just click on chart for its enlarged view
Technical Patterns and Formations in today intraday charts

1- Selling between 8668-8682
2- Support between 8601-8621
3- Selling indications in last hour between 8639-8652
4- Whole day actual trading between 8601-8682

Conclusions from intra day chart analysis 

Although lower levels supports but sufficiently good selling today therefore down moves are expected below today lowest(8601). As both intraday supports and selling therefore firstly trading with volatility within today trading range can not be ruled out but high possibility of slipping below today lowest after follow up selling within and near about today trading range.
Valid break out last 18 sessions sideways trading range will confirm next trend
Technical Analysis,Research & Weekly Outlook
(Aug 16 to Aug 19,2016)

Nifty-EOD Chart (12-Aug-2016):-
Just click on chart for its enlarged view
Technical Patterns and Formations in EOD charts

1- Corrective Wave-A of 'ABC' beginning after life time high formation at 9119.20 on 04-03-2015
2- Wave-A(7940.30 on 12-06-2015)
3- Wave-B(8654.75 on 23-07-2015)
4- Corrective Wave-C completion at 6825.80 on 29-02-2016 and Wave 1 of fresh Rally beginning
5- Wave-1(7583.70 on 14-03-2016)
6- Wave-1 gained 757.90 points  
7- Wave-2(7405.20 on 16-03-2016)
8- Wave-3(8288.90 on 08-06-2016)
9- Wave-3 gained 883.70 points
10- Wave-4(7927.10 on 24-06-2016)
11- Wave-5 continuation with recent top formation at 8728.40 on 09-08-2016
12- On Going Wave-5 has gained 801.30 points till now 
13- Previous 18 sessions sideways trading between 8518-8728 from 25-07-2016 

Previous 18 sessions Intra Day Chart Analysis

Nifty-Intra Day Chart (Jul 25  to Aug 12,2016):-
Just click on chart for its enlarged view
Technical Patterns and Formations in last 18 Sessions intraday charts

1- Previous 18 sessions sideways trading between 8518-8728 from 25-07-2016 to 12-08-2016. 
2- Higher levels resistances and lower levels supports within previous 18 sessions trading range. 

Conclusions from 18 Sessions intra day chart analysis 

Previous 18 sessions sideways trading between 8518-8728 with higher levels resistances and lower levels supports therefore therefore valid break out of this range will decide next trend.

Intra Day Chart Analysis(12-08-2016)

Nifty-Intra Day Chart (12-Aug-2016):-
Just click on chart for its enlarged view
Technical Patterns and Formations in today intraday charts

1- Selling patterns formation between 8664-8684
2- Consolidation patterns formation between 8632-8650
3- Whole day actual trading between 8605-8684

Conclusions from intra day chart analysis 

Although 0.93% Green closing after whole day positive zone trading but selling patterns formations also therefore sustaining above day's highest after fresh consolidation is must for next decisive up moves. As consolidation patterns were also seen after some slipping therefore on going rally continuation hopes are very much alive after follow up consolidation.

Conclusions (After Putting All Studies Together)

Trends of Nifty are as follows:-

1- Long Term Trend is up
2- Intermediate Term Trend is up
3- Short Term Trend is sideways for the last 18 sessions between 8518-8728 with following resistances within this range at higher levels:-

1- 8664-8684
2- 8686-8710
3- 8708-8723

As last 18 sessions sideways trading between 8518-8728 with above resistances therefore Waves have been counted differently which is suggesting minimum Intermediate Term correction of whole Post Budget Rally 2016-17 but valid break down of 8518 will be correction beginning confirmation which should also be watched if Nifty fails to sustainin above last 18 sessions highest(8728)

Maximum target of on going Waves structure is at 8810.80 as per following calculations:-

As per Elliott Wave theory "Wave-3 should never be shorter than both Wave-1 and Wave-5. Now Wave-5 is on and it should not gain more points than Wave-3.

Wave-3 gained=883.70 points(8288.90-7405.20)

It means on going Wave-5 will not gain more than 883.70 points which started from 7927.10. Therefore maximum target of on going Wave-5 will be:-
7927.10+883.70=8810.80

Till now on going Wave-5 has gained 801.30(8728.40-7927.10) points but can not gain more than 883.70 points. It means that if on going Wave-5 fails to move above 8810.80 and sustains below 8518 then that will be confirmation of post Budget Rally 2016-17's correction which may be deeper also.

As Post Budget rally has already gained 1902 points in last 6 months and Oscillators have turned overbought on weekly Charts as well as some have started to show negative divergence therefore its correction is very much due now and firstly valid break out of last 18 sessions range(8518-8728) should be watched in next week but Nifty should not move above 8810.80 otherwise Waves will be counted in that manner which has been updated in previously Weekly Analysis topics. 

Last 18 sessions sideways market between 8518-8728 and its valid break out will confirm next trend in above mentioned manner which should be firstly watched in next week.
समस्त भारतवासियों को 70 वें स्वतंत्रता दिवस की हार्दिक शुभकामनायें 
Wishing you all Indians Happy 70th Independence Day