Firstly Watch Crucial Levels one by one for Next Trend Confirmations
Technical Analysis,Research & Weekly Outlook
(Aug 22 to Aug 26,2016)
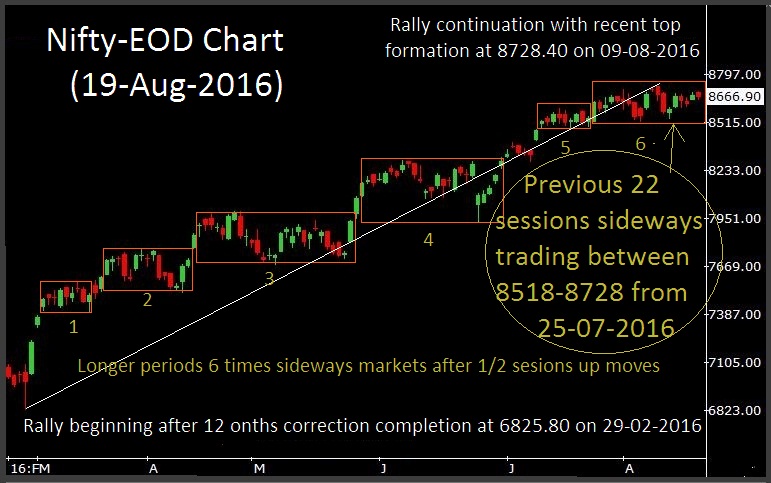
Nifty-EOD Chart (19-Aug-2016):-
 |
| Just click on chart for its enlarged view |
Technical Patterns and Formations in EOD charts
1- Wave 1 of fresh Rally beginning after 12 months correction completion at 6825.80 on 29-02-2016
2- Wave-1(7583.70 on 14-03-2016)
3- Wave-2(7405.20 on 16-03-2016)
4- Wave-3(8288.90 on 08-06-2016)
5- Wave-4(7927.10 on 24-06-2016)
6- Wave-5 continuation with recent top formation at 8728.40 on 09-08-2016
7- Previous 22 sessions sideways trading between 8518-8728 from 25-07-2016
6 times sideways markets of whole Post-Budget Rally
Nifty-EOD Chart (19-Aug-2016):-
 |
| Just click on chart for its enlarged view |
Technical Patterns and Formations in EOD charts
1- Rally beginning after 12 months correction completion at 6825.80 on 29-02-2016
2- Longer periods 6 times sideways markets after 1/2 sessions up moves.
3- Previous 22 sessions sideways trading between 8518-8728 from 25-07-2016
4- Rally continuation with recent top formation at 8728.40 on 09-08-2016
Previous 5 Sessions intraday charts analysis
Nifty-Intra Day Chart (Aug 12 to Aug 19,2016):-
 |
| Just click on chart for its enlarged view |
Technical Patterns and Formations in last 5 Sessions intraday charts
1- Higher levels selling and lower levels consolidation in last 5 sessions
2- 5 Sessions actual trading between 8503-8687
Conclusions from 5 Sessions intra day chart analysis
As higher levels selling and lower levels consolidation in last 5 sessions between 8503-8687 and its valid break out will result strong indication of next trend therefore should be firstly watched in next week.
Intra Day Chart Analysis(19-08-2016)
Nifty-Intra Day Chart (19-Aug-2016):-
 |
| Just click on chart for its enlarged view |
Technical Patterns and Formations in today intraday charts
1- Selling patterns formation between 8678-8687
2- Selling patterns formation between 8658-8670
3- Down moves in Bullish Falling Channel
4- Whole day actual trading between 8648-8687
Conclusions from intra day chart analysis
Whole day trading within 39 points with sufficient selling patterns formations but Indian markets out performed European markets and Dow's Futures because when these 2 moved down sharply then Nifty was down moves in Bullish Falling Channel and was little weak while these 2 were too much down.
Although selling at higher levels but some buying also can not be ruled out thorugh 3 times Down moves in Bullish Falling Channels therefore Mixed intraday patterns formations will be understood and valid break out of day's trading range(8648-8687) will give 1st indication of nrxt trend therefore should be firstly watched in the beginning of next week.
Conclusions (After Putting All Studies Together)
Trends of Nifty are as follows:-
1- Long Term Trend is up.
2- Intermediate Term Trend is up.
3- Short Term Trend is sideways for the last 22 sessions between 8518-8728
Next resistances of Nifty are as follows:-
1- 8658-8687
2- 8686-8710
3- 8708-8723
Next supports of Nifty are as follows:-
1- 8546-8565
2- 8518-8540
3- 8476-8506
4- 8448-8463
Post Budget Rally started from 6825.80 on 29-02-2016 and now it is very much on. It has been a peculiar character of this rally that it turned sideways after 1/2 sessions up moves and now also its 6th sideways market is in continuation for the last 22 sessions between 8518-8728. As sustaining it beyond will form next trend therefore should be watched for its confirmation in the coming sessions/weeks.
Maximum target of on going Waves structure is at 8810.80 and its calculations has already been updated on 16-08-2016 in "Valid break out last 18 sessions sideways trading range will confirm next trend":-
Almost 6 months old Post Budget rally which has already gained 1902 points with its recent top formation at 8728.40 is 82 points less than its defined maximum target(8810.80). As correction is very much due now because Oscillators have turned overbought on weekly Charts and some have started to show negative divergence also therefore possibility of Intermediate Term Correction will also be considered because as per above defined Waves structure Wave-5 is on and its completion confirmation below 8810.80 will mean correction of that whole whole post Budget rally which(Wave-1) started from 6825.80 on 29-02-2016.
All the crucial levels have already been updated above which will give next trend confirmation one by one and should be firstly watched in next week. As sustaining below 22 sessions lowest(8518) without testing 8810.80 will confirm deeper correction therefore should also be kept in mind.