ॐ ह्रीं श्रीं लक्ष्मीभयो नमः॥


Trading "calls" from our "Software" with more than "90% accuracy"

More than "12 years" old "only site of whole world" 
with more than "9700 accurate Outlooks" of 
"Indian Stock Markets" 
Live Proofs of Indian Stock Markets 100% Accurate Predictions
Nifty-Intra Day Chart(12-Feb-2016)
Live Proofs of 100% Accurate Predictions in this intraday chart
When Nifty was trading near the lower levels of the day then we told following lines today at 12:16 PM in Mid-session Outlook(12-02-2016):-

1- some indications of consolidation are emerging 
2- therefore a bounce may be seen at any time

Bounce at any time was told at 12:16 PM which started at 12:34 PM from 6869 and finished at 7034.80 after gaining 165.80 points.

For varification of above 100% Accurate predictions live proofs  have been updated above in intraday chart of  Nifty
Mid-session Outlook(12-02-2016)

As Bullish Falling Wedge formations in last 2 hours yesterday therefore Bounce Back above 7090 was expected for today and 50 Points bounce was also seen in first minute today despite following negative Global markets today:-

1- Dow Jones closed 254 points down yesterday
2- All the European markets closed 2.39% to 4.88% down yesterday.
3- Most Asian markets were trading 0.70% to 4.10% down today morning.

As all the Asian markets and Dow Jones's Futures slipped from higher levels therefore Indian markets also could not sustain at higher levels and started fresh down moves.

Correction is on and no confirmation of its completion yet amid high Global markets pressure but some indications of consolidation are emerging therefore a bounce may be seen at any time or Pull Back rally may also begin within 1/2 sessions.
Bounce Back Expectations above 7090
Intra Day Chart Analysis & Market Outlook
(12-02-2016)
Nifty-Intra Day Chart (11-Feb-2016):-
Just click on chart for its enlarged view
Technical Patterns and Formations in today intraday charts

1- Whole day down moves after weak opening
2- Bullish Falling Wedge formations in last 2 hours
3- Whole day actual trading between 6960-7208

Conclusions from intra day chart analysis

Following lines were told on 06-09-2015 in "Next Target of Nifty at 7104.30":-

All trends are down and Indian markets are in stiff grip of Bears as well as high possibility of correction continuation towards 7104.30.

As was told on 06-09-2015 all that proved 100% accurate today through Nifty slipping below 7104.30. Target of Nifty at 7104.30 was repeated also more than 10 times in previous Outlooks.

Whole day down moves after weak opening and closing near the lower levels of the day today but Bullish Falling Wedge formations in last 2 hours therefore Bounce back is expected above 7090 because Short Term Oscillators have also turned Oversold.
As busy therefore Stock Market Outlook of today is not being updated.
Firstly Watch 7242 amid Most Depressing Global Markets Tomorrow 
Intra Day Chart Analysis & Market Outlook
(10-02-2016)
Nifty-Intra Day Chart (09-Feb-2016):-
Just click on chart for its enlarged view
Technical Patterns and Formations in today intraday charts

1- Down moves in Bullish Falling Channel
2- Higher Bottoms formations in last 3 hours
3- Whole day actual trading between 7276-7323

Conclusions from intra day chart analysis 

Following conclusive lines were told yesterday at 11:46 PM in "Correction Continuation towards Next Supports":-

1- Correction is on and no confirmation of its completion yet therefore
2- its continuation is expected towards next supports(7242-7320)

Correction continuation towards next supports(7242-7320) was told and Nifty traded whole day within this range between 7276-7323 today. As some indications of consolidations through Down moves in Bullish Falling Channels and higher Bottoms formations in last 3 hours within previous supports(7242-7320) therefore possibility of some up moves above today highest(7323) will be considered at this moment but correction is very much on and lot of consolidation has to be done for decisive up moves or correction completion.   

Tumbling Global markets and as such good consolidation has not been seen yet therefore possibility of slipping below 7242 can not be ruled out but sustaining below it should be firstly watched tomorrow for fresh deeper down moves after this last support broken down confirmations. 

Finally last support of on going correction(7242-7320) will decide following next moves:-

1- Sustaining above 7320 will mean some up moves only
2- Sustaining below 7242 will mean correction continuation towards 7104/6761.

As most depressing Global markets now(Dow's Futures is trading 177 points down and all European markets are trading 1.8% to 3.2% down) and correction is on therefore sustaining beyond 7242 should be firstly watched tomorrow for first indication of above mentioned next decisive moves.
Correction Continuation towards Next Supports
Intra Day Chart Analysis & Market Outlook
(09-02-2016)
Nifty-Intra Day Chart (08-Feb-2016):-
Just click on chart for its enlarged view
Technical Patterns and Formations in today intraday charts

1- More than 5 hours selling between 7480-7512(Immediate Resistances)
2- Plummeting in last hour after sharp down moves in Dow's Futures and all European markets
3- Whole day actual trading between 7364-7512

Dow Jones's Futures- 5 Minutes Intra Day Chart from today opening to 03:30 PM(08-02-2016):-
Just click on chart for its enlarged view
Technical Patterns and Formations in today intraday charts

1- Sideways since opening
2- Sharp down in last hour

Conclusions from intra day charts analysis 

Although Nifty closed near the higher levels of the day last Friday but we were cautious due to Global markets uncertainty and excessive volatility therefore we told following conclusive lines on 07-02-2016 in "Pull Back Rally continuation require confirmations from 7448-7479 under Volatile Global Markets":-

1- Pull Back Rally continuation is expected but 
2- most uncertain and excessive volatile Global markets
3- firstly sustaining beyond 7448-7479 should be watched in the beginning of next week for confirmation

Nifty traded most time in positive zone in first more than 5 hours but with selling between 7480-7512 therefore some down moves were expected towards next strong supports(7448-7479) but that converted into huge fall because exactly at that time all the European markets and Dow Jones's Futures started to crash towards following levels at 03:30 PM today:-

1- Dow Jones's Futures which traded most time more than 50 points up but  moved down 225 points till 03:30 PM today
2- DAX which firstly traded flat but moved down 226 points till 03:30 PM today
3- FTSE which firstly traded flat but moved down 109 points till 03:30 PM today  
4- CAC 40 which firstly traded flat but moved down 110 points till 03:30 PM today

Correction is on and no confirmation of its completion yet therefore its continuation is expected towards next supports(7242-7320) after crashing like all Global markets.
Pull Back Rally continuation require confirmations from 7448-7479 under Volatile Global Markets
Technical Analysis,Research & Weekly Outlook
(Feb 08 to Feb 12,2016)
Waves Structure of on going Correction

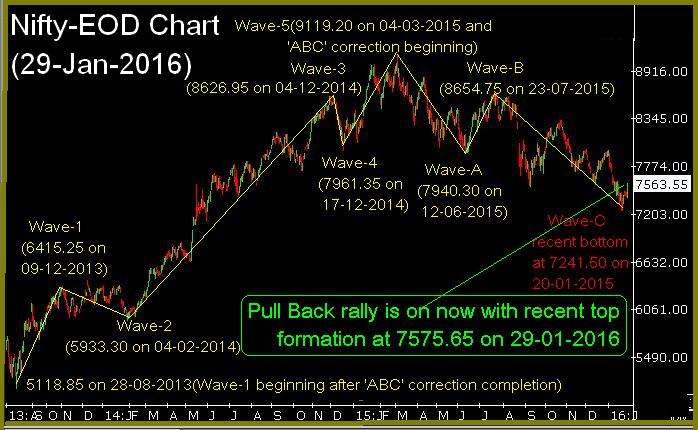
Nifty-EOD Chart (05-Feb-2016):-
Just click on chart for its enlarged view
Technical Patterns and Formations in EOD charts

1- Wave-5 completion at 9119.20 on 04-03-2015 and Wave-A of 'ABC' correction beginning after life time high formation)
2- Wave-1 of Wave-A(8269.15 on 27-03-2015)
3- Wave-2 of Wave-A(8844.40 on 15-04-2015)
4- Wave-3 of Wave-A(7997.15 on 07-05-2015)
5- Wave-4 of Wave-A(8489.55 on 22-05-2015)
6- Wave-5 of corrective Wave-A completion(7940.30 on 12-06-2015) and Wave-B beginning
7- Wave-B completion and corrective Wave-C beginning(8654.75 on 23-07-2015)
8- Wave-1 of Wave-C(7539.50 on 08-09-2015)
9- Wave-2 of Wave-C(8336.30 on 26-10-2015)
10- Wave-3 of Wave-C(7241.50 on 20-01-2016)
11- Pull back rally continuation with recent top formation at 7600.45 on 01-02-2016

Nifty-Analysis of 12 Sessions Hourly Chart
(Jan 20 to Feb 05,2016)

Nifty-Hourly Chart Day Chart (Jan 20 to Feb 05,2016):-
Just click on chart for its enlarged view
Technical Patterns and Formations in last 5 Sessions intraday charts

1- Pull Back rally beginning at 7241.50 on 20-01-2016
2- Short Term correction beginning after Pull Back rally recent top formation at 7600.45 on 01-02-2016
3- Recent bottom formation of Short Term correction at 7350.30 on 03-02-2016 and Up moves beginning
4- Pull Back Rally Recent bottom formation near 61.8% Retracement level 
5- Fresh up moves with recent top formation at 7503.15 on 05-02-2016 

Nifty-Micro Analysis of Intra Day Chart
(05-Feb-2016)

Nifty-Intra Day Chart (05-Feb-2016):-
Just click on chart for its enlarged view
Technical Patterns and Formations in today intraday charts

1- More than 5 hours consolidation between 7448-7479 
2- Whole day actual trading between 7407-7503

Conclusions(After Putting All Studies Together)

Detailed analysis of EOD charts have already been updated on 01-02-2016 in "Pull Back rally continuation after follow up consolidation". As no material change in Waves structure therefore not being repeated and "Waves Structure of on going Correction" is being posted now which was not done on 01-02-2016:-

'ABC' correction of that rally is on which started from 5118.85 on 28-08-2013 and completed at 9119.20 on 04-03-2015. Now Wave-3 of Wave-C continuation with recent bottom formation at 7241.50 on 20-01-2016. Although Pull back rally started from 7241.50 and its recent top formation at 7600.45 on 01-02-2016 but no confirmation of on going Long Term correction completion yet. 

Correction of Pull back rally with lower levels supports near its 61.8% Retracement level in previous week and more than 5 hours consolidation between 7448-7479 was also on 05-02-2016 therefore strong indications of on going Pull Back rally continuation after its Short Term correction completion at 7350.30 on 03-02-2016. 

Technically Nifty is well prepared for on going Pull Back Rally continuation towards and above its recent top(7600.45) but Global markets are most uncertain and highly volatile therefore Indian markets are also reacting them accordingly. Dow Jones slipped 211 points last Friday and if Asian markets also react negative next Monday then Indian markets may also trade weak in the beginning of next week. As more than 5 hours very good consolidation between 7448-7479 last Friday therefore until Nifty will not sustain below 7448 after such good fresh selling till then decisive down moves will not be seen. 

Pull Back Rally continuation is expected but most uncertain and excessive volatile Global markets therefore firstly sustaining beyond 7448-7479 should be watched in the beginning of next week for confirmation.
Just Watch Crucial levels amid Global Markets led High volatility
Intra Day Chart Analysis & Market Outlook
(05-02-2016)
Nifty-Intra Day Chart (04-Feb-2016):-
Just click on chart for its enlarged view
Technical Patterns and Formations in today intraday charts

1- Only intraday volatility
2- Whole day actual trading between 7366-7457

Conclusions from intra day chart analysis 

As Dow Jones closed 183 points up yesterday and its Futures was also trading more than 65 points up today morning therefore most Asian markets were trading in Green and some were more than 1% up,resultant Indian markets opened with good gains as well as Nifty moved up 65 points in first 2 minutes. Although Nifty closed 42 points up today but on EOD chart Doji candle(indecision) formation today which means market is undecided for any side next Short Term Trend.

As Nifty got supports at and above 7350 and in last 2 sessions and next supports below it are between 7242-7320 therefore if finally Nifty sustains above it then fresh rally will be seen after previous Pull Back Rally correction completion. 

High volatility in all the Global markets therefore in reaction Indian markets also remained very choppy in this week and as such one sided intraday technical positions formation were also not seen in previous sessions. As no gossiping never guessing and whatsoever intraday charts analysis suggest,only that is always updated therefore let clear patterns develop then next decisive moves will be updated accordingly otherwise till then just watch above mentioned crucial levels for confirmation amid such high volatile markets:-

1- Next supports are between 7242-7320 and its valid breaking down will mean again decisive down moves.
2- Next resistances are between 7552-7640 and its valid breaking out will mean fresh strong up moves. 
As busy in a marriage therefore today Outlook will not be updated but Mid Session Outlook may be posted during trading hours today.
Pre-open Outlook(03-02-2016)

Crashing like situation in all the Global markets in following manner today morning:-

1- All the Asian markets are trading 1% to 3.1% down.
2- Dow Jones closed 1.8% down yesterday
3- All the European markets closed 1.8% to 3.0% down yesterday.

As sentiment is completely depressed today morning therefore gap down opening below next supports(7420-7447) will be seen in Indian market also. Next supports below it are between 7242-7320 and once sustaining below 7420 will mean testing of next supports.

We posted following topic on 01-02-2016 and just keep in mind today also:-

Fresh Long Positions after Today started Correction Completion Confirmations

Correction started on 01-02-2015 and same day we clearly told through above topic that fresh buying should be done after correction completion confirmations.
Firstly Watch Next Sufficiently Strong Supports
Intra Day Chart Analysis & Market Outlook
(03-02-2016)
Nifty-Intra Day Chart (02-Feb-2016):-
Just click on chart for its enlarged view
Technical Patterns and Formations in today intraday charts

1- Firstly RBI Credit policy led high volatility
2- Last 2 hours down moves after European markets weakness and Dow's Futures more than 110 points slipping
3- Whole day actual trading between 7429-7576

Conclusions from intra day chart analysis 

As 25 BPS cut in Repo rate was expected today but RBI keeps repo rate & CRR unchanged in monetary policy review therefore immediate fall after its announcement. Although some recovery was seen in mid session but again sharp fall after European markets weakness and Dow's Futures more than 110 points slipping.

It is clear that today intraday moves were completely news based and not after technical positions formations therefore final conclusions will be drawn through EOD charts and levels:-

1- Correction of that Pull Back rally is on which started on 20-01-2016 from 7242 and completed on 01-02-2016 at 7600
2- Resistances between 7552-7606 were updated in previous Outlooks and Nifty could not cross this range but sharply slipped below it after follow up selling within it yesterday
3- Next supports are between 7420-7447 and once sustaining below 7420 will mean again sharp fall towards next supports(7242-7320)

Following conclusive lines were told yesterday in "Fresh Long Positions after Today started Correction Completion" Confirmations" and being repeated for tomorrow Outlook:-

1- some more correction can not be ruled out in the coming sessions 
2- Next decisive up moves will be seen after follow up consolidation and sustaining above 7640 
3- let today started correction completion confirmations come then fresh long positions should be created.

As next supports are between 7420-7447 are sufficiently strong therefore firstly sustaining it beyond should be watched tomorrow for yesterday started correction continuation/completion.
Fresh Long Positions after Today started Correction Completion Confirmations
Intra Day Chart Analysis & Market Outlook
(02-02-2016)
Nifty-Intra Day Chart (01-Feb-2016):-
Just click on chart for its enlarged view
Technical Patterns and Formations in today intraday charts

1- Minor support between 7558-7571
2- Selling between 7586-7600
3- More than 4 hours Down moves in Bullish Falling Channel
4- Whole day actual trading between 7542-7600

Conclusions from intra day chart analysis 

Following conclusive lines were told at 01:49 AM today in "Pull Back rally continuation after follow up consolidation":-

1- Very Short Term oscillators turned overbought after last 7 sessions rally
2- resistances are also lying just above previous session highest
3- intraday correction from intraday higher levels may be seen any day


As was told 100% same happened today and intraday correction from intraday higher levels was seen today. 

Although some selling near the higher levels of the day today but more than 4 hours Down moves in Bullish Falling Channel was also seen therefore today intraday correction will be understood a part of follow up consolidation process after last 7 sessions 334 points Pull Back Rally.

Resistances between 7552-7606 were updated in previous Outlook and today selling within this range between 7586-7600 and next resistances are also lying up to 7640 as well as correction of previous 334 points rally has also begun today therefore possibility of some more correction can not be ruled out in the coming sessions but finally Pull Back rally continuation is still expected after follow up consolidation.

Next decisive up moves will be seen after follow up consolidation and sustaining above 7640 and let today started correction completion confirmations come then fresh long positions should be created.
Pull Back rally continuation after follow up consolidation
Technical Analysis,Research & Weekly Outlook(Feb 01 to Feb 05,2016)
Nifty-EOD Chart (29-Jan-2016):-
Just click on chart for its enlarged view
Technical Patterns and Formations in EOD charts

1- 5118.85 on 28-08-2013(Wave-1 beginning after 'ABC' correction completion)
2- Wave-1(6415.25 on 09-12-2013)
3- Wave-2(5933.30 on 04-02-2014)
4- Wave-3(8626.95 on 04-12-2014)
5- Wave-4(7961.35 on 17-12-2014)
6- Wave-5(9119.20 on 04-03-2015 and 'ABC' correction beginning)
7- Wave-A(7940.30 on 12-06-2015)
8- Wave-B(8654.75 on 23-07-2015)
9- Wave-C recent bottom at 7241.50 on 20-01-2016
10- Pull Back rally is on now with recent top formation at 7575.65 on 29-01-2016

10 Months Correction in Bullish Flag formations 

Nifty-EOD Chart (29-Jan-2016):-
Just click on chart for its enlarged view
Technical Patterns and Formations in EOD charts

1- 5118.85 on 28-08-2013
2- Wave-5 completion at 9119.20 on 04-03-2015 and Wave-A of 'ABC' correction beginning after life time high formation)
3- Recent bottom of correction at 7241.50 on 20-01-2016
4- 10 Months correction in Bullish Flag formations

Fibonacci Retracement levels of on going ABC Correction

Nifty-EOD Chart (29-Jan-2016):-
Just click on chart for its enlarged view
Technical Patterns and Formations in EOD charts

1- 5118.85 on 28-08-2013(Wave-1 beginning after 'ABC' correction completion)
2- Wave-5 completion at 9119.20 on 04-03-2015 and 'ABC' correction beginning
3- Wave-C continuation with recent bottom formation at 7241.50 on 20-01-2016
4- Crucial 50.0% retracement level is at 7118 which is little below recent bottom

 Conclusions (After Putting All Studies Together)

Trends of Nifty are as follows:-

1- Short Term Trend is up
2- Intermediate Term Trend is down and will be up after sustaining above 7721
3- Long Term Trend is down and will be up after sustaining above its decider 200 Day EMA(today at 7971) 

That Wave-1 which started on 28-08-2013 from 5118.85 gained 4000 points and completed at 9119.20 on 04-03-2015 after many times new life times high formation and after that its 'ABC' correction started which is in continuation now and no confirmation of its completion yet.

ABC correction of 4000 points rally between 5118-9119 is on which will correct according to following Fibonacci Retracement levels:-

1- 13.0%- 8598
2- 23.6%- 8174
3- 27.0%- 8038
4- 38.2%- 7590(Crucial)
5- 50.0%- 7118(Crucial)
6- 61.8%- 6646(Crucial)
7- 70.0%- 6290
8- 76.4%- 6062
9- 78.6%- 5974 
10-88.6%- 5574 

Next supports of Nifty are as follows

1- 7420-7447
2- 7242-7320

Next resistances of Nifty are as follows

1- 7552-7606
2- 7614-7640
3- 7675-7721(Gap)

Whole 10 months correction from 9119.20 to 7241.50 in Falling channel with Bullish Flag formations. As Flag will remain valid up to near about 7100 and 50% retracement level is also near it at 7118 therefore strong possibility of correction completion will be considered near about 7100. If on going correction finally completes above 7100 then that will be confirmation of Bullish Flag validity which will mean fresh rally above life time high(9119.20) after 18 months(Aug,28 2013-Apr,04 2015) long and 4000 points(5118.85-9119.20) rally correction completion.

Although 334 points strong recovery from lower levels in last 7 sessions but no confirmation of on going big correction completion which will be considered after sustaining above Long Term Trend decider 200 Day EMA(today at 8971).

Certainly Pull Back Rally is on and its continuation will be seen because no selling pattern yet but a Bullish development last Friday after 3 Sessions Trading Range forcefully broken out that day.

As Very Short Term oscillators turned overbought after last 7 sessions rally and resistances are also lying just above previous session highest therefore intraday correction from intraday higher levels may be seen any day but finally Pull Back rally continuation is expected after follow up consolidation between above mentioned levels.
Last 3 Sessions Trading Range will decide next Short Term Trend
Intra Day Chart Analysis & Market Outlook
(29-01-2016)
Nifty-Intra Day Chart (28-Jan-2016):-
Just click on chart for its enlarged view
Technical Patterns and Formations in today intraday charts

1- 4 Hours consolidation between 7424-7447
2- Up moves in Bearish Rising Channel
3- Sharp fall in last hour
4- Whole day actual trading between 7410-7468

Conclusions from intra day chart analysis 

Firstly 4 Hours good consolidation between 7424-7447 but after that sharp fall in last hour today because:-

1- Selling was seen above 7447 between 7450-7465 and 7468-7487 on 25-01-2016 and more consolidation was required for sustaining above 7447.
2- Up moves above 7447 were in Bearish Rising Channel.

Last 3 sessions sideways trading within 77 points between 7410-7487 with lower levels good supports and higher levels equally good selling also. Although today closing is near the lower levels of the day after last hour sharp fall but good consolidation was also seen above 7424 today therefore sustaining below it is must after follow up selling for fresh down moves.

Certainly correction is on and no confirmation its completion yet and sustaining beyond last 3 sessions trading range(7410-7487) will decide next Short Term Trend in following manner:-

1- Sustaining below 7410 will mean correction continuation towards 7242
2- Sustaining above 7487 will mean first indication of strong Pull Back Rally but confirmation will be after sustaining above following next resistances:-

A- Resistances between 7504-7562
B- Resistances between 7552-7606
C- Resistances between 7614-7640
Mid-session Outlook(28-01-2016)

More than  4 hours trading within 29 points between 7424-7453 with lower levels supports and some consolidation today. As Nifty got supports above 7420 yesterday also therefore once sustaining above 

1- 7487 will be first indication of strong Pull Back Rally.
1- 7640 will be confirmation of strong Pull Back Rally.
Correction Continuation towards 7242 after 2 Intraday Bearish Developments
Intra Day Chart Analysis & Market Outlook
(28-01-2016)
Nifty-Intra Day Chart (27-Jan-2016):-
Just click on chart for its enlarged view
Technical Patterns and Formations in today intraday charts

1- Support between 7420-7435
2- Selling between 7460-7477
3- Mixed Patterns between 7440-7455
4- Bearish Head and Shoulders formations with Neckline at 7424
5- Whole day actual trading between 7420-7477

Conclusions from intra day chart analysis 

Following lines were told today at 10:14 AM in "Firstly watch valid break out of 7420-7487 for next decisive moves":-

1- some intraday supports seen between 7420-7435 today
2- selling was also seen between 7450-7465 and 7468-7487 on 25-01-2016
3- Firstly valid break out of 7420-7487 should be watched for next decisive moves.

Market honoured our all above levels in following manner today:-

1- Intraday supports were told between 7420-7435 and Nifty could not slip below 7420 and closed above 7435 at 7437.75 today.
2- Selling levels were told between 7450-7487 and Nifty could not move above 7487 and closed below 7450 at 7437.75 today.
3- Watching for valid break out of 7420-7487 was told with above supports and resistances and Nifty traded whole day as well as closed within this range today.

Although lower levels supports and higher levels selling is suggesting intraday Mixed Patterns formations today but following intraday developments are suggesting some down moves below today lowest(7420):-

1- Follow up selling was seen within the selling ranges of 25-01-2016. 
2- Intraday Bearish Head and Shoulders pattern formations with Neckline at 7424.

Although flat closing after most time positive zone trading today but with above mentioned 2 intraday Bearish developments therefore correction continuation towards 7242 is expected tomorrow.
Firstly watch valid break out of 7420-7487 for next decisive moves
Post-open Outlook(27-01-2016)

As positive Asian markets today morning after Dow Jones 282 points up strong closing yesterday therefore some intraday supports seen between 7420-7435 today but selling was also seen between 7450-7465 and 7468-7487 on 25-01-2016 which will be immediate Resistances of Nifty.

Firstly valid break out of 7420-7487 should be watched for next decisive moves.
Correction Continuation towards 7242
Intra Day Chart Analysis & Market Outlook
(27-01-2016)
Nifty-Intra Day Chart (25-Jan-2016):-
Just click on chart for its enlarged view
Technical Patterns and Formations in today intraday charts

1- Selling between 7468-7487(Immediate Resistances)
2- Selling between 7450-7465(Immediate Resistances)
3- Whole day actual trading between 7422-7487

Conclusions from intra day chart analysis 

Although Nifty closed near the higher levels of the day on 22-01-2016 and also opened gap up strong on 25-01-2016 but we were not Bullish but watchful therefore we told following lines at 10:30 AM on 25-01-2016 in "Firstly Watch 7462-7504 for next Very Short Term Trend beginning":-

1- Last 5 sessions trading range(7242-7462) broken out in first minute today but on the back of strong Global cues
2- its confirmation is required through sustaining above 7462.
3- Next resistances are above 7504
4- will trade between 7462-7504 for next Very Short Term Trend preparation and firstly valid break out this range should be watched for its beginning.

Valid break out of 7462-7504 with resistances above 7504 were specially mentioned despite such strong Global and Indian markets and Nifty slipped as well as closed below 7462 at 7436.15 last Monday. As good intraday selling was also seen therefore correction continuation is expected towards 7242 and its valid breaking down will open the gates of further correction towards 7104/6761.
गणतंत्र दिवस की हार्दिक शुभकामनाएं 
Happy  Republic Day
Reunite On This Republic Day To Celebrate the Victory of Our Freedom Fighters and Rejoice in the Sacrifices That Made It Possible On This Republic Day, Let Us Unite In the Chant Vande Mataram and Let the Glory of Our Land and the Spirit of India Live Forever
Firstly Watch 7462-7504 for next Very Short Term Trend beginning
Post-open Outlook(25-01-2016)

As all the Asian markets were trading in Green with .60% to 1.5% gains therefore sentiment was positive today morning and Nifty traded 51 points up in first minute after gap up opening today. Last 5 sessions trading range(7242-7462) broken out in first minute today but on the back of strong Global cues therefore its confirmation is required through sustaining above 7462.

Next resistances are above 7504 which have already been updated in previous Outlook also yesterday and Nifty has to consolidate completely for beginning of decisive up moves above it therefore will trade between 7462-7504 for next Very Short Term Trend preparation and firstly valid break out this range should be watched for its beginning.
Next Short Term Trend Confirmation through 7242-7640
Technical Analysis,Research & Weekly Outlook
(Jan 25 to Jan 29,2016)
Nifty-Intra Day Chart (Jan 18 to Jan 22,2016):-
Just click on chart for its enlarged view
Technical Patterns and Formations in last 5 Sessions intraday charts

1- Last 5 Sessions actual trading between 7242-7462 
2- Higher levels some selling patterns and lower levels some buying patterns in last 5 sessions.

Conclusions from 5 Sessions intra day chart analysis 

Last 5 sessions actual trading between 7242-7462 with higher levels some selling and lower levels some buying therefore valid break out of this range will generate next decisive moves.

Intra Day Chart Analysis(25-01-2016)

Nifty-Intra Day Chart (22-Jan-2016):-
Just click on chart for its enlarged view
Technical Patterns and Formations in today intraday charts

1- First 2 hours slow up moves
2- Last 4 hours up moves in Broadening Pattern
3- Whole day actual trading between 7328-7433

Conclusions from intra day chart analysis 

Although strong opening and whole continuous up moves but first 2 hours up moves were slow which is a selling indication and last 4 hours up moves in Broadening Pattern which is a reversal pattern therefore expected that Nifty will firstly trade and prepare for next decisive moves within and near about last Friday trading range(7328-7433) as well as possibility of some intraday volatility can not be ruled out. 

Conclusions (After Putting All Studies Together)

18 Months 4000 points strong rally from 28-08-2013(5118.85) to 04-03-2015(9119.20) and now its corrective Wave-'C' of 'ABC' correction continuation with recent bottom formation at 7241.50 on 20-01-2016 and no confirmation of its completion yet.

Last 5 sessions trading between 7242-7462 and following next resistances are lying just above it:-  

1- Resistances between 7504-7562
2- Resistances between 7552-7606
3- Resistances between 7614-7640

As little better supports at lower levels in previous week therefore Nifty will not easily sustain below previous week lowest and expected that Nifty will trade first 2/3 sessions between 7242-7640 for following next Short Term Trend:-

1- Slipping below 7242 will mean correction continuation towards 7104/6761.
2- Sustaining above 7640 will mean first indication of on going big correction completion and confirmation of strong Pull Back Rally