ॐ ह्रीं श्रीं लक्ष्मीभयो नमः॥


Trading "calls" from our "Software" with more than "90% accuracy"

More than "12 years" old "only site of whole world" 
with more than "9700 accurate Outlooks" of 
"Indian Stock Markets" 
Firstly Watch Next Crucial levels after 93 Points Bounce in first Hour Today  
Post-open Outlook(14-12-2015)

Nifty-Intra Day Chart (First hour of 14-Dec-2015):-
Just click on chart for its enlarged view
Although All the European and US markets closed in deep Red last Friday and Gap down markets of Indian markets was also expected today but we told for bounce back in following lines yesterday in"Correction Continuation after 1/2 Sessions Intraday Volatility"

1- As some intraday supports at lower levels after Bullish Falling Channel formation last Friday therefore a bounce back is firstly expected from lower levels
2- some supports and consolidation patterns were seen last Friday therefore possibility of recovery from lower levels can not be ruled out

As was told yesterday 100% same happened today and strong 93 points bounce back from lower levels after gap down opening was seen in first hour today.

Correction is on and some selling was seen between 7655-7691 in last 3 sessions therefore follow up moves with sustaining beyond these crucial levels should be firstly watched for next decisive moves.
Correction Continuation after 1/2 Sessions Intraday Volatility
Technical Analysis,Research & Weekly Outlook
(Dec 14 to Dec 18,2015)
Nifty-EOD Chart (11-Dec-2015):-
Just click on chart for its enlarged view
Technical Patterns and Formations in EOD charts

1- 5118.85 on 28-08-2013(Wave-1 beginning after 'ABC' correction completion)
2- Wave-1(6415.25 on 09-12-2013)
3- Wave-2(5933.30 on 04-02-2014)
4- Wave-3(8626.95 on 04-12-2014)
5- Wave-4(7961.35 on 17-12-2014)
6- Wave-5(9119.20 on 04-03-2015 and 'ABC' correction beginning)
7- Wave-A(7940.30 on 12-06-2015)
8- Wave-B(8654.75 on 23-07-2015)
9- Wave-C recent bottom at 7539.50 on 08-09-2015)
10- Sub Wave-5 of Wave-C continuation with recent bottom formation at 7575.30 on 11-12-2015

Nifty-Intra Day Chart (11-Dec-2015):-
Just click on chart for its enlarged view
Technical Patterns and Formations in today intraday charts

1- Mixed Patterns between 7661-7690
2- Down moves after uproar in Parliament but in Bullish Falling Channel
3- Support between 7576-7621
4- Whole day actual trading between 7576-7690

Conclusions (After Putting All Studies Together)

Detailed analysis of EOD Charts with patterns formations have already been updated in following previous weekly analysis topics:-

1- On 29-11-2015: "Bullish Flag Formation in last 9 months Correction suggesting Strong Rally"
2- On 06-12-2015: "7715 Will decide the Life of on going Correction"

Importance of 7715 was updated in previous weekly analysis topic with Neckline(7722) of 56 sessions Head and Shoulders pattern and both the levels were broken down in previous week as well as last 4 sessions closing below it therefore levels therefore emergence of some more down moves possibilities.

As whole 9 months correction from 9119.20 to 7539.50 in Falling channel with Bullish Flag formations and this pattern formation will remain valid up to near about 7119 therefore until Nifty will not slip below the Falling trend line of Flag till then expectations of fresh Rally above life time high(9119.20) will remain alive.

Wave-C is on with recent bottom at 7539.50 on 08-09-2015 and now its Sub Wave-5 continuation with recent bottom formation at 7575.30 on 11-12-2015. As no confirmation of on going correction completion yet therefore more down moves below Wave-C lowest(7539.50) is very much possible.

As some intraday supports at lower levels after Bullish Falling Channel formation last Friday therefore a bounce back is firstly expected from lower levels. All the European and US markets closed in deep Red last Friday,if in reaction such weakness reflects in Asian markets also tomorrow then Gap down markets will be seen in Indian markets. As Short Term indicators are oversold and some supports and consolidation patterns were seen last Friday therefore possibility of recovery from lower levels can not be ruled out but Pull back rally will be considered only after sustaining above 7691/7722.

Correction is on and finally its continuation is expected after some 1/2 sessions intraday volatility.
Mid-session Outlook(11-12-2015)
Nifty-Intra Day Chart (10-Dec-2015):-
Just click on chart for its enlarged view
Technical Patterns and Formations in today intraday charts

1- Last hours trading between 7655-7691 yesterday(on 11-12-2015)
2- Actual trading between 7660-7690 till 10:50 AM today(on 10-12-2015)

Conclusions from intra day chart analysis

Following lines were told yesterday in "Pull Back rally possibility amid sideways market before FOMC"

Volatility and up moves were also seen in last hours according to European markets and Dow's futures moves therefore some selling also can not be ruled out.

Although Nifty traded between 7655-7691 and also closed near the higher levels of the day yesterday but on the back of European markets and Dow's futures moves. As selling possibility was seen within this last hours range and also updated yesterday therefore first 2 hours today trading has been seen within this range between 7660-7703 for follow up moves and preparation for next decisive moves because some selling is being seen today also.


Last 4 hours trading within 7655-7691 and firstly valid break out of this range should be watched for next decisive moves confirmations.

Pull Back rally possibility amid sideways market before FOMC
Intra Day Chart Analysis & Market Outlook
(11-12-2015)
Nifty-Intra Day Chart (10-Dec-2015):-
Just click on chart for its enlarged view
Technical Patterns and Formations in today intraday charts

1- More than 4 hours consolidation between 7610-7639(Immediate Supports)
2- Sharp up
3- Volatility and up moves in last hours with European markets and Dow's futures moves.
4- Whole day actual trading between 7610-7691

Conclusions from intra day chart analysis 

Sharp up moves after 4 hours good consolidation but Volatility and up moves were also seen in last hours according to European markets and Dow's futures moves therefore some selling also can not be ruled out. As consolidation in last hour yesterday and follow up consolidation again today therefore 7608-7639 will be immediate support of Nifty and complete selling is required for decisive down moves below today lowest

Certainly emergence of Pull Back rally possibility towards next resistance range(7796-7822) but finally sustaining beyond Neckline(7722) of 57 sessions Head and Shoulders pattern should be watched in the coming sessions for correction continuation/completion confirmation.

Immediate supports and resistances of Nifty are as follows:-

1- Supports between 7610-7639
2- Resistance between 7796-7822

Expected that Nifty will remain sideways between 7610-7822 in the coming sessions and prepare for next decide moves after FOMC on 16 Dec 2015 and finally valid break out of this range will decide next immediate trend but firstly Pull Back rally is expected.
As busy in a marriage therefore Stock Market Outlook of today is not being updated.
Just Watch sustaining beyond 7715 for Decisive Moves
Intra Day Chart Analysis & Market Outlook
(08-12-2015)
Nifty-Intra Day Chart (07-Dec-2015):-
Just click on chart for its enlarged view
Technical Patterns and Formations in today intraday charts

1- Down moves in Bullish Falling Channel
2- Consolidation Patterns between 7746-7775
3- Whole day actual trading between 7746-7825

Conclusions from intra day chart analysis 

Although down moves beginning immediate after opening but in Bullish Falling Channel and lower levels consolidation Patterns formations were also seen between 7746-7775 therefore emergence of some up moves possibilities. As lot of consolidation is also required for trend reversal therefore follow up consolidation is must in the coming sessions for decisive up moves. Possibility of slipping below today lowest also can not be ruled out under consolidation process but sustaining below today lowest with fresh selling is must for it for decisive down movesImportance of 7715 and 7722 has already been updated yesterday in following topic:-

"7715 Will decide the Life of on going Correction" 

As today lowest is little above these 2 levels at 7746.05 and some down moves below today lowest can not be ruled out in consolidation process therefore firstly sustaining beyond 7715 should be watched in the coming sessions for deeper correction below 7715 and decisive up moves above 7715.
7715 Will decide the Life of on going Correction
Technical Analysis,Research & Weekly Outlook
(Dec 07 to Dec 11,2015)
9 Months Correction in Bullish Flag formations 

Nifty-EOD Chart (04-Dec-2015):-
Just click on chart for its enlarged view
Technical Patterns and Formations in EOD charts

1- 5118.85 on 28-08-2013
2- Wave-5 completion at 9119.20 on 04-03-2015 and Wave-A of 'ABC' correction beginning after life time high formation)
3- 9 Months correction completion at 7539.50 on 08-09-2015 and Wave-1 beginning
4- Wave-1(8336.30 on 26-10-2015)
6- Wave-2(7714.15 on 16-11-2015)
4- 9 Months correction in Bullish Flag formations lower falling line towards 7119

Conclusions from EOD chart analysis

'ABC' correction begun on 04-03-2015 and from 9119.20 which completed at 7539.50 on 08-09-2015 and Wave-1 of fresh rally begun which completed at 8336.30 on 26-10-2015 and now its corrective Wave-2 is on with recent bottom formation at 7714.15 on 16-11-2015. As rally started from 7714.15 after 11 sessions rounding bottom formation therefore an indication of Wave-2 correction completion was developed but strong correction was seen in last 3 sessions and firstly 7714.15 should be watched in the coming sessions for the confirmation of corrective Wave-2 completion/continuation. 

As whole 9 months correction from 9119.20 to 7539.50 in Falling channel with Bullish Flag formations and this pattern formation will remain continued towards 7119. 

Bearish Head and Shoulders pattern formations

Nifty-EOD Chart (04-Dec-2015):-
Just click on chart for its enlarged view
Technical Patterns and Formations in EOD charts

1- Head and Shoulders pattern formations in last 56 sessions
2- Neckline at 7722

Conclusions from EOD chart analysis

Head and Shoulders pattern formations in last 56 sessions with its Neckline at 7722 therefore once valid break out of 7722 will mean much deeper correction because it will be confirmation of such big 56 sessions Bearish Head and Shoulders pattern broken down confirmation.

Intra Day Chart Analysis(07-12-2015)

Nifty-Intra Day Chart (04-Dec-2015):-
Just click on chart for its enlarged view
Technical Patterns and Formations in today intraday charts

1- Selling between 7800-7812
2- Selling between 7806-7821
3- Up moves in Bearish Rising Channel
4- Down moves in Bullish Falling Channel in last hours
5- Whole day actual trading between 7776-7821

Conclusions from intra day chart analysis 

Although higher levels selling and whole day good selling as well but down moves in Bullish Falling Channel in last hours therefore some up moves are firstly possibly in last Friday trading range(7776-7821). As good selling therefore until Nifty will not above last Friday highest(7821) after follow up consolidations till then any decisive up moves will not be seen.

Conclusions (After Putting All Studies Together)

Detailed analysis of EOD Charts have already been updated in previous weekly analysis topic on 29-11-2015 in following topic:-

"Bullish Flag Formation in last 9 months Correction suggesting Strong Rally"

Emergence of Head and Shoulders pattern formations after last 3 sessions sharp fall therefore firstly valid break out of its Neckline(7722) should be watched in the coming sessions for much deeper correction because its broken down confirmation will be the validity of such big 56 sessions Bearish pattern which will open the door for fresh and decisive down moves. 

As whole 9 months correction from 9119.20 to 7539.50 in Falling channel with lower falling trend line bottom at 7119 therefore once slipping below Wave-2 bottom(7714.15) will mean correction continuation towards 7119 after Head and Shoulders's Neckline(7722) broken down confirmations. Correction is on and next immediate supports of Nifty are as follows:-

1- 7767-7778
2- 7715-7736

As some consolidation patterns were seen in last hours of previous trading session therefore firstly some up moves may be seen next Monday but good selling in previous week at higher levels therefore until complete complete consolidation will not develop till then decisive up moves will not be seen.  

Correction is on and sustaining beyond 7722/7715 should be firstly watched in next week for its continuation towards 7119 or its completion after completion consolidation above 7715.
As busy therefore Stock Market Outlook of today is not being updated.

Firstly Watch 7906
Post-open Outlook(03-12-2015)

Although all the Global markets were blasting and most GST passing possibility in previous sessions but we were cautious and told many times for watching 7906 because intraday selling patterns formations were seen in previous week and resultant gap down opening today after yesterday negative closing.

Nifty is hovering around 7906 since opening today and firstly sustaining it beyond should be watched today for next Short Term Trend.

For detailed analysis just go through previous sessions analysis which are available on Home page of this Blog.
As busy therefore Stock Market Outlook of today is not being updated.

Cautiously Bullish View
Intra Day Chart Analysis & Market Outlook
(02-12-2015)
Nifty-Intra Day Chart (01-Dec-2015):-
Just click on chart for its enlarged view
Technical Patterns and Formations in today intraday charts

1- Whole day down moves in Bullish Falling Channels
2- Whole day actual trading between 7935-7972

Conclusions from intra day chart analysis 

Although all the Asian markets were trading with good gains today morning but Indian markets traded with minor gains because Indian markets were not technically prepared for strong rally. As whole day today trading with down moves in Bullish Falling Channels therefore signals of consolidation process and resultant emergence of on going rally continuation possibility. 

As on going rally is slow and very short term indicators have moved into overbought zone as well as well as Indian market under performed Asian markets today therefore view will be cautious and strong rally will be considered after confirmation of sustaining next resistance range(8070-8152).

As intraday consolidation patterns formations today therefore view is cautiously Bullish and some up moves are expected towards 8070-8152. 
7906 Will decide Next Trend amid GST and RBI Credit Policy led Volatility 
Intra Day Chart Analysis & Market Outlook
(01-12-2015)
Nifty-Intra Day Chart (30-Nov-2015):-
Just click on chart for its enlarged view
Technical Patterns and Formations in today intraday charts

1- Multiple supports at lower levels between 7923-7941
2- Whole day actual trading between 7923-7966

Conclusions from intra day chart analysis 

As intraday selling on 25th Nov and 26th Nov in previous week and technically Indian markets were not mature for strong rally as well as consolidation was firstly required therefore decisive up moves were not seen in last 2 sessions despite most Bullish news of GST passing possibility in current session of Parliament. We cautioned in all the previous outlooks regarding this aspect,resultant no Bullish moves and flat closing today.

We also told that 11 Sessions sideways market between 7714-7906 from Nov 09 to Nov 26,2015 with rounding bottom formation on EOD charts at the bottom of correction and this range was broken out on 27-11-2015 therefore follow up consolidation is firstly required above 11 sessions range highest(7906) for decisive up moves after big news of GST  passing possibility.

Whole day trading above 7906 with multiple supports between 7923-7941 today which is first signal of sustaining above 7906 but whole day trading of today was under the shadow of GST news led heated sentiments therefore follow up consolidation with sustaining above 7906 is must in the coming sessions for decisive rally.

As RBI Credit Policy tomorrow and last 2 sessions trading with GST news led Bullish heated sentiments therefore volatility may be high tomorrow and but finally sustaining beyond 7906 will decide next trend and should be firstly watched in the coming sessions.
Firstly Watch 7906 for final reaction of GST Passing
Mid-session Outlook(30-11-2015)

Although such most Bullish news of GST passing possibility in current session of Parliament but Indian markets are flat to negative since opening today. We are repeating following lines for keeping in mind which were told yesterday in "Bullish Flag Formation in last 9 months Correction suggesting Strong Rally":-

1- Although 11 Sessions range broken out on 27-11-2015 but on the back of sudden developments of most positive expectations of GST passing 
2- selling patterns formations were also seen in last week
3- last 2 sessions up moves were on the back of strong Global markets and GST passing expectations
4- firstly follow up consolidation is required for sustaining above 11 sessions range highest(7906)
5- no confirmation of on going correction completion yet
6- Bull markets are tend to consolidate at higher levels therefore its possibility can not be ruled out because GST passing possibilities suddenly.   

If Indian markets would have been technically prepared for fresh rally then have opened gap up more than 1% today after such Bullish news(GST) but flat to negative market today because higher levels consolidation was firstly required after selling 25 Nov and 26 Nov in previous week

Expected that finally rally will remain continued but for immediate up trend firstly sustaining above 11 Sessions highest(7906) should be watched for final reaction of GST passing on Indian markets because selling patterns formations in previous week.
Bullish Flag Formation in last 9 months Correction suggesting Strong Rally 
Technical Analysis,Research & Weekly Outlook
(Nov 30 to Dec 04,2015)
Nifty-EOD Chart (27-Nov-2015):-
Just click on chart for its enlarged view
Technical Patterns and Formations in EOD charts

1- Wave-5 completion at 9119.20 on 04-03-2015 and Wave-A of 'ABC' correction beginning after life time high formation)
2- Wave-A(7940.30 on 12-06-2015)
3- Wave-B(8654.75 on 23-07-2015)
4- Wave-C(7539.50 on 08-09-2015 and Wave-1 beginning after 'ABC' correction completion)
5- Wave-1(8336.30 on 26-10-2015)
6- Wave-2(7714.15 on 16-11-2015)
7- Wave-3 is on with recent top formation at 7959.30 on 27-11-2015

9 Months Correction in Bullish Flag formations 

Nifty-EOD Chart (27-Nov-2015):-
Just click on chart for its enlarged view
Technical Patterns and Formations in EOD charts

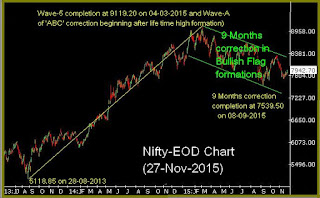
1- 5118.85 on 28-08-2013
2- Wave-5 completion at 9119.20 on 04-03-2015 and Wave-A of 'ABC' correction beginning after life time high formation)
3- 9 Months correction completion at 7539.50 on 08-09-2015 
4- 9 Months correction in Bullish Flag formations

Whole correction in Falling channel

Nifty-EOD Chart (27-Nov-2015):-
Just click on chart for its enlarged view
Technical Patterns and Formations in EOD charts

1- Wave-5 completion at 9119.20 on 04-03-2015 and correction beginning
2- Wave-C(7539.50 on 08-09-2015 and Wave-1 beginning after 'ABC' correction completion)
3- Whole correction in Falling channel

11 Sessions Trading Range broken out on 27-11-2015

Nifty-Intra Day Chart (Dec 09 to Dec 27,2015):-
Just click on chart for its enlarged view
Technical Patterns and Formations in last 12 Sessions intraday charts

1- 11 Sessions actual trading between 7714-7906
2- 11 Sessions range broken out on 27-11-2015 after PM invitation to Manmohan Singh and Soniya Gandhi to find solution for passing of GST 

Conclusions (After Putting All Studies Together)

Trends of Nifty are as follows:-

1- Short Term Trend is up
2- Intermediate Term Trend is down and will be up after sustaining above 8116
3- Long Term Trend is down and will be up after sustaining above its decider 200 Day EMA(today at 8135) 

'ABC' correction begun on 04-03-2015 and from 9119.20 which completed at 7539.50 on 08-09-2015 and Wave-1 of fresh rally begun which completed at 8336.30 on 26-10-2015 and corrective Wave-2 started which completed at 7714.15 on 16-11-2015 with following developments:-

1- 11 Sessions sideways market between 7714-7906 from Nov 09 to Nov 26,2015
2- Rounding bottom formation at the bottom of correction in last 11 sessions
3- 11 Sessions range broken out on 27-11-2015

Although 11 Sessions range broken out on 27-11-2015 but on the back of sudden developments of most positive expectations of GST passing because PM invitation to Manmohan Singh and Soniya Gandhi for finding GST passing solutions. As selling patterns formations were also seen in last week and last 2 sessions up moves were on the back of strong Global markets and GST passing expectations therefore firstly follow up consolidation is required for sustaining above 11 sessions range highest(7906). Bull markets are tend to consolidate at higher levels therefore its possibility can not be ruled out because GST passing possibilities suddenly.   

Next 3 resistances of Nifty are as follows:-

1- 8070-8152
2- 8196-8232
3- 8262-8325

Long Term Trend is down and its decider 200 Day EMA(today at 8135) is lying within above mentioned first resistance range,once sustaining above 8152 will mean strong rally after all trends turning up confirmations. As rounding bottom formation at the bottom of correction in last 11 sessions and this range has also broken out last Friday as well as big news of GST  passing therefore strong possibilities of fresh rally after follow up consolidation above 11 sessions range highest(7906).

As whole 9 months correction from 9119.20 to 7539.50 in Falling channel with Bullish Flag formations therefore sustaining above 8152 will be strong indication of this big correction completion and that will mean high possibility of fresh rally above life time high(9119.20). Although no confirmation of on going correction completion yet but Bullish Flag formations is suggesting that Nifty is mature for strong rally above 9119.20 and it is expected also.
Rally triggering after GST passing expectations 

As PM invitaion to Manmohan Singh and Soniya Gandhi to find solution for passing of GST therefore Bullish reaction of Indian markets and Nifty crossing of 11 sessions trading range(7714-7906) which is an indication of fresh rally after correction completion. Certainly GST passing will be a big boost to Indian economy and if Nifty sustains above 7906 then strong rally will be seen after 11 sessions valid break out confirmations.
Just Watch 7854-7877 for first strong signal of next big decisive moves
Intra Day Chart Analysis & Market Outlook
(27-11-2015)
Nifty-Intra Day Chart (26-Nov-2015):-
Just click on chart for its enlarged view
Technical Patterns and Formations in today intraday charts

1- More than 4 hours trading between 7854-7877 with Mixed patterns formations
2- 4 hours trading range broken out after positive opening with recovery from lower levelsof all European markets 
3- Whole day actual trading between 7832-7897

Conclusions from intra day chart analysis 

As sentiment was good after positive zone trading of all the Asian markets therefore Green opening of Indian markets. Selling was seen between 7854-7877 in last 2 sessions and Nifty was not prepared to sustain above 7877 therefore firstly more than 4 hours of trading within this range. Although some up moves above 7877 but after positive opening and recovery from lower levels of all European markets therefore view will not be Bullish because;-

1- Today intraday patterns have not shown as such consolidation but Mixed patterns formations in first 4 hours.
2- All the intraday up moves were reaction of positive Asian markets and  after 01:30 PM were due to Green European markets.

Last 11 sessions trading between 7714-7906 with and this range will decide next big moves. As good selling between 7854-7877 on 23 and 24 Nov was closing just above it at 7883.80 after Mixed patterns formations within this range as well as today whole day intraday moves were strong Global sentiments led therefore firstly valid break out of this range(7854-7877) should be watched in the coming sessions for first strong signal of next big decisive moves beyond 11 sessions trading range(7714-7906)

Post-open Outlook(26-11-2015)

As all the Asian markets are in Green and some are more than 1% up therefore positive opening of Indian markets but selling between 7854-7877 in last 2 sessions therefore could not move above it

Global sentiments are improving because most European markets closed more than 1.5% yesterday therefore possibility of higher levels consolidation amid strong sentiments can not be ruled out and firstly sustaining above last 2 sessions selling range(7854-7877) should be watched for decisive up moves under improved Global sentiments.
Emergence of Deeper Correction Possibility
Intra Day Chart Analysis & Market Outlook
(26-11-2015)
Nifty-Intra Day Chart (24-Nov-2015):-
Just click on chart for its enlarged view
Technical Patterns and Formations in today intraday charts

1- Selling patterns formation between 7854-7870
2- Whole day actual trading between 7813-7870

Conclusions from intra day chart analysis 

Following lines were told on 23-11-2015 in "Valid break out 7826-7877 will be next trend first strong indication":-

Nifty will have to prepare for next decisive moves within and near about today trading range(7826-7877),its valid break out will be next trend first strong indication and should be firstly watched tomorrow.

As was told 100% same happened and Nifty traded most time within mention range as well as closed between it at 7931.60 on 24-11-2015

Selling at higher levels on 23-11-2015 and follow up selling on 24-11-2015 also therefore expected that more down moves will be seen on 26-11-2015 and emergence of deeper correction possibility also because correction is already on and still selling continuation for the last 2 sessions.
Valid break out 7826-7877 will be next trend first strong indication
Intra Day Chart Analysis & Market Outlook
(24-11-2015)
Nifty-Intra Day Chart (23-Nov-2015):-
Just click on chart for its enlarged view
Technical Patterns and Formations in today intraday charts

1- Selling patterns formations between 7865-7877
2- Support between 7826-7843
3- Whole day actual trading between 7826-7877

Conclusions from intra day chart analysis 

When Nifty was trading in Green then following lines were told today at 12:47 PM "Mid-session Outlook(23-11-2015)":-

1- most time positive zone trading since opening today and now also Nifty is in Green
2- some selling patterns formations also seen between 7865-7877
3- firstly valid break out of 7877 should be watched now

As selling was seen between 7865-7877 in first 3 hours therefore valid break out of 7877 was told for watching and Nifty could not moves above it whole day as well as closed below mentioned selling range.   
6 Sessions most time trading range(7724-7852) broken out last Friday but not sustaining above it and today closing within this range at 7849.25. 3 Strong signals of Pull Back Rally were updated yesterday in "Rally Continuation Expectations towards 8146" and still its hopes are alive but higher levels selling was also seen today therefore follow up consolidation is also required for rally continuation after sustaining above today highest(7877) because no confirmation of on going that correction completion which started on 26-10-2015 from 8336.30.

As some intraday supports were also seen at lower levels after higher levels selling today therefore Mixed intraday patterns formations will be understood for today and Nifty will have to prepare for next decisive moves within and near about today trading range(7826-7877),its valid break out will be next trend first strong indication and should be firstly watched tomorrow.
Mid-session Outlook(23-11-2015)

Although most time positive zone trading since opening today and now also Nifty is in Green but some selling patterns formations also seen between 7865-7877 therefore firstly valid break out of 7877 should be watched now.
Rally Continuation Expectations towards 8146
Technical Analysis,Research & Weekly Outlook
(Nov 23 to Nov 27,2015)
Nifty-Intra Day Chart (Nov 12 to Nov 20,2015):-
Just click on chart for its enlarged view
Technical Patterns and Formations in last 7 Sessions intraday charts

1- 6 Sessions most time trading between 7724-7852
2- 6 Sessions trading range broken out forcefully on 20-11-2015 but closing within it after slipping in last hour.

Conclusions from 7 Sessions intra day chart analysis 

6 Sessions most time trading between 7724-7852 and this range forcefully broken out on 20-11-2015 but could not sustain at higher levels and closing within 6 sessions range therefore technically sustaining above last 6 sessions highest(7852) is firstly required for the confirmation of fresh rally after valid break out of 6 sessions sideways range.

Nifty-Intra Day Chart (20-Nov-2015):-
Just click on chart for its enlarged view
Technical Patterns and Formations in today intraday charts

1- Consolidation in first hour between 7818-7837
2- More than 3 hours onsolidation Patterns between 7881-7906
3- 36 Points sharp fall in 3 minutes
4- Down moves in Bullish Falling Channel in last hour
5- Whole day actual trading between 7818-7906

Conclusions from intra day chart analysis 

Although 36 Points sharp fall in 3 minutes during last hours of trading on 20-11-2015 but it will be understood a part of consolidation process because as such no selling patterns were seen. As whole day above mentioned consolidation patterns formations therefore strong signals of fresh up moves above day's highest(7906) after following up consolidation within previous session trading range(7818-7906)

Conclusions (After Putting All Studies Together)

Detailed analysis of EOD charts have already been updated in following previous week analysis topic on 14-11-2015:- 

Firstly Up moves Expectations amid On Going Correction

As no material change in EOD charts formations in previous week therefore in its continuation following intraday charts analysis is being updated to understand next week moves:- 

All trends are down during on going correction and no confirmation of its completion yet but following strong signals of Pull Back Rally in next week because:-

1- Rounding bottom(Bullish Pattern) formations in last 9 sessions EOD charts 
2- Good intraday consolidation at lower levels in last 9 sessions and as such selling patterns not seen.
3- Previous 6 Sessions most time trading range(7724-7852) broken out last Friday with intraday consolidation patterns formations despite slipping from higher levels in last hours.

Next 3 resistances of Nifty are as follows:-

1- 8070-8152
2- 8196-8232
3- 8262-8325

Long Term Trend decider 200 Day EMA is today at 8146 and and rally continuation is expected up to this levels. Once sustaining above it will mean clearing of above mentioned first resistance also which will be strong signal of fresh rally after all trends turning up confirmations.