Next Trend Confirmations through Crucial Levels amid Global Cues led Huge Volatility
Technical Analysis,Research & Weekly Outlook
(Aug 31 to Sep 4,2015)
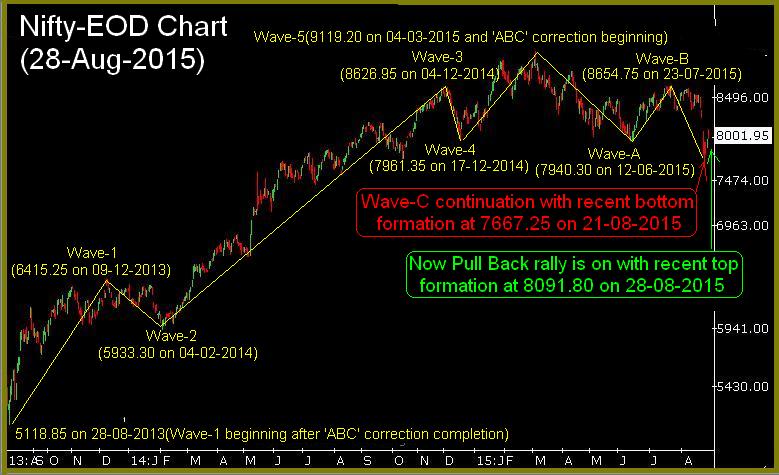
Nifty-EOD Chart (28-Aug-2015):-
 |
| Just click on chart for its enlarged view |
Technical Patterns and Formations in EOD charts
1- 5118.85 on 28-08-2013(Wave-1 beginning after 'ABC' correction completion)
2- Wave-1(6415.25 on 09-12-2013)
3- Wave-2(5933.30 on 04-02-2014)
4- Wave-3(8626.95 on 04-12-2014)
5- Wave-4(7961.35 on 17-12-2014)
6- Wave-5(9119.20 on 04-03-2015 and 'ABC' correction beginning)
7- Wave-A(7940.30 on 12-06-2015)
8- Wave-B(8654.75 on 23-07-2015)
9- Wave-C continuation with recent bottom formation at 7667.25 on 25-08-2015
10- Now Pull Back rally is on with recent top formation at 8091.80 on 28-08-2015
Conclusions from EOD chart analysis
That Wave-1 which started on 28-08-2013 from 5118.85 completed at 9119.20 on 04-03-2015 and after that its 'ABC' correction started which is in continuation and no confirmation of its completion yet despite now Pull Back rally is on with recent top formation at 8091.80 on 28-08-2015.
Waves structure of 'ABC' correction
Nifty-EOD Chart (28-Aug-2015):-
 |
| Just click on chart for its enlarged view |
Technical Patterns and Formations in EOD charts
1- Wave-5 completion at 9119.20 on 04-03-2015 and Wave-A of 'ABC' correction beginning after life time high formation)
2- Wave-1(8269.15 on 27-03-2015)
3- Wave-2(8844.40 on 15-04-2015)
4- Wave-3(7997.15 on 07-05-2015)
5- Wave-4(8489.55 on 22-05-2015)
6- Wave-5 and corrective Wave-A completion(7940.30 on 12-06-2015)
4- Wave-B(8654.75 on 23-07-2015)
6- Wave-C continuation with recent bottom formation at 7667.25 on 25-08-2015
7- Now Pull Back rally is on with recent top formation at 8091.80 on 28-08-2015
Conclusions from EOD chart analysis
Wave-A of 'ABC' correction beginning after life time high formation at 9119.20 on 04-03-2015 which completed after its 5 sub waves formations at 7940.30 on 12-06-2015. Wave-C is in continuation with recent bottom formation at 7667.25 on 25-08-2015 after completion of Wave-B at 8654.75 on 23-07-2015.
Now Pull Back rally is on with recent top formation at 8091.80 on 28-08-2015 and no confirmation of its completion yet.
Next target of Nifty at 7475.85
Nifty-EOD Chart (28-Aug-2015):-
 |
| Just click on chart for its enlarged view |
Technical Patterns and Formations in EOD charts
1- Wave-5 completion at 9119.20 on 04-03-2015 and 'ABC' correction beginning after life time high formation)
2- Wave-A(7940.30 on 12-06-2015)
3- Wave-A corrected 1178.90 Points
4- Wave-B(8654.75 on 23-07-2015)
5- Wave-C continuation with recent bottom formation at 7667.25 on 25-08-2015
6- Wave-C has corrected 987.50 Points till today
7- Now Pull Back rally is on with recent top formation at 8091.80 on 28-08-2015
8- Long Term Trend decider decider 200 Day EMA(today at 8272) broken down on 21-08-2015 and last 5 sessions closing below it.
Conclusions from EOD chart analysis
Wave-A corrected 1178.90 Points and now Wave-C continuation which has retraced 987.50 Points till today. If Wave-C corrects 100% of Wave-A then it may move down upto:-
7475.85=8654.75(Wave-B completed and Wave-C started)-1178.90(Wave-A corrected)
Wave-C of 'ABC' correction is in continuation and let market completely consolidate on EOD/weekly charts then its completion will be considered,till then its continuation will be seen according to retracement levels which are being given below..
Last 6 Sessions Intra Day Charts Analysis
Nifty-Intra Day Chart (Aug 21 to Aug 28,2015):-
 |
| Just click on chart for its enlarged view |
Technical Patterns and Formations in last 6 Sessions intraday charts
1- 164 Points gap(8061-8225) down opening on 24-08-2015 after Global markets crashing.
2- Selling between 7897-7930 on 24-08-2015
3- Selling between 7995-8010 on 24-08-2015
4- Selling between 8032-8055 on 24-08-2015
5- Support at lower levels amid high volatility on 25-08-2015
6- Global cues led high volatility on 26-08-2015
7- Whole day strong rally on 27-08-2015 after 619 points strong rally of Dow Jones
8- Trading within 164 Points gap but closing below it on 28-08-2015 with selling patterns formation between 8066-8091
9- 6 Sessions actual trading between 7668-8091
Conclusions from 6 Sessions intra day chart analysis
As all the Global markets were crashing therefore firstly 164 Points gap(8061-8225) down opening and after that selling between 3 following ranges on 24-08-2015:-
1- 7897-7930
2- 7995-8010
3- 8032-8055
Trading patterns of last 5 sessions are as follows:-
1- First 4 sessions most time trading below the gaps
2- Trading within and below the gap on 28-08-2015
Although Nifty traded 4 hours above the top(8055) of above 3 selling ranges after strong gap up opening but closed within these ranges at 8001.95 on 28-08-2015 therefore it will be understood that these selling ranges have not cleared yet.
Certainly Global cues led huge volatility in all the last 5 sessions of previous week between 7668-8091 with lower levels supports and higher levels good selling therefore Nifty will firstly trade and prepare for next decisive moves within this range in the beginning of next week and finally sustaining it beyond will decide next trend. As crucial therefore following levels should also be watched:-
1- Higher levels selling between 7897-8091 in previous week and this range break out will give first strong indication of next trend.
2- 164 Points gap between 8061-8225 formed on 24-08-2015 but trading within this gap on 28-08-2015,finally sustaining beyond this gap will decide the life of on going correction
Intra Day Chart Analysis(31-08-2015)
Nifty-Intra Day Chart (28-Aug-2015):-
 |
| Just click on chart for its enlarged view |
Technical Patterns and Formations in today intraday charts
1- Up moves in Bearish Rising Channel
2- Selling patterns formation between 8066-8091(Immediate Resistances)
3- Down moves in Bullish Falling Channel
4- 5 Waves of Bullish Falling Wedge formations in last hours
5- Whole day actual trading between 7962-8091
Conclusions from intra day chart analysis
As all the Asian markets were trading with good gains after strong closing of US markets yesterday therefore gap up opening in Indian markets but emergence of following Bearish cues immediate after opening today:-
1- Indian markets under performed Asian markets despite more than 1% positive trading.
2- First hour up moves in Bearish Rising Channel
3- Selling patterns formation at higher levels
Although slipping after selling patterns formation till 01:00 PM and new intraday lowest formations as well but with Bullish patterns formations in following manner:-
1- Down moves in Bullish Falling Channel
2- Bullish Falling Wedge formations
As both consolidation and distribution patterns formations between 7962-8091 today therefore finally sustaining beyond this range will give next decisive first strong indication.
Conclusions (After Putting All Studies Together)
As all the Global markets badly crashed in the beginning of previous week therefore all the supports levels broken down and Long Term Trend turning down confirmation also through last 5 sessions closing below it decider 200 Day EMA(today at 8272). Now Pull Back rally is on with recent top formation at 8091.80 on 28-08-2015 and until it will not sustain above Long Term Trend decider 200 Day EMA till then corrective Wave-C completion will not be considered.
Extremely high volatility in all the Global markets in previous week therefore Indian markets were also equally volatile and closed near the higher levels of the week with Bullish Hammer weekly Candle formation therefore view will be cautious and valid break out of previous week trading range(7668-8091) must be firstly watched for the confirmation of next trend.
That rally which started on 28-08-2013 from 5118.85 completed at 9119.20 on 04-03-2015 and after that its 'ABC' correction started which is now in continuation. Fibonacci Retracement levels of rally between 5118.85-9119.20 are as follows:-
1- 13.0%- 8598(Retraced)
2- 23.6%- 8174(Retraced)
3- 27.0%- 8038(Retraced)
4- 38.2%- 7590(Crucial)
5- 50.0%- 7118(Crucial)
6- 61.8%- 6646(Crucial)
7- 70.0%- 6290
8- 76.4%- 6062
8- 78.6%- 5974
10-88.6%- 5574
Following next resistances of Wave-C are lying above last Friday closing:-
1- 8032-8055
2- 8061-8225(Gap Resistance)
3- 8239-8318
4- 8480-8526(Strong Multiple Resistances)
5- 8605-8656(Strong Multiple Resistances)
Wave-C of 'ABC' correction is in continuation with recent bottom formation at 7667.25 on 25-08-2015 towards its target at 7475.85 and no confirmation of its completion yet therefore posibility of correction continuation can not be rued out. As now Pull Back rally is on and Bullish Hammer weekly Candle formation in previous week therefore following levels should be firstly watched in next week for correction completion confirmations:-
1- Sustaining above previous week selling ranges(7897-8091) is firstly required for Wave-C correction completion first strong indication.
2- Sustaining above 164 Points gap formed on 24-08-2015(8061-8225) is must for Wave-C correction completion.
3- Sustaining above Long Term Trend decider 200 Day EMA(today at 8272) is also must for Wave-C correction completion.
As Global cues led huge volatility is last 6 sessions with mixed technical positions formations and crucial levels are lying within 7668-8272 therefore firstly sustaining it beyond should be watched in next week/weeks for next trend confirmations.