Crashing all Global markets require deeper correction confirmation from 8316/8226
Technical Analysis,Research & Weekly Outlook
(Aug 24 to Aug 28,2015)
Nifty-EOD Chart (21-Aug-2015):-
 |
| Just click on chart for its enlarged view |
Technical Patterns and Formations in EOD charts
1- 5118.85 on 28-08-2013(Wave-1 beginning after 'ABC' correction completion)
2- Wave-1(6415.25 on 09-12-2013)
3- Wave-2(5933.30 on 04-02-2014)
4- Wave-3(8626.95 on 04-12-2014)
5- Wave-4(7961.35 on 17-12-2014)
6- Wave-5(9119.20 on 04-03-2015 and 5 Waves correction beginning)
7- Wave-1(8269.15 on 27-03-2015)
8- Wave-2(8844.40 on 15-04-2015)
9- Wave-3(7997.15 on 07-05-2015)
10- Wave-4(8489.55 on 22-05-2015)
11- Wave-5(7940.30 on 12-06-2015 completion and impulsive Wave-i beginning after 5 Waves correction completion)
12- Wave-i(8654.75 on 23-07-2015)
13- Wave-ii continuation with recent bottom formation at 8225.05 on 21-08-2015
14- 37 Sessions sideways trading range between 8316-8654 broken down on 21-08-2015
Conclusions from EOD chart analysis
That Wave-1 which started on 28-08-2013 from 5118.85 completed at 9119.20 on 04-03-2015 and after that its 5 waves correction started. Wave-5 of correction completed at 7940.30 on 12-06-2015 and Wave-i started after 5 waves correction completion.Now corrective Wave-ii continuation with recent bottom formation at 8225.05 on 21-08-2015
37 sessions sideways trading was seen between 8316-8654 from 01-07-2015 to 20-08-2015 and this range was broken down on 21-08-2015 after Global markets crashing line situation. As only one day slipping below 8316 and previous week closing is also just below it at 8299.95 therefore technically no broken down confirmation but if Nifty will sustain 8316 in next week then on going waves structure will be recalculated and 'ABC' correction will be considered according to following waves patterns.
'ABC' Waves correction
Nifty-EOD Chart (21-Aug-2015):-
 |
| Just click on chart for its enlarged view |
Technical Patterns and Formations in EOD charts
1- 5118.85 on 28-08-2013(Wave-1 beginning after 'ABC' correction completion)
2- Wave-1(6415.25 on 09-12-2013)
3- Wave-2(5933.30 on 04-02-2014)
4- Wave-3(8626.95 on 04-12-2014)
5- Wave-4(7961.35 on 17-12-2014)
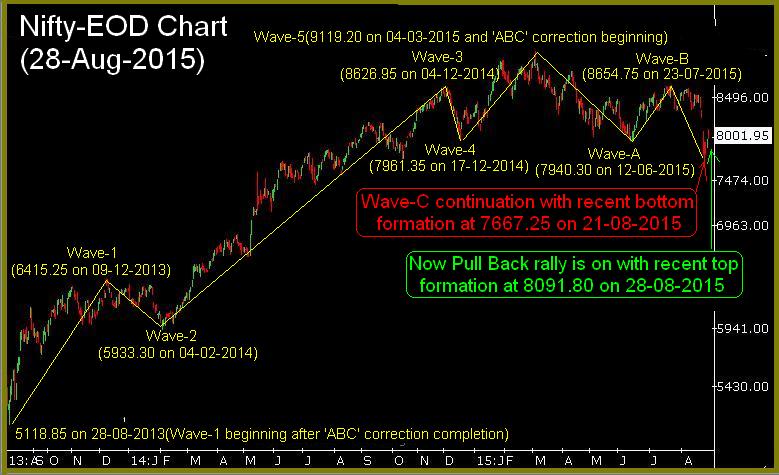
6- Wave-5(9119.20 on 04-03-2015 and 'ABC' correction beginning)
7- Wave-A(7940.30 on 12-06-2015)
8- Wave-B(8654.75 on 23-07-2015)
9- Wave-C continuation with recent bottom formation at 8225.05 on 21-08-2015
10- 37 Sessions sideways trading range between 8316-8654 broken down on 21-08-2015
11- Long Term Trend decider decider 200 Day EMA(today at 8292) broken down but closing above it at 8299.95 on 21-08-2015
Conclusions from EOD chart analysis
Finally sustaining below 8316 will mean 'ABC' corrective waves structure confirmation which will confirm Wave-C continuation for fresh down moves below Wave-A(7940.30).
Firstly sustaining below 8316 should be watched in next week and once sustaining below it will mean much deeper correction.
37 Sessions trading range broken down
Nifty-EOD Chart (21-Aug-2015):-
 |
| Just click on chart for its enlarged view |
Technical Patterns and Formations in EOD charts
1- 7940.30 on 12-06-2015(Fresh Wave-i beginning after 5 Waves correction completion)
2- Wave-i(8654.75 on 23-07-2015)
3- Correction continuation with recent bottom formation at 8225.05 on 21-08-2015
4- 37 Sessions sideways trading between 8316-8654 from 01-07-2015 to 20-08-2015
5- 37 Sessions trading range broken down and closing below it at 8299.95 on 21-08-2015
Conclusions from EOD chart analysis
37 Sessions sideways trading between 8316-8654 from 01-07-2015 to 20-08-2015 and this range was broken down on 21-08-2015 but closing below this range at 8299.95 yesterday. As sustaining below 37 Sessions lowest(8316) will mean much deeper correction therefore should be firstly watched in the coming sessions.
Bearish Head and Shoulders Pattern formations
Nifty-EOD Chart (21-Aug-2015):-
 |
| Just click on chart for its enlarged view |
Technical Patterns and Formations in EOD charts
1- 7940.30 on 12-06-2015(Fresh Wave-i beginning after 5 Waves correction completion)
2- Wave-i(8654.75 on 23-07-2015)
3- Correction continuation with recent bottom formation at 8225.05 on 21-08-2015
4- Bearish Head and Shoulders Pattern formations with its neckline at 8321.75
5- Neckline broken down and closing below it at 8299.95 on 21-08-2015
Conclusions from EOD chart analysis
37 Sessions sideways market with Bearish Head and Shoulders Pattern formations and its neckline at 8321.75 was broken down on 21-08-2015 but closing below this range at 8299.95 yesterday.
As valid break down of neckline(8321.75) will be deeper correction confirmation therefore should be firstly watched in next week for confirmations.
Symmetrical triangle continuation pattern formations
Nifty-EOD Chart (21-Aug-2015):-
 |
| Just click on chart for its enlarged view |
Technical Patterns and Formations in EOD charts
1- 7940.30 on 12-06-2015(Fresh Wave-i beginning after 5 Waves correction completion)
2- Wave-i(8654.75 on 23-07-2015)
3- Correction continuation with recent bottom formation at 8225.05 on 21-08-2015
4- Symmetrical triangle continuation pattern formations
5- Lower rising line of triangle broken down and closing below it at 8299.95 on 21-08-2015
Conclusions from EOD chart analysis
37 Sessions sideways market with Symmetrical triangle continuation pattern formations which is suggesting that on going Bullish trend will remain continued because it is a continuation pattern but confirmation is must through valid break out of its upward falling line.
As lower rising line of triangle broken down and closing below it at 8299.95 on 21-08-2015 therefore firstly sustaining beyond this line should be firstly watched because that will be valid break out which will be confirmation of pattern validity.
Micro Analysis of 38 Sessions Intra Day Chart
Nifty-Intra Day Chart (Jul 01 to Aug 21,2015):-
 |
| Just click on chart for its enlarged view |
Technical Patterns and Formations in last 38 Sessions intraday charts
1- 37 Sessions trading between 8316-8654
2- Selling at higher levels below 8654
3- Supports at lower levels above 8316
3- 37 Sessions trading range broken down on 21-08-2015
Conclusions from 38 Sessions intra day chart analysis
37 Sessions sideways trading between 8316-8654 from 01-07-2015 to 20-08-2015 with lower levels supports and higher levels selling but all the Global markets started to crash after the release of minutes from the FOMC Reserve's last policy meeting therefore Indian markets crashed in last 2 sessions and Nifty closed just below the lowest of last 37 sessions on 21-08-2015.
As sustaining below 37 Sessions lowest(8316) will mean much deeper correction therefore should be firstly watched in the coming sessions.
Intra Day Chart Analysis & Market Outlook(24-08-2015)
Nifty-Intra Day Chart (21-Aug-2015):-
 |
| Just click on chart for its enlarged view |
Technical Patterns and Formations in today intraday charts
1- Consolidation between 8226-8251(Immediate Supports)
2- Down moves in Bullish Falling Channel
3- Up moves in Bearish Rising Channel
4- Whole day actual trading between 8226-8322
Conclusions from intra day chart analysis
As crashing all Global markets therefore sharp down immediately after gap down opening but up moves lower levels were also seen after some lower levels consolidation. Although some down moves in Bullish Falling Channel in the Mid Session but up moves also in Bearish Rising Channel in last hours therefore follow up consolidation is firstly required for rally above today highest. Although crashing like situation in all the Global markets but some supports were also seen at lower levels therefore follow up selling is also required for decisive down moves below the lowest of the day(8226)
Conclusions (After Putting All Studies Together)
Trends of Nifty are as follows:-
1- Long Term Trend is up
2- Intermediate Term Trend is sideways
3- Short Term Trend is down
37 Sessions sideways trading between 8316-8654 from 01-07-2015 to 20-08-2015 with both following Bearish and Bullish patterns formations:-
1- Bearish Head and Shoulders Pattern formations
2- Symmetrical triangle continuation pattern formations
All the Global markets started to crash after the release of minutes from the FOMC Reserve's last policy meeting therefore Indian markets also tumbled in last 2 sessions as well as Nifty closed just below the lowest of last 37 sessions on 21-08-2015. As 37 sessions trading range broken down was the reaction of crashing Global markets therefore confirmation through sustaining below 37 sessions lowest(8316) is must for decisive deeper correction confirmations.
Dow Jones closed 531.14 down last Friday and if Asian markets also react this US markets crash next Monday then Indian markets may also open in deep Red. As some consolidation was seen above 8226 last Friday therefore firstly sustaining it below should be watched next Monday for much deeper correction which will be below 7940.30.
As crashing all Global markets therefore finally sustaining below 37 sessions lowest(8316) and Last Friday lowest(8226) will be confirmation of much deeper correction therefore should be firstly watched in next week.