ॐ ह्रीं श्रीं लक्ष्मीभयो नमः॥


Trading "calls" from our "Software" with more than "90% accuracy"

More than "12 years" old "only site of whole world" 
with more than "9700 accurate Outlooks" of 
"Indian Stock Markets" 
Pull Back rally expectations
Intra Day Chart Analysis & Market Outlook
(12-08-2015)
Nifty-Intra Day Chart (11-Aug-2015):-
Just click on chart for its enlarged view
Technical Patterns and Formations in today intraday charts

1- Whole day down moves in Bullish Falling Channel
2- Whole day actual trading between 8442-8530

Conclusions from intra day chart analysis 

Although most time negative zone trading and .74% down closing but whole day down moves in Bullish Falling Channel therefore Pull Back rally is expected tomorrow

Just watch GST Bill fate in Parliament

Post-open Outlook(11-08-2015)

As per Business News channels there is possibility of GST Bill Passing in current on going Mansoon parliament session therefore some volatility can not be ruled out according to its developments there but finally next trend will be decided according to fate of Bill in this session of Parliament.
Finally correction continuation after some intraday volatility and minor up moves up to 8578
Intra Day Chart Analysis & Market Outlook
(11-08-2015)
Nifty-Intra Day Chart (10-Aug-2015):-
Just click on chart for its enlarged view
Technical Patterns and Formations in today intraday charts

1- More than 5 hours selling between 8594-8621(Immediate Resistances)
2- Sudden sharp fall in last 30 minutes
3- Whole day actual trading between 8498-8621

Conclusions from intra day chart analysis 

Following lines were told on 08-08-2015 in "Short Term correction Possibility in Next Week":-

1- firstly Short Term correction beginning possibility
2- Nifty will trade between 8322-8600 amid Short Term correction in next week 

As was told 100% same happened and Nifty closed 39 points down after slipping 94 points in last 45 minutes today.

Firstly more than 5 hours selling between 8594-8621 which was within next previous resistance range(8600-8654) and after that  huge sharp fall therefore confirmation of Short Term correction beginning and more down moves are expected in the coming sessions because last 3 sessions trading range(8546-8606) also broken down forcefully after 3:00 PM today.

Dow Jones is now trading 239 points up and if such Bullishness will be seen in Asian markets also then strong opening may be seen in Indian markets also but good selling at higher levels in last 4 sessions between 8566-8621 and Nifty will not easily sustain above 8621. As last 4 sessions selling within and below previous resistance range(8600-8654) therefore this resistance range has become stronger and until complete consolidation will not happen till then Nifty will not move above 8654. 

Finally today started correction continuation is expected after some intraday volatility and minor up moves upto 8578.
Short Term correction Possibility in Next Week
Technical Analysis,Research & Weekly Outlook
(Aug 10 to Aug 14,2015)
Nifty-EOD Chart (07-Aug-2015):-
Just click on chart for its enlarged view
Technical Patterns and Formations in EOD charts

1- 5118.85 on 28-08-2013(Wave-1 beginning after 'ABC' correction completion)
2- Wave-1(6415.25 on 09-12-2013)
3- Wave-2(5933.30 on 04-02-2014)
4- Wave-3(8626.95 on 04-12-2014)
5- Wave-4(7961.35 on 17-12-2014)
6- Wave-5(9119.20 on 04-03-2015)(Correction beginning)
7- 7940.30 on 12-06-2015(Fresh Wave-i beginning after 5 Waves correction completion) 
8- Wave-i(8654.75 on 23-07-2015)
9- Wave-ii(8321.75 on 28-07-2015)
10- Wave-iii continuation with recent top formation at 8606.30 on 06-08-2015

Conclusions from EOD chart analysis 

That Wave-1 which started on 28-08-2013 from 5118.85 completed at 9119.20 on 04-03-2015 and after that its 5 waves correction started. Wave-5 of correction completed at 7940.30 on 12-06-2015 and Wave-i started after 5 waves correction completion. Now Wave-iii continuation with recent top formation at 8606.30 on 06-08-2015 after Wave-ii correction completion at 8321.75 on 28-07-2015.

Rally continuation after 5 waves correction completion

Nifty-EOD Chart (07-Aug-2015):-
Just click on chart for its enlarged view
Technical Patterns and Formations in EOD charts

1- Wave-5(9119.20 on 04-03-2015)(Correction beginning)
2- Wave-1(8269.15 on 27-03-2015)
3- Wave-2(8844.40 on 15-04-2015)
4- Wave-3(7997.15 on 07-05-2015)
5- Wave-4(8489.55 on 22-05-2015)
6- Wave-1(7940.30 on 12-06-2015)(Fresh Wave-i beginning after 5 Waves correction completion) 
7- Wave-i(8654.75 on 23-07-2015)
8- Wave-ii(8321.75 on 28-07-2015)
9- Wave-iii continuation with recent top formation at 8606.30 on 06-08-2015 

Conclusions from EOD chart analysis 

5 Waves correction begun after Wave-5 life time high formation at 9119.20 on 04-03-2015 which completed at 7940.30 on 12-06-2015 and fresh rally started which is in continuation after its 1st Short term correction completion 8321.75 on 28-07-2015. Now its Wave-iii continuation with recent top formation at 8606.30 on 06-08-2015

Signals of Bearish Head and Shoulders Pattern formations

Nifty-EOD Chart (07-Aug-2015):-
Just click on chart for its enlarged view
Technical Patterns and Formations in EOD charts

1- Wave-1(7940.30 on 12-06-2015)(Fresh Wave-i beginning after 5 Waves correction completion) 
2- Wave-i(8654.75 on 23-07-2015)
3- Wave-ii(8321.75 on 28-07-2015)
4- Wave-iii continuation with recent top formation at 8606.30 on 06-08-2015 
5- Signals of Bearish Head and Shoulders Pattern formations beginning 
6- Last 3 Sessions sideways market between 8546-8606

Conclusions from EOD chart analysis 

Rally continuation after correction completion with recent top formation at 8654.75 on 23-07-2015 and signals of Bearish Head and Shoulders Pattern formations beginning with its neckline near about 8321.75 therefore view will be cautious in next week. 

Last 3 sessions Sideways market

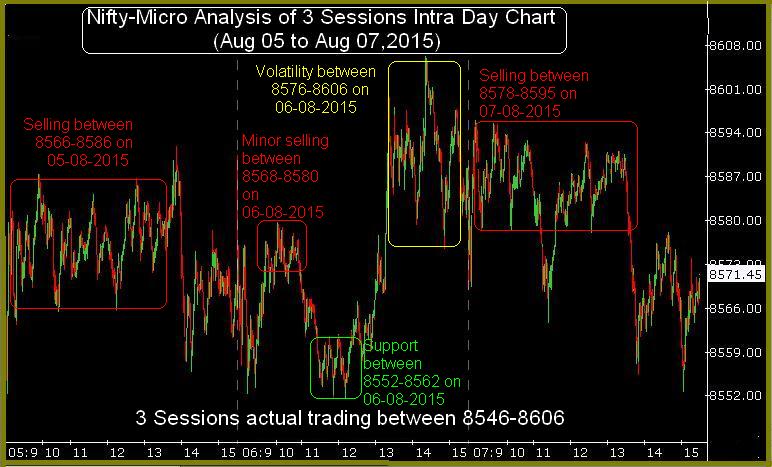
Nifty-Intra Day Chart (Aug 05 to Aug 07,2015):-
Just click on chart for its enlarged view
Technical Patterns and Formations in last 3 Sessions intraday charts

1- Selling between 8566-8586 on 05-08-2015
2- Minor selling between 8568-8580 on 06-08-2015
3- Support between 8552-8562 on 06-08-2015
4- Volatility in last 2 hours between 8576-8606 on 06-08-2015
5- Selling between 8578-8595 on 07-08-2015
6- 3 Sessions actual trading between 8546-8606 

Conclusions from 3 Sessions intra day chart analysis 

Last 3 Sessions trading between 8546-8606 with lower levels some supports but good selling patterns formations were also seen therefore some decisive down moves are expected in the beginning of down moves.

Intra Day Chart Analysis(10-08-2015)

Nifty-Intra Day Chart (07-Aug-2015):-
Just click on chart for its enlarged view
Technical Patterns and Formations in today intraday charts

1- Selling between 8578-8595(Immediate Resistances)
2- Whole day actual trading between 8553-8595

Conclusions from intra day chart analysis

As good selling between 8578-8595 therefore emergence of fresh decisive down moves expectations in the beginning of next week.

Conclusions (After Putting All Studies Together)

All trends are up and now rally continuation with recent top formation at 8654.75 on 23-07-2015 but following technical points are suggesting cautious view:-

1- Last 3 sessions sideways market between 8546-8606 with good selling within this range.
2- Last 3 sessions selling just below last resistance range(8600-8654) of on going rally
3- Last 3 sessions trading is showing lower top formation of on going rally on EOD charts.
4- Last 3 sessions trading is showing signals of Bearish Head and Shoulders Pattern formations beginning.

Technically last 3 sessions trading will be understood only sideways market between 8546-8606 but good selling was also seen within this range. Last resistances of on going rally are between 8600-8654 and selling was seen just below it therefore possibility of slipping below 8546 and Short Term correction beginning in the next week also.

As indications of Bearish Head and Shoulders Pattern formations beginning also therefore follow up moves with sustaining beyond its neckline near about 8321.75 should also be watched in the coming weeks.

As Short Term correction beginning possibility therefore supports of previous rally between 7940-8654 should be watched in next week:-:-

1- 8500-8510
2- 8425-8448
3- 8310-8384
4- 8196-8250
5- 8048-8077
6- 8000-8015
7- 7940-7980

Previous rally between 7940-8654 will correct accordingly to following retracement levels;-

1- 13.0%-8561
2- 23.6%-8485
3- 27.0%-8461
4- 38.2%-8381(Crucial)
5- 50.0%-8297(Crucial)
6- 61.8%-8212(Crucial)
7- 70.0%-8149
8- 76.4%-8108
8- 78.6%-8092
10-88.6%-8021

As crucial retracement levels(38.2%,50.0% and 61.8%) are lying between 8212-8381 and these levels are also lying within above mentioned 3rd and 4th supports ranges(8196-8384) therefore strong possibility of on going correction completion within this supports range.

Strong resistances are between 8600-8654 and equally good supports are also between 8322-8384 therefore Nifty will not easily cross 8322-8654 and will firstly trade and  prepare for next trend within this range in next week. As some selling in last 3 sessions and firstly Short Term correction beginning possibility therefore firstly sustaining beyond 8322 should be watched in next week.

Expected that Nifty will trade between 8322-8600 amid Short Term correction in next week and will prepare for next trend as well as finally sustaining beyond 8322-8654 will decide next big moves.
Next Resistances above 8600 require more consolidation for fresh rally
Intra Day Chart Analysis & Market Outlook
(07-08-2015)
Nifty-Intra Day Chart (06-Aug-2015):-
Just click on chart for its enlarged view
Technical Patterns and Formations in today intraday charts

1- Minor selling between 8568-8580
2- Support between 8552-8562
3- Volatility in last 2 hours between 8576-8606
4- Whole day actual trading between 8552-8606

Conclusions from intra day chart analysis 

Following lines were told on 02-08-2015 in "Rally Continuation after Fresh Consolidation and Minor Intraday Correction":-

11 Sessions actual trading between 8322-8654 with lower levels good consolidations and higher levels equally good selling also therefore Nifty will not easily crossed this range and will trade as well as prepare for next trend within this range in the next minimum 2/3 sessions.

Nifty traded within 11 Sessions range(8322-8654) between 8449-8606 in last 4 sessions and today also as such one sided positions formation was also not seen because in first 4 hours lower levels supports and higher levels selling was also seen. As only volatility developed in last more than 2 hours therefore final view can not be formed and valid break out of 8654 should be firstly watched for next up trend confirmations.

Next strong resistances are lying between 8600-9642 and this range will decide the fate of on going rally. As lower levels supports and last 2 hours volatility at higher levels of the day between 8576-8606 was also seen today therefore hopes of fresh rally above 9642/8654 are alive but more consolidation is must in the coming sessions.

"Rally Continuation after Fresh Consolidation and Minor Intraday Correction" named weekly analysis topic was posted on 02-08-2015 and rally was seen after minor correction in last 4 sessions as well as expected that rally will remain continued after follow up consolidation and crossing next resistances(8600-9642) 
As busy therefore unable to update today Outlook.
Sorry for inconvenience
Firstly watch valid break out of 8448-8563
Intra Day Chart Analysis & Market Outlook
(05-08-2015)
Nifty-Intra Day Chart (04-Aug-2015):-
Just click on chart for its enlarged view
Technical Patterns and Formations in today intraday charts

1- Whole day only high Volatility
2- Whole day actual trading between 8448-8565

Conclusions from intra day chart analysis 

Following lines were told at on 03-08-2015 in "Very Short Term correction Possibility amid Intraday High Volatility":-

1- Certainly emergence of Very Short Term correction possibility
2- some up moves within and above today actual trading range(8528-8563) 
3- amid intraday high volatility tomorrow.

As was told 100% same happened in following manner today:-

1- Very Short Term correction was seen and Nifty traded 95 points down as well as closed 26 points negative today.
2- Some up moves within and above yesterday trading range(8528-8563) with today highest formation at 8565.15 
3- High intraday volatility is clear from above intraday chart of today.

As whole day only high Volatility and as such no positions formations therefore no conclusions can be drawn from today intraday charts because technical positions reverses and changes fast during such high volatility.

Following lines wee told on 02-08-2015 in "Rally Continuation after Fresh Consolidation and Minor Intraday Correction" and being repeated today for future guidance:-

11 Sessions actual trading between 8322-8654 with lower levels good consolidations and higher levels equally good selling also therefore Nifty will not easily crossed this range and will trade as well as prepare for next trend within this range in the next minimum 2/3 sessions.

As selling below 8563 yesterday and strong recovery from 8448 today therefore Nifty will firstly trade and prepare for next decisive moves between 8448-8563 tomorrow and valid break out of this range should be firstly watched in the coming sessions.
Very Short Term correction Possibility amid Intraday High Volatility
Intra Day Chart Analysis & Market Outlook
(04-08-2015)
Nifty-Intra Day Chart (03-Aug-2015):-
Just click on chart for its enlarged view
Technical Patterns and Formations in today intraday charts

1- Selling between 8547-8563
2- Down moves in Bullish Falling Channel in last hour
3- Whole day actual trading between 8528-8563

Conclusions from intra day chart analysis 

Following line was told at on 02-08-2015 in "Rally Continuation after Fresh Consolidation and Minor Intraday Correction":-

Selling(resistances) between 8546-8654

As follow up selling within above mentioned previous resistance range between 8547-8563 today therefore higher level resistances have been strengthened.

RBI Credit Policy tomorrow and Bank Nifty traded as well as closed with good gains today but Nifty closed flat which is showing conflicting signals therefore uncertainty in main Indices and volatility will remain high tomorrow for stop loss triggering and one side trading positions setting.

Certainly emergence of Very Short Term correction possibility after higher levels selling today but down moves in Bullish Falling Channel were also seen in last hour therefore some up moves within and above today actual trading range(8528-8563) may also be seen amid intraday high volatility tomorrow. 
Rally Continuation after Fresh Consolidation and Minor Intraday Correction
Technical Analysis,Research & Weekly Outlook
(Aug 03 to Aug 07,2015)
Nifty-EOD Chart (31-Jul-2015):-
Just click on chart for its enlarged view
Technical Patterns and Formations in EOD charts

1- 5118.85 on 28-08-2013(Wave-1 beginning after 'ABC' correction completion)
2- Wave-1(6415.25 on 09-12-2013)
3- Wave-2(5933.30 on 04-02-2014)
4- Wave-3(8626.95 on 04-12-2014)
5- Wave-4(7961.35 on 17-12-2014)
6- Wave-5(9119.20 on 04-03-2015)(Correction beginning)
7- 7940.30 on 12-06-2015(Fresh Wave-i beginning after 5 Waves correction completion) 
8- Wave-i(8654.75 on 23-07-2015)
9- Wave-ii(8321.75 on 28-07-2015)
10- Wave-iii continuation with recent top formation at 8548.95 on 31-07-2015)

Conclusions from EOD chart analysis 

That Wave-1 which started on 28-08-2013 from 5118.85 completed at 9119.20 on 04-03-2015 and after that its 5 waves correction started. Wave-5 of correction completed at 7940.30 on 12-06-2015 and Wave-i started after 5 waves correction completion. Now Wave-iii continuation with recent top formation at 8548.95 on 31-07-2015 after Wave-ii correction completion at 8321.75 on 28-07-2015.

Rally continuation after 5 waves correction completion

Nifty-EOD Chart (31-Jul-2015):-
Just click on chart for its enlarged view
Technical Patterns and Formations in EOD charts

1- Wave-5(9119.20 on 04-03-2015)(Correction beginning)
2- Wave-1(8269.15 on 27-03-2015)
3- Wave-2(8844.40 on 15-04-2015)
4- Wave-3(7997.15 on 07-05-2015)
5- Wave-4(8489.55 on 22-05-2015)
6- Wave-1(7940.30 on 12-06-2015)(Fresh Wave-i beginning after 5 Waves correction completion) 
7- Wave-i(8654.75 on 23-07-2015)
8- Wave-ii(8321.75 on 28-07-2015)
9- Wave-iii continuation with recent top formation at 8548.95 on 31-07-2015 

Conclusions from EOD chart analysis 

5 Waves correction begun after Wave-5 life time high formation at 9119.20 on 04-03-2015 which completed at 7940.30 on 12-06-2015 and fresh rally started which is in continuation after its 1st Short term correction completion 8321.75 on 28-07-2015. Now its Wave-iii continuation with recent top formation at 8548.95 on 31-07-2015)

Last 11 sessions Sideways market

Nifty-Intra Day Chart (Jul 16 to Jul 31,2015):-
Just click on chart for its enlarged view
Technical Patterns and Formations in last 11 Sessions intraday charts

1- Selling(resistances) between 8546-8654
2- Consolidation between 8322-8384
3- 11 Sessions actual trading between 8322-8654 

Conclusions from 11 Sessions intra day chart analysis 

Short Term correction begun after 7 sessions selling between 8546-8654 but lower levels good consolidation within previous supports range 8322-8384 in last 4 sessions and fresh rally beginning. Strong rally was seen last Friday and next resistance between 8546-8654 was tested but closing below it at 8532.85.

11 Sessions actual trading between 8322-8654 with lower levels good consolidations and higher levels equally good selling also therefore Nifty will not easily crossed this range and will trade as well as prepare for next trend within this range in the next minimum 2/3 sessions.

Conclusions (After Putting All Studies Together)

Following supports,retracement levels and conclusions were updated in previous weekly analysis topic of "Firstly Watch 8196-8384 for correction continuation / completion";- 

Supports of previous rally between 7940-8654 are as follows:-

1- 8500-8510
2- 8425-8448
3- 8310-8384
4- 8196-8250
5- 8048-8077
6- 8000-8015
7- 7940-7980

Rally between 7940-8654 will correct accordingly to following retracement levels;-

1- 13.0%-8561
2- 23.6%-8485
3- 27.0%-8461
4- 38.2%-8381(Crucial)
5- 50.0%-8297(Crucial)
6- 61.8%-8212(Crucial)
7- 70.0%-8149
8- 76.4%-8108
8- 78.6%-8092 
10-88.6%-8021 

As crucial retracement levels(38.2%,50.0% and 61.8%) are lying between 8212-8381 and these levels are also lying within above mentioned 3rd and 4th supports ranges(8196-8384) therefore strong possibility of on going correction completion within this supports range.

Strong possibility of on going correction completion within 8196-8384 was told and Nifty got supports within this range at 8321.75 and fresh Wave-iii begun and remain continued till last Friday after 227 points rally in last 4 sessions.

Now rally continuation but strong resistances are lying just above last Friday highest between 8546-8654 and equally good supports are also between 8322-8384 therefore Nifty will not easily cross 8322-8654 and will trade within this range in next week as well as prepare for next trend,valid break out of 8322-8654 will decide next trend

All trends are up and last 3 sessions rally continuation after lower levels good consolidation as well as as such selling patterns were not seen yet therefore rally continuation is expected but fresh consolidation is must and minor intraday correction can not be ruled out in the beginning of next week because very Short Term Indicators are over bought and strong resistances are also lying above previous week highest
Just Watch valid break out of 8310-8458 for next Trend
Intra Day Chart Analysis & Market Outlook
(31-07-2015)
Nifty-Intra Day Chart (30-Jul-2015):-
Just click on chart for its enlarged view
Technical Patterns and Formations in today intraday charts

1- Up moves in Bearish Rising Channel
2- Selling between 8441-8458(Immediate Resistances)
3- Intraday volatility in last 2 hours between 8409-8438
4- Whole day actual trading between 8409-8458

Conclusions from intra day chart analysis 

Following lines were told on 28-07-2015 in "First Signal of on going Correction Completion":-

1- Whole day 75 points sideways trading with negative zone closing near the lower levels of the day 
2-as such selling patterns were not seen but on the contrary consolidation patterns were seen 
3- Pull back rally possibility can not be ruled out in the next 1/2 sessions after follow up consolidations

Following lines were told on 29-07-2015 in "Pull Back rally continuation after follow up consolidation":-

1- Nifty traded whole day within mentioned supports range(8310-8384) today with follow up intraday consolidation patterns formations after yesterday consolidation within this range therefore mentioned supports range has become more stronger
2- As last 2 sessions good consolidations within previous supports range(8310-8384) therefore strong signals of that correction completion which started on 23-07-2015 from 8654.75. 
3- Pull Back rally will remain continued

When Nifty closed near the lower levels of the day on 28-07-2015 then Pull back rally possibility was told in the next 1/2 sessions and following closing was seen in next 2 sessions:-

1- Nifty closed 38 points up on 29-07-2015  
2- Nifty closed 47 points up on 30-07-2015  

As firstly up moves in Bearish Rising Channel and after that higher levels selling 8441-8458 today therefore this range will be understood immediate Resistances of Nifty and firstly consolidation is required for next decisive up moves above today highest(8458.80).

Certainly good consolidation within previous supports range(8310-8384) in last 2 sessions and this range has become strong supports and until more selling will not develop after today selling till then Nifty will not slip below 8310. In the same manner until more consolidation will not be seen till then Nifty will not sustain above 8458 also therefore Nifty will be understood sideways between 8310-8458 and will firstly prepare for next decisive moves within this range.

As valid break out of 8310-8458 will decide next trend after follow up moves between this range therefore should be firstly watched in the coming sessions and next trend will be decided according to intraday patterns formations within this range.