Finally Rally towards and above 8882/9119.20 after 6 Bullish confirmation
Technical Analysis,Research & Weekly Outlook
(Jul 20 to Jul 24,2015)
Nifty-EOD Chart (17-Jul-2015):- |
| Just click on chart for its enlarged view |
1- 5118.85 on 28-08-2013(Wave-1 beginning after 'ABC' correction completion)
2- Wave-1(6415.25 on 09-12-2013)
3- Wave-2(5933.30 on 04-02-2014)
4- Wave-3(8626.95 on 04-12-2014)
5- Wave-4(7961.35 on 17-12-2014)
6- Wave-5(9119.20 on 04-03-2015)(Correction beginning)
7- Wave-1(8269.15 on 27-03-2015)
8- Wave-2(8844.40 on 15-04-2015)
9- Wave-3(7997.15 on 07-05-2015)
10- Wave-4(8489.55 on 22-05-2015)
11- Wave-5(7940.30 on 12-06-2015)
12- Rally with recent top formation at 8642.95 on 17-07-2015
Conclusions from EOD chart analysis
That Wave-1 which started on 28-08-2013 from 5118.85 completed at 9119.20 on 04-03-2015 and after that its 5 waves correction started. Wave-5 of correction completed at 7940.30 on 12-06-2015 and now Rally continuation after 5 waves correction completion with recent top formation at 8,642.95 on 17-07-2015.
Rally after correction completion
Nifty-EOD Chart (17-Jul-2015):-
 |
| Just click on chart for its enlarged view |
1- Wave-5 completion at 9119.20 on 04-03-2015 and 5 Waves correction beginning
2- Wave-1(8269.15 on 27-03-2015)
3- Wave-2(8844.40 on 15-04-2015)
4- Wave-3(7997.15 on 07-05-2015)
5- Wave-4(8489.55 on 22-05-2015)
6- Rally beginning after Wave-5 correction completion at 7940.30 on 12-06-2015
7- Rally continuation with recent top formation at 8642.95 on 17-07-2015
Conclusions from EOD chart analysis
Rally continuation with recent top formation at 8642.95 on 17-07-2015 and no signal of correction beginning on EOD charts except Doji Candle formation on 17-07-2015.
Correction completion near the lowest of Wave-4
Nifty-EOD Chart (17-Jul-2015):-
 |
| Just click on chart for its enlarged view |
1- 7961.35 on 17-12-2014(Wave-5 beginning after Wave-4 completion)
2- 5th Wave of rally completion at 9119.20 on 04-03-2015 and correction beginning
3- Correction completion at 7940.30 on 12-06-2015 and fresh Rally beginning
4- Correction completion near Wave 4 low
Conclusions from EOD chart analysis
As per following Elliott Wave theory Guideline;-
"After a 5-wave impulse advance, corrections usually end in the area of prior Wave-4 lowest"
As Nifty completed correction(7940.30) near the lowest of Wave-4(7961.35) therefore high possibility of that 4000 points rally correction completion which started from 5118.85 on 28-08-2013 completed at 9119.20 on 04-03-2015 as well as fresh Wave like previous 4000 points beginning from 7940.30 on 12-06-2015
Inverse Head and Shoulders Neckline Broken out confirmation
Nifty-EOD Chart (17-Jul-2015):-
 |
| Just click on chart for its enlarged view |
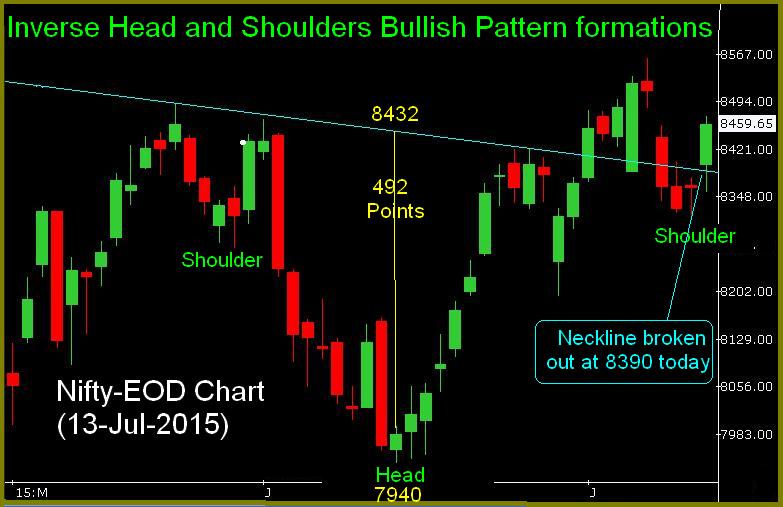
1- Inverse Head and Shoulders Bullish Pattern formations
2- Neckline broken out at 8390 on 13-07-2015
Conclusions from EOD chart analysis
Bullish Inverse Head and Shoulders Pattern formations and Neckline at 8390 was broken out on 13-07-2015. As last 5 sessions closing above Neckline therefore its broken out confirmation which means as per following calculation immediate target of Nifty is at 8882:-
Head was formed at 7940
Neckline just above head is at 8432
8432-7940= 492 points between Head and Neckline
Neckline was broken out at 8390
Inverse Head and Shoulders Pattern broken out target will be at 8390+492=8882
Whole correction in Bullish Flag Pattern formation
Nifty-EOD Chart (17-Jul-2015):-
 |
| Just click on chart for its enlarged view |
1- Wave-5 completion at 9119.20 on 04-03-2015 and Correction beginning
2- Corrective Wave-5 completion at 7940.30 on 12-06-2015 and Rally beginning
3- Whole correction in Bullish Flag Pattern formation and its broken out confirmation
4- Falling Trend Line of correction broken out confirmation.
5- Intermediate Term Trend turning up confirmations after last 3 sessions closing above 8505
6- Long Term Trend turning up confirmations after last 21 sessions closing above its decider 200 Day EMA(today at 8239).
Conclusions from EOD chart analysis
Intermediate Term Trend was down for the last 59 sessions and its turning up confirmations after last 3 sessions closing above 8505 in previous week as well as Long Term Trend was already up and now last 21 sessions closing above its decider 200 Day EMA(today at 8239) therefore now all trends turning up confirmations.
As whole correction was in Bullish Flag Pattern formation and its broken out confirmations through last 20 sessions closing above upwards falling line therefore strong signals of fresh rally after that correction completion at 7940.30 on 12-06-2015 which started from at 9119.20 on 04-03-2015.
Intra Day Chart Analysis(20-07-2015)
Nifty-Intra Day Chart (17-Jul-2015):-
 |
| Just click on chart for its enlarged view |
1- Down moves in Bullish Falling Channel
2- Support between 8594-8604(Immediate Supports)
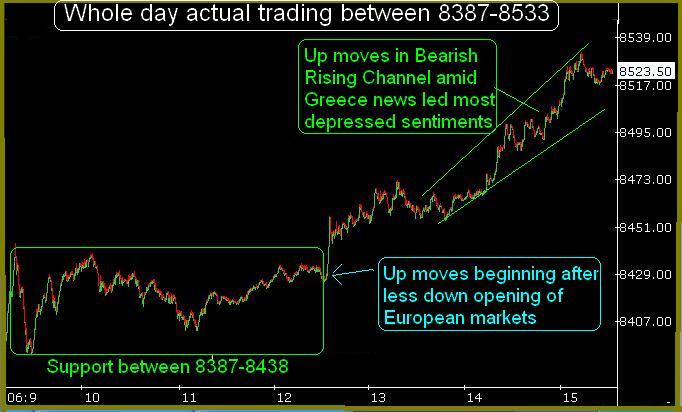
3- Up moves in Bearish Rising Channel
4- Selling between 8520-8635(Immediate Resistances)
5- Whole day actual trading between 8594-8642
Conclusions from intra day chart analysis
As Doji candle formations with intraday selling patterns formations therefore signals of some down moves and possibility of day's lowest can not be ruled out in the beginning of next week but some consolidations and lower levels supports were also seen therefore sustaining below days's lowest after follow up selling is must for next decisive down moves.
Conclusions (After Putting All Studies Together)
Following Bullish confirmations on EOD Charts in previous week:-
1- Intermediate Term Trend turning up confirmations after last 3 sessions closing above 8505
2- Long Term Trend turning up confirmations after last 21 sessions closing above its decider 200 Day EMA(today at 8239).
3- Bullish Flag Pattern broken out confirmation through last 20 sessions closing above it.
4- Falling Trend Line of correction broken out confirmation through last 20 sessions closing above it.
5- Inverse Head and Shoulders broken out confirmation through last 5 sessions closing above its Necckline.
6- 5 waves correction completion near confirmation the lowest of Wave-4
As above 6 Bullish developments on EOD Charts therefore technically that now Bullish market continuation will also be considered in which:-
1- All trends have turned up
2- That 4000 points rally correction has been completed at 7940.30 on 12-06-2015 which started from 5118.85 on 28-08-2013 completed at 9119.20 on 04-03-2015.
As strong signals of previous 4000 points rally completion therefore fresh Wave like previous 4000 points Waves emergence possibility will also be considered now.
As strong rally in previous weeks and Short Term Indicators have turned overbought as well as some selling patterns were also seen on last Friday intraday charts therefore very Short Term correction possibility can not be ruled out in the beginning of next week. Parliament session will begin from next Monday and that may be stormy also, negative news flow from there may remain continued as well as many Quarterly results will also be declared in next week therefore volatility may remain high in next week.
Although sentiment may remain disturbed in next week but technically Indian markets are well poised for rally continuation after minor correction and volatility despite whatsoever happen in Parliament and performance remains in Quarterly results.
As above mentioned 6 Bullish confirmation therefore as per our view worst is over in Indian Stock Markets and finally strong rally will be seen towards and above 8882/9119.20 in the coming weeks/months.