ॐ ह्रीं श्रीं लक्ष्मीभयो नमः॥


Trading "calls" from our "Software" with more than "90% accuracy"

More than "12 years" old "only site of whole world" 
with more than "9700 accurate Outlooks" of 
"Indian Stock Markets" 
Rally continuation amid Greece news led high volatility
Intra Day Chart Analysis & Market Outlook
(07-07-2015)

Nifty-Intra Day Chart (06-Jul-2015):-
Just click on chart for its enlarged view
Technical Patterns and Formations in today intraday charts

1- Support between 8387-8438(Immediate Supports)
2- Up moves beginning after less down opening of European markets
3- Up moves amid Greece news led depressed most sentiments. 
4- Whole day actual trading between 8387-8533

Conclusions from intra day chart analysis 

As 'No' victory with big margin in Greece referendum therefore emergence of uncertainty and following negative trading of global markets was seen today:-

1- Most Asian markets were trading more than 1.5% down
2- European markets Futures were more than 3% negative.
3- Dow's Futures Red trading by more than 200 points.

As most dampened sentiments therefore huge gap down opening and more than 3 hours sideways trading between 8387-8438 which finally proved lower levels supports today. European markets Futures were more than 3% down today morning but markets opened .50% to 1.5% down at 12:30 PM which generated the rays of hopes in the mind of Bulls and up moves started which remain continued til the end of trading.

As lower levels supports amid most depressed sentiments and up moves continuation despite all around Global markets weakness and negative news flow as well therefore it is clear that Indian markets have shown strength today.

54 Sessions trading between 7941-8505 and today closing above it after recovery of 146 points amid most Bearish sentiments therefore emergence of strong signal for fresh up moves beginning after confirmation of sustaining above 8505.

Following lines were told yesterday in Blasting Rally towards and above Life Time High(9119.20):-

1- If 'No' comes from Greece referendum today Mid Night then a down can not be ruled out next Monday but Nifty will not sustain at lower levels 
2- emergence of strong indication of correction completion confirmations last Friday
3- emergence of correction completion strong signal at the bottom of correction at 7940.30 on 12-06-2015
4- once valid break out of 8505 will mean strong blasting rally.
5- once valid break out of 8490 will mean strong blasting rally.
6- strong Blasting rally will be seen in the coming week after all trend turning up

As Nifty could not sustain at lower levels today despite all around weakness and closed above 8505 therefore expected that rally will remain continued after follow up consolidations at higher levels but Greece issues have not resolved yet and its uncertainty led volatility may remain high.
Blasting Rally towards and above Life Time High(9119.20)
Technical Analysis,Research & Weekly Outlook
(Jul 06 to Jul 10,2015)

Waves structure of on going 5 Waves correction
Nifty-EOD Chart (03-Jul-2015):-
Just click on chart for its enlarged view
Technical Patterns and Formations in EOD charts

1- Wave-5 completion at 9119.20 on 04-03-2015 and 5 Waves correction beginning
2- Wave-1(8269.15 on 27-03-2015)
3- Wave-2(8844.40 on 15-04-2015)
4- Wave-3(7997.15 on 07-05-2015)
5- Wave-4(8489.55 on 22-05-2015)
6- Wave-5(7940.30 on 12-06-2015)
7- Falling Trend line of correction broken out
8- Pull Back Rally continuation with recent top formation at 8497.75 on 03-07-2015 

Conclusions from EOD chart analysis 

5 Waves of correction completed at 7940.30 on 12-06-2015 and Pull Back Rally continuation with full retracement of Wave-4(8489.55) after recent top formation at 8497.75 on 03-07-2015 but closing just below at 8484.90. It means that emergence of strong indication of correction completion confirmations last Friday.

Whole correction in Bullish Flag Pattern formation 
Nifty-EOD Chart (03-Jul-2015):-
Just click on chart for its enlarged view
Technical Patterns and Formations in EOD charts

1- Wave-5 completion at 9119.20 on 04-03-2015 and Correction beginning
2- Corrective Wave-5 completion at 7940.30 on 12-06-2015 and Pull Back Rally beginning
3- Whole correction in Bullish Flag Pattern formation 
4- Last 11 sessions closing above Long Term Trend decider 200 Day EMA(today at 8214).

Conclusions from EOD chart analysis 

As whole correction in Bullish Flag Pattern formation and last 11 sessions closing above Long Term Trend decider 200 Day EMA(today at 8214)therefore Long Term Trend turning up confirmation and emergence of correction completion strong signal at the bottom of correction at 7940.30 on 12-06-2015.

54 Sessions trading between 7941-8505
Nifty-EOD Chart (03-Jul-2015):-
Just click on chart for its enlarged view
Technical Patterns and Formations in EOD charts

1- 54 Sessions trading between 7941-8505

Conclusions from EOD chart analysis 

54 Sessions trading between 7941-8505 and last Friday closing just below the top of this range at 8484.90,once valid break out of 8505 will mean strong blasting rally.

Inverted Head and Shoulders Pattern formations
Nifty-EOD Chart (03-Jul-2015):-
Just click on chart for its enlarged view
Technical Patterns and Formations in EOD charts

1- Inverted Head and Shoulders Bullish Pattern formations in last 31 sessions

Conclusions from EOD chart analysis 

Bullish Inverted Head and Shoulders Pattern formations in last 31 sessions with its Neckline at 8490 and last Friday closing just below it at 8484.90, once valid break out of 8490 will mean strong blasting rally.

Conclusions (After Putting All Studies Together)

All Trends are as follows:-

1- Short Term Trend is up
2- Intermediate Term Trend is sideways which will be up above 8505.
3- Long Term Trend turned up after last 11 sessions closing above its decider 200 Day EMA(today at 8214).

As following patterns formations therefore strong blasting rally is expected:-

1- Whole correction from 9119.20 to 7940.30 is in Bullish Flag Pattern formation 
2- Falling Trend line of correction broken out
3- Inverted Head and Shoulders Bullish Pattern formations in last 31 sessions
4- Long Term Trend turning up confirmations after last 11 sessions closing above its decider 200 Day EMA(today at 8214).

As above 4 Bullish developments therefore expected that finally 54 Sessions trading range (7941-8505) will be broken out above 8505 and strong Blasting rally will be seen in the coming week after all trend turning up.

If 'No' comes from Greece referendum today Mid Night then a down can not be ruled out next Monday but Nifty will not sustain at lower levels and finally rally will develop towards and above life time high(9119.20) after whole rally(5118.85-9119.20) correction completion at 7940.30 on 12-06-2015
Some Down moves after Higher Levels Selling
Intra Day Chart Analysis & Market Outlook
(03-07-2015)
Nifty-Intra Day Chart (02-Jul-2015):-
Just click on chart for its enlarged view
Technical Patterns and Formations in today intraday charts

1- Selling Patterns between 8461-8479(Immediate Resistances) 
2- Whole day actual trading between 8434-8479

Conclusions from intra day chart analysis 

Whole day sideways trading within 45 points with higher levels selling Patterns formations therefore expected that Nifty will slip below today lowest(8433.20). If follow up selling develop tomorrow then deeper correction will be considered because today selling was seen within previous resistance range(8440-8486).
Confirm Next moves from Levels amid Greek Drama Volatility 
Intra Day Chart Analysis & Market Outlook
(02-07-2015)
Nifty-Intra Day Chart (01-Jul-2015):-
Just click on chart for its enlarged view
Technical Patterns and Formations in today intraday charts

1- Up moves in Bearish Rising Channel
2- Sufficient intraday corrections
3- Whole day actual trading between 8371-8481

Conclusions from intra day chart analysis 

As positive news flow from Greece therefore whole day up moves but in Bearish Rising Channels and sufficient intraday corrections for consolidation were also seen therefore sinals of rally continuation. Last 8 sessions trading between 8196-8423 and Nifty traded more than 3 hours as well as closed above it but follow up consolidation is still required because slipping in last hour from higher levels within next strong resistance range(8440-8486).

As last 3 sessions trading was under the shadow of Greek Drama with high volatility and today up moves were also on the back of following positive news from Greece. 


Greece Govt is taking U-Turn also from their today morning proposals and hours after telling Europe he could accept most of the conditions of a bailout he previously rejected, Prime Minister Alexis Tsipras urged Greeks to vote against it. Just click follow topic link for today evening statement on Greece Prime Minister


News based and not technical based volatile market in this week and such uncertainty may be seen in next 2 sessions also because picture will be clear after referendum in Greece on 5th July therefore finally sustaining beyond 8414-8486 should be firstly watched for next immediate moves confirmations:-

1- Above 8486 will mean clearing of last resistance and strong rally after all trends turning up confirmations at 8505.
2- Below 8414 will mean fresh down moves after facing resistance between 8440-8486.

As we are still expecting up moves therefore repeating following conclusions also for next trend confirmations which were updated in previous week:-

Following conclusive lines were told on 25-06-2015 in "Fresh Rally Expectations from Next Week":-

As per our view Indian markets are well prepared for fresh rally and only negative news from Greece may create a hurdle but even though we are expecting that finally as such negative news will not come from Greece and fresh rally will be seen above 8486/8505 in next week.

Following conclusive lines were told on 26-06-2015 in "Rally continuation towards Life Time High after Bullish Pattern formations":-

As Whole correction in Bullish Flag Pattern formation , Falling Trend line of correction also broken out in previous week and last 2 sessions good intraday  consolidations therefore expected that on going rally will remain continued above 8505 in the coming week but after fresh follow up consolidations because strong resistances are lying between 8440-8486 
Just Watch 8 Sessions Range for Next Big Trend Confirmations
Intra Day Chart Analysis & Market Outlook
(01-07-2015)
Nifty-Intra Day Chart (30-Jun-2015):-
Just click on chart for its enlarged view
Technical Patterns and Formations in today intraday charts

1- More than 4 hours trading with mixed Patterns between 8308-8348 
2- Whole day actual trading between 8308-8378

Conclusions from intra day chart analysis 

Although closing near the higher levels of the day after good recovery from lower levels but as such good consolidation was not seen and on the contrary first 4 hours trading with mixed Patterns between 8308-8348 therefore final view can not be formed from today intraday charts analysis. As last hours up moves were after following developments also therefore clear consolidation is firstly required tomorrow for sustaining above today highest:-

1- Dow Futures suddenly moves up 100 points and sentiment boosted.
2- News on Business channels signalling some positive developments regarding Greece Crisis.

As today trading psychology was Greece news affected therefore technical positions understanding becomes tough and follow up moves will be firstly watched tomorrow then final view will be formed. Finally sustaining beyond last 8 sessions range(8196-8423) will decide next big trend and should be watched for final confirmations.
Just Watch Crucial levels for Next Big Trend amid Greek Drama
Intra Day Chart Analysis & Market Outlook
(30-06-2015)
Nifty-Intra Day Chart (29-Jun-2015):-
Just click on chart for its enlarged view
Technical Patterns and Formations in today intraday charts

1- Support between 8196-8261(Immediate Supports)
2- Consolidation Patterns between 8303-8329
3- Whole day actual trading between 8195-8329

Conclusions from intra day chart analysis 

Following lines were told today at 06:40 AM in "Greece debt crisis & Asian markets crashed ":-

Next supports are lying between 8196-8251 and sustaining it beyond will decide the impact of Greece Crisis on Indian markets and next trend as well.

Supports were told above 8196 and today lowest formations at 8195.65 as well as follow up supports between 8196-8261 today therefore today this supports range has developed as strong supports. Last 5 sessions trading between 8196-8423 with both consolidation and selling patterns formations within this range as well as next resistances between 8440-8486 are also lying just above 8423 therefore more consolidation will be firstly required for fresh rally 8486 and next big trend will be decided through sustaining beyond 8196-8486.

As Greece debt crisis led high uncertainty and all the global markets trembled today as well as settling down is firstly required therefore view is cautious and follow up moves will be firstly watched in the coming sessions and if follow up consolidation develops then rally above 8423/8486 will be considered.

As consolidation Patterns formations also between 8303-8329 in last hour today therefore sustaining beyond this range should be firstly watched tomorrow for next trend first indication. As support between 8196-8261 has developed strong therefore until complete selling will not develop till then Nifty will not slip below 8196 and it should be kept in mind that once sustaining below 8196 will mean deeper correction. If finally Nifty survives above 8196 amid such high Global crashing markets then strong rally is confirm above 8423/8486/8505 after all trend turning up confirmations.

As Greece is showing rigid attitude and situation is worsening therefore view is cautious and follow up moves with sustaining beyond following crucial levels will decide next big trend and should be firstly watched tomorrow:-

1- 8303-8329(first indication)
2- 8196-8423 (confirmation)
Greece debt crisis & Asian markets crashed 
Pre-open Outlook(29-06-2015)

As no positive decision regarding Greece in last 2 days and following negative developments therefore all the Asian markets have crashed:-

1- Greece debt crisis: Eurozone refuses bailout extension
2- Greek debt crisis: Banks to stay shut, capital controls imposed
3- Parliament approves referendum as Greece's future hangs in the balance

Dow's Futures is also trading 250 points down and sentiment is completely depressed today morning therefore gap down opening will be seen in Indian markets also. Next supports are lying between 8196-8251 and sustaining it beyond will decide the impact of Greece Crisis on Indian markets and next trend as well.
Rally continuation towards Life Time High after Bullish Pattern formations
Technical Analysis,Research & Weekly Outlook
(Jun 29 to Jul 03,2015)
Nifty-EOD Chart (26-Jun-2015):-
Just click on chart for its enlarged view
Technical Patterns and Formations in EOD charts

1- 5118.85 on 28-08-2013(Wave-1 beginning after 'ABC' correction completion)
2- Wave-1(6415.25 on 09-12-2013)
3- Wave-2(5933.30 on 04-02-2014)
4- Wave-3(8626.95 on 04-12-2014)
5- Wave-4(7961.35 on 17-12-2014)
6- Wave-5(9119.20 on 04-03-2015)(Correction beginning)
7- Wave-1(8269.15 on 27-03-2015)
8- Wave-2(8844.40 on 15-04-2015)
9- Wave-3(7997.15 on 07-05-2015)
10- Wave-4(8489.55 on 22-05-2015)
11- Wave-5(7940.30 on 12-06-2015)
12- Pull Back Rally continuation with recent top formation at 8423.15 on 25-06-2015 

Conclusions from EOD chart analysis

That Wave-1 which started on 28-08-2013 from 5118.85 completed at 9119.20 on 04-03-2015 after 5 waves formation and correction started. Wave-5 of correction completed at 7940.30 on 12-06-2015 and now Pull Back Rally continuation with recent top formation at 8423.15 on 25-06-2015

Waves structure of on going 5 Waves correction

Nifty-EOD Chart (26-Jun-2015):-
Just click on chart for its enlarged view
Technical Patterns and Formations in EOD charts

1- Wave-5 completion at 9119.20 on 04-03-2015 and 5 Waves correction beginning
2- Wave-1(8269.15 on 27-03-2015)
3- Wave-2(8844.40 on 15-04-2015)
4- Wave-3(7997.15 on 07-05-2015)
5- Wave-4(8489.55 on 22-05-2015)
6- Wave-5(7940.30 on 12-06-2015)
7- Pull Back Rally continuation with recent top formation at 8,250.80 on 19-06-2015 

Conclusions from EOD chart analysis 

5 Waves of correction completed at 7940.30 on 12-06-2015 and Pull Back Rally is on but correction completion confirmation is still required because Nifty has to correct 4000 points points 18 months rally and as such price-wise or time-wise correction has not been seen yet.

Whole correction in Bullish Flag Pattern formation 

Nifty-EOD Chart (26-Jun-2015):-
Just click on chart for its enlarged view
Technical Patterns and Formations in EOD charts

1- Wave-4 completion at 7961.35 on 17-12-2014 and Wave-5 beginning
2- Wave-5 completion at 9119.20 on 04-03-2015 and Correction beginning
3- Corrective Wave-5 completion at 7940.30 on 12-06-2015 and Pull Back Rally beginning
4- Wave-5 completely retraced in correction after slipping below 7961.35  
5- Whole correction in Bullish Flag Pattern formation 

Conclusions from EOD chart analysis 

As Wave-5 completely retraced and whole correction was in Bullish Flag Pattern formation therefore emergence of correction completion strong signal at the bottom of correction at 7940.30 on 12-06-2015.

Fall Trend line of correction broken out

Nifty-EOD Chart (26-Jun-2015):-
Just click on chart for its enlarged view
Technical Patterns and Formations in EOD charts

1- Wave-4 completion at 7961.35 on 17-12-2014 and Wave-5 beginning
2- Wave-5 completion at 9119.20 on 04-03-2015 and Correction beginning
3- Corrective Wave-5 completion at 7940.30 on 12-06-2015 and Pull Back Rally beginning
4- Pull Back Rally continuation with recent top formation at 8423.15 on 25-06-2015 
5- Last 6 sessions closing above Long Term Trend decider 200 Day EMA(today at 8204).
6- Fall Trend line of correction broken out and last 5 sessions closing above it. 

Conclusions from EOD chart analysis 

Fall Trend line of correction broken out and last 5 sessions closing above it as well as last 6 sessions closing above Long Term Trend decider 200 Day EMA(today at 8204) therefore strong signals of Long Term Trend turning up after correction completion

Last 4 sessions intraday charts Analysis

Nifty-Intra Day Chart (Jun 23 to Jun 26,2015):-
Just click on chart for its enlarged view
Technical Patterns and Formations in last 4 Sessions intraday charts

1- Selling between 8385-8398 on 23-06-2015
2- Selling between 8393-8421 on 24-06-2015
3- Consolidation between 8340-8372 on 25-06-2015
4- Consolidation between 8387-8405 on 25-06-2015
5- Consolidation between 8340-8380 on 26-06-2015
6- 4 Sessions actual trading between 8335-8423 

Conclusions from 4 Sessions intra day chart analysis 

Although first 2 sessions selling but last 2 sessions good consolidations also in last 4 sessions therefore valid break out of last 4 sessions will be next trend confirmations and should be firstly watched in next week but finally up moves above 4 sessions highest(8423) is expected because good consolidation seen in last 2 sessions.

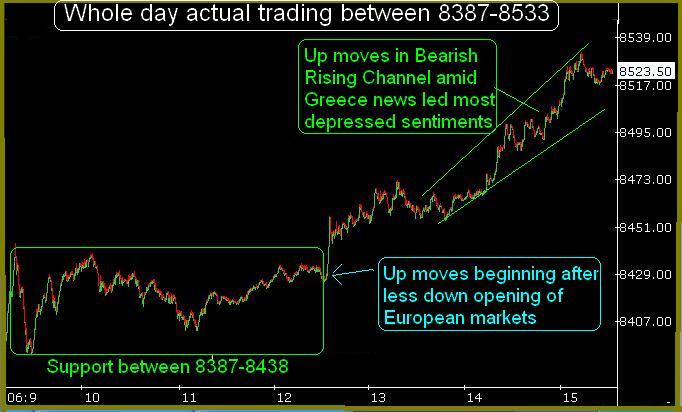
Intra Day Chart Analysis(29-06-2015)

Nifty-Intra Day Chart (26-Jun-2015):-
Just click on chart for its enlarged view
Technical Patterns and Formations in today intraday charts

1- Consolidation between 8340-8380(Immediate Supports)
2- Down moves in Bullish Falling Channel
3- Whole day actual trading between 8340-8408

Conclusions from intra day chart analysis

As negative news regarding Greece crisis therefore firstly negative zone trading and slipping from intraday higher levels after 11 AM but in Bullish Falling Channel and lower levels good consolidation also therefore finally up moves are expected above day's highest(8408.55) despite whatsoever solution of Greece financial problems on 27th and 28th June 2015.

Conclusions (After Putting All Studies Together)

Trends of Nifty are as follows:-

1- Short Term Trend is up
2- Intermediate Term Trend is down which will be up above 8505.
3- Long Term Trend decider 200 Day EMA(today at 8204) broken out and last 6 sessions closing above it as well as once 3%(8440) moves above it will mean Long Term Trend turning up confirmations.

As Whole correction from 9119.20 to 7940.30 is in Bullish Flag Pattern formation and Falling Trend line of correction broken out as well as last 5 sessions closing above it therefore strong signals of fresh rally above life time high(9119.20) after that rally correction completion which started from 5118.85 on 28-08-2013 and completed at 9119.20 on 04-03-2015.

Following confirmations are still required for 100% confirmation of correction completion:-

1- Valid break out of next resistances(8440-8486)
2- 3%(8440) Moves above Long Term Trend decider 200 Day EMA breaking out level.
3- Intermediate Term Trend turning up through moving above 8505

Sustaining above next resistance range(8440-8486) will mean Long Term Trend turning up confirmation and in that situation Intermediate Term Trend will also be up above 8505 therefore only break out of 8505 should be watched in the coming week for fresh rally towards life time high(9119.20) after all trends turning up confirmations.

As Whole correction in Bullish Flag Pattern formation , Falling Trend line of correction also broken out in previous week and last 2 sessions good intraday  consolidations therefore expected that on going rally will remain continued above 8505 in the coming week but after fresh follow up consolidations because strong resistances are lying between 8440-8486  
Next support levels of Nifty will decide Greece Crisis impact on Indian markets.
Post-open Outlook(26-06-2015)

All the Global markets including Indian markets are reacting on Greece Crisis and trading in Red. Just click following topic Link and go through full news which was updated 11 hours before in bbc.com:- 


Indian markets are also down immediately after opening and Nifty tested following next supports:- 

Supports between 8340-8372

Finally sustaining beyond above support levels will decide Greece Crisis reaction on Indian markets therefore should be firstly watched now. As some supports between 8353-8361 today therefore sustaining it beyond will be first signal.
Fresh Rally Expectations from Next Week
Intra Day Chart Analysis & Market Outlook
(26-06-2015)
Nifty-Intra Day Chart (25-Jun-2015):-
Just click on chart for its enlarged view
Technical Patterns and Formations in today intraday charts

1- Consolidation between 8340-8372(Immediate Supports)
2- Consolidation between 8387-8405(Immediate Supports)
3- Whole day actual trading between 8340-8423

Conclusions from intra day chart analysis 

As yesterday steep fall in last hour yesterday and uncertainty due to Greece Crisis therefore weak opening today but whole day good consolidation therefore emergence of fresh up moves possibility above today highest(8423). Last 2 sessions of all the global markets were Greece news led highly volatile and such volatility may be seen tomorrow also because final decision will come on next Saturday or Sunday.

Selling patterns between 8393-8421 yesterday and Nifty could not sustain above it today as well as closed near the lower levels of this range. Although good consolidation today but following resistances are lying above today closing:-

1- Resistances between 8393-8421
2- Resistances between 8440-8486(strong)

8 Sessions rally from 12-06-2015 to 23-06-2015 and its correction was seen yesterday but lower levels good consolidation and strong recovery was also seen today therefore if follow up consolidation develops tomorrow then Nifty will test above mentioned 2nd resistance as well as cross also.

As per our view Indian markets are well prepared for fresh rally and only negative news from Greece may create a hurdle but even though we are expecting that finally as such negative news will not come from Greece and fresh rally will be seen above 8486/8505 in next week.