Pull Back Rally continuation Possibility towards 8762.55
Technical Analysis,Research & Weekly Outlook
(Jun 01 to Jun 05,2015)
Nifty-EOD Chart (29-May-2015):-
 |
| Just click on chart for its enlarged view |
Technical Patterns and Formations in EOD charts
1- 5118.85 on 28-08-2013(Wave-1 beginning after 'ABC' correction completion)
2- Wave-1(6415.25 on 09-12-2013)
3- Wave-2(5933.30 on 04-02-2014)
4- Wave-3(8626.95 on 04-12-2014)
5- Wave-4(7961.35 on 17-12-2014)
6- Wave-5(9119.20 on 04-03-2015)('ABC' correction beginning)
7- Wave-'A'(8269.15 on 27-03-2015)
8- Wave-'B'(8844.40 on 15-04-2015)
9- Wave-'C'(7997.15 on 07-05-2015)
10- Pull Back rally continuation after Wave-'C' completion
Waves structure of Wave-5
Nifty-EOD Chart (29-May-2015):-
 |
| Just click on chart for its enlarged view |
Technical Patterns and Formations in EOD charts
1- 7961.35 on 17-12-2014(Wave-5 beginning after Wave-4 completion)
2- Sub Wave-1(8445.60 on 05-01-2015)
3- Sub Wave-2(8065.45 on 07-01-2015)
4- Sub Wave-3(8996.60 on 30-01-2015)
5- Sub Wave-4(8470.50 on 10-02-2015)
6- Sub Wave-5 of Wave-5 completion at 9119.20 on 04-03-2015 and 'ABC'correction beginning
7- Wave-'A'(8269.15 on 27-03-2015)
8- Wave-'B'(8844.40 on 15-04-2015)
9- Wave-'C'(7997.15 on 07-05-2015)
10- Nifty hovered around 11 sessions Long Term Trend decider 200 Day EMA(today at 8209) and finally sustained above it.
11- 15 sessions trading between 7997-8365 from 24-04-2015 to 15-05-2015 and this range broken out on 18-05-2015.
12- Bullish Inverted Head and Shoulders formations in 15 sessions with its Neckline at 8365 which was broken out on 18-05-2015.
13- 15 sessions trading range top and Neckline(8365) of Inverted Head and Shoulders was broken down 2 times in previous week but finally sharply moved up above 8365 on 29-05-2015
Waves structure of 'ABC'on going correction
Nifty-EOD Chart (29-May-2015):-
 |
| Just click on chart for its enlarged view |
Technical Patterns and Formations in EOD charts
1- Wave-5 completion at 9119.20 on 04-03-2015 and 'ABC'correction beginning
2- Wave-'A'(8269.15 on 27-03-2015)
3- Wave-'B'(8844.40 on 15-04-2015)
4- Wave-'C'(7997.15 on 07-05-2015)
5- Sub Wave-1(8489.55 on 22-05-2015)
6- Sub Wave-2(8270.15 on 28-05-2015)
7- Sub Wave-3 continuation with recent top formation at 8,443.90 on 29-05-2015
Intra Day Chart Analysis(29-05-2015)
Nifty-Intra Day Chart (29-May-2015):-
 |
| Just click on chart for its enlarged view |
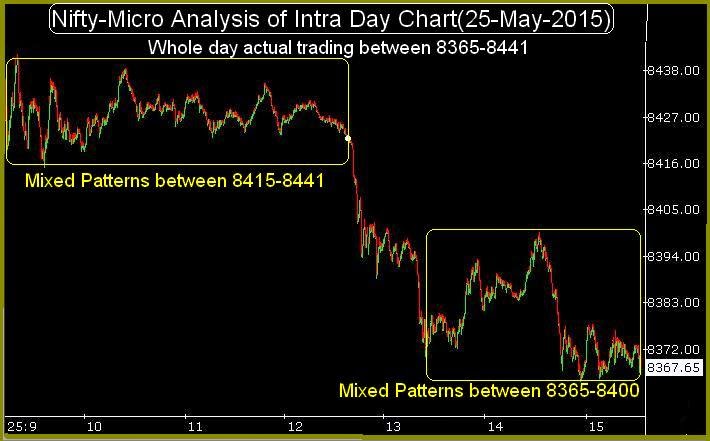
Technical Patterns and Formations in today intraday charts
1- Mixed Patterns between 8370-8443 in 5 last hours.
2- Whole day actual trading between 8305-8443
Conclusions from intra day chart analysis
Although closing near the higher levels of the day with 1.38% gains but mixed(both buying and selling) Patterns formations between 8370-8443 in last 5 hours therefore selling possibility can not be ruled out on the back of all around accepted RBI Rates cut on 2nd June and follow up consolidation is must in the beginning of next week for rally continuation.
Conclusions (After Putting All Studies Together)
Wave-1 started from 5118.85 on 28-08-2013 and its Wave-5 commenced from 7961.35 on 17-12-2014 which completed at 9119.20 on 04-03-2015. After that 'ABC'correction begun which finished at 7997.15 on 07-05-2015 and it is just above the bottom of Wave-5(7961.35) therefore it is clear that Wave-5 has almost completely retraced in previous 'ABC' correction. Following Bullish developments at the bottom of Wave-'C':-
1- Bullish Inverted Head and Shoulders with its Neckline at 8365 broken out.
2- 15 sessions trading between 7997-8365 and its top at 8365 broken out.
3- Nifty tested and hovered around 11 sessions Long Term Trend decider 200 Day EMA(today at 8209) and finally sustained above it.
As above most crucial and Bullish patterns near the bottom of Wave-'C' therefore strong indications of 'ABC'correction completion because:-
1- As 42 Sessions correction from 04-03-2015 to 17-12-2014 and 15 sessions Bullish pattern formation near the bottom of correction therefore it is sufficient for time wise correction completion.
2- Wave-5 has almost completely retraced in previous 'ABC' correction therefore price wise correction completion can also be considered
Sub Wave-3 is on and as per following calculations its minimum target is at
As per Elliot Wave theory "Wave-3 should not be shorter than both Wave-1 and Wave-5. Impulsive Sub Wave-3 is on and it should gain more points than Sub Wave-1 gained.
Sub Wave-1 gained 8489.55-7997.15=492.40 Points
Sub Wave-3 started from 8270.15 and and as per Elliot Wave theory it should gain minimum 492.40 because it can not be shorter than Sub Wave-1 therefore its minimum target is at:-
8762.55=8270.15(Sub Wave-3 started)+492.40(Sub Wave-1 gained)
Next resistances of Nifty are as follows:-
1- 8431-8462
2- 8486-8502
3- 8522-8564
4- 8640-8468
5- 8690-8750
6- 8777-8784
7- 8802-8844
Wave-5 has almost completely corrected and Bullish patterns formations at the bottom of Wave-'C' therefore strong signals of that whole rally correction completion which started from 5118.85 on 28-08-2013. It also means that Nifty is now prepared for fresh rally above life time high(9119.20) after previous rally correction completion.
For Short Term now Pull Back Rally continuation towards 8762.55 will be understood in the coming weeks but follow up consolidation is must because 5 hours mixed Patterns formations on 29-05-2015 and above mentioned multiple resistances above previous week closing.