ॐ ह्रीं श्रीं लक्ष्मीभयो नमः॥


Trading "calls" from our "Software" with more than "90% accuracy"

More than "12 years" old "only site of whole world" 
with more than "9700 accurate Outlooks" of 
"Indian Stock Markets" 
Nifty is Ready for Fresh Rally Towards New all time High 
Technical Analysis and Market Outlook
(06-02-2015)
Nifty-Intra Day Chart (05-Feb-2015):-
Just click on chart for its enlarged view
Technical Patterns and Formations in today intraday charts

1- Consolidation between 8738-8766
2- 154 Points Down moves in Bullish Falling Channel
3- Whole day actual trading between 8684-8838

Conclusions from intra day chart analysis 

Following projections proved 100% accurate which were done yesterday in "Cautiously Bullish view with Pull Back Rally possibility":-

1- View is cautiously Bullish with Pull Back Rally possibility
2- Pull Back Rally possibility will be considered up to 8852

Following intraday moves of today proved that our above projections were 100% accurate:-

1- Nifty traded 114 up in above mentioned Pull Back Rally
2- Today highest is at 8838.45 and Pull Back Rally possibility was considered up to 8852.
3- We were cautiously Bullish and Nifty slipped 154 points from higher levels and closed 12 points down

Following Weekly analysis topic was posted on 30-01-2015:-

8695 Will decide Depth of Correction

Nifty tested 8695 today and closed at 8711.70 after lowest formation at 8,683.65 today and now following questions have to be answered:-

1- Will correction complete near about 8695?
2- Will deeper correction will be seen after sustaining below 8695 and Intermediate Term Trend turning down confirmation?

As per our view correction will complete near about 8695 because:-

1- More than 3 hours consolidation today. 
2- 154 Points Down moves in Bullish Falling Channel which is a consolidation pattern.
3- Intraday patterns of last 3 sessions are showing good consolidation pattern and minor selling patterns.
4- Nifty traded in the range of last 3 sessions with consolidation patterns today.

As big fall of 30-01-2015 was not supported by huge selling and good selling was not seen before that day also therefore final conclusion after today consolidation is that:-

Nifty will not sustain below 8695 and correction will complete near about 8695 as well as fresh rally towards new all time high will generate from this and near about 8695. 
Cautiously Bullish view with Pull Back Rally possibility
Technical Analysis and Market Outlook
(05-02-2015)
Nifty-Intra Day Chart (04-Feb-2015):-
Just click on chart for its enlarged view
Technical Patterns and Formations in today intraday charts

1- Down moves in Bullish Falling Channel
2- Minor selling between 8760-8772
3- Slow down moves in last 40 minutes.
4- Whole day actual trading between 8705-8792

Conclusions from intra day chart analysis 

Although Nifty slipped 69 points in last 40 minutes and Red closing near the lower levels of the day but down moves were slow which is a consolidation indication. As both higher levels minor selling and down moves in  Bullish Falling Channel were also seen therefore if follow up consolidation develops tomorrow then up moves will be seen above today highest.

View is not Bearish despite 0.38% down closing today and emergence of supports getting possibility between next 2nd support range(8695-8720). Pull Back Rally possibility will be considered up to 8852 but correction completion confirmation is still required through sustaining above following levels:-

1- 8772
2- 8852

Although last 3 sessions of this week closed in Red but as such selling patterns were not seen and on the contrary consolidation patterns were also seen therefore View is cautiously Bullish with Pull Back Rally possibility and next trend view will be formed after next 1/2 sessions intraday charts patterns formations watching.
Next Big Moves require Some More Technical Positions Formations
Technical Analysis and Market Outlook
(04-02-2015)
Nifty-Intra Day Chart (03-Feb-2015):-
Just click on chart for its enlarged view
Technical Patterns and Formations in today intraday charts

1- Consolidation between 8727-8758(Immediate Supports)
2- Consolidation Pattern of all Down moves in Bullish Falling Channels
3- Whole day actual trading between 8727-8837

Conclusions from intra day chart analysis 

Following line with resistances were updated yesterday in "Pull Back rally Possibility within Sideways market":-

As following resistances therefore firstly consolidation is required for next rally above 9000:-

1- Resistance between 8820-8852
2- Resistance between 8918-8936

Although strong opening but above resistances therefore Nifty could not cross 1st resistance and slipped after highest formation at 8,837.30 and closing near the lower levels of the day. Following supports were updated on 30-01-2015 in "8695 Will decide Depth of Correction 8695 Will decide Depth of Correction":-

1- Supports between 8727-8755
2- Supports between 8695-8720

Although sharp down after RBI Credit policy but Nifty got support exactly at above 1st support after lowest formation at 8726.65.

As lower levels buying with consolidation Pattern of all Down moves with Bullish Falling Channel formations therefore emergence of first correction completion signal but follow up consolidation is must because above resistances are lying at higher levels.

Long and Intermediate Term Trends are up and Short Term Trend is down and Nifty is sideways between  8695-8996. As higher levels resistances and lower levels supports within this range therefore Indian markets are not prepared for any side decisive moves. Follow up moves for technical positions formations and finally sustaining beyond 8695-8996 will decide following next big moves:-

1- Sustaining below 8695 after follow up selling will mean sharp Correction after Intermediate Term Trend turning down confirmations.
2- Sustaining above 8996 after follow up consolidation will mean fresh up moves above 9000 after all Trends turning up confirmations.

No gossiping never guessing and whatsoever market suggest only that is always updated. Let market prepare for next trend and decisive moves then will be updated from intraday charts patterns formations in the same manner as being down for the last more than 4 years.
Pull Back rally Possibility within Sideways market
Technical Analysis and Market Outlook
(03-02-2015)
Nifty-Intra Day Chart (02-Feb-2015):-
Just click on chart for its enlarged view
Technical Patterns and Formations in today intraday charts

1- Consolidation Patterns between 8752-8770
2- Consolidation Patterns between 8776-8802
3- Whole day actual trading between 8752-8840

Conclusions from intra day chart analysis 

Although Red closing after most time negative zone trading but lower levels good consolidation therefore Pull Back Rally will be seen tomorrow. As following resistances therefore firstly consolidation is required for next rally above 9000:-

1- Resistance between 8820-8852
2- Resistance between 8918-8936

As lower levels supports and higher levels resistances between 8695-8996 therefore Nifty will be understood sideways within this range and Nifty will firstly trade and prepare for next trend within this range. All trends are up but Oscillators are overbought therefore correction is very much due which was seen last Friday and 8695 will decide depth of correction. Follow up moves with sustaining beyond 8695-8996 will be next trend confirmations and should be firstly watched for next trend confirmations .
8695 Will decide Depth of Correction
Technical Analysis,Research & Weekly Outlook
(Feb 02 to Feb 06,2015)
Nifty-EOD Chart (30-Jan-2015):-
Just click on chart for its enlarged view
 Technical Patterns and Formations in EOD charts

1- 4531.15 on 20-12-2011(Rally beginning after 13 Months correction completion)
2- Wave-1(6229.45 on 20-05-2013)
3- Wave-2(5118.85 on 28-08-2013)
4- Wave-3 continuation with recent top formation at 8996.60 on 30-01-2015

Nifty-EOD Chart (30-Jan-2015):-
Just click on chart for its enlarged view
Technical Patterns and Formations in EOD charts

1- 5118.85 on 28-08-2013(Wave-i of Wave-3 beginning after 'ABC' correction completion)
2- Wave-i of Wave-3(6415.25 on 09-12-2013)
3- Wave-ii of Wave-3(5933.30 on 04-02-2014)
4- Wave-iii of Wave-3(8626.95 on 04-12-2014)
5- Wave-iv of Wave-3(7961.35 on 17-12-2014)
6- Wave-v of Wave-3 continuation with recent top formation at 8996.60 on 30-01-2015

Nifty-EOD Chart (30-Jan-2015):-
Just click on chart for its enlarged view
Technical Patterns and Formations in EOD charts

1- Wave-v of Wave-3 started after correction completion at 7961.35 on 17-12-2014 
2- Wave-v of Wave-3 continuation with recent top formation at 8,996.60 on 30-01-2015
3- 143.45(1.60%) correction on 30-01-2015 with Bearish Engulfing Candle formation

Conclusions from EOD charts analysis 

All trends are up and Bullish rally is very much on and new life time high formation at 8996.60 on 30-01-2015 but immediate after that 1.60% correction was seen which will be understood intraday/Very Short Term correction. Wave-v of Wave-3 continuation and this wave will be correction after Short Term correction confirmation. Wave-v of Wave-3 started from 7961.35 and correction started after high formation at 8,996.60,Fibonacci retracement levels of this Wave are as follows:- 

[0.130] 8,862.0200(Done)
[0.236] 8,752.2800
[0.270] 8,717.0800
[0.382] 8,601.1300
[0.500] 8,478.9800
[0.618] 8,356.8200
[0.707] 8,264.6800
[0.764] 8,205.6700
[0.786] 8,182.8900
[0.886] 8,079.3700

Bearish Engulfing Candle formation on 30-01-2015 which signifies that the uptrend has been hurt and the bears may be gaining strength. Next supports are as follows:-

1- Supports between 8796-8815
2- Gap support between 8775-8795
3- Supports between 8727-8755
4- Supports between 8695-8720

As Short Term Oscillators were overbought after strong rally in last 10 sessions and sentiment turned heated after Dow Jones 225 points rally on 29-01-2015 therefore intraday correction was seen on 30-01-2015 for cooling down. As Bearish Engulfing Candle formation which closed at 5 sessions lowest after 5 sessions lowest formation therefore view is cautious and firstly sustaining beyond lowest of above supports will decide deeper correction beginning below(8695) or correction completion above(8695).
2 Supports just below today Lowest
Mid-session Outlook-2(30-01-2015)

Firstly 176 points sharp fall from intraday higher levels in first 2 and half hours and after that sideways market today. Intraday correction is being seen today and Nifty is trading between 8820-8855 for last 2 hours which is near the lower levels of last 4 sessions. Next supports just below today lowest are as follows:-

1- Supports between 8796-8815
2- Gap support between 8775-8795

Firstly sustaining beyond 8775-8855 should be watched now for:-

1- Intraday/Very Short Term Correction completion above 8855
2- Short Term Correction continuation below 8775

As good consolidation between 8862-8893 yesterday therefore expected that Nifty will not easily sustain below 8862 as well as will get supports near about above mentioned 2 supports. Today intraday charts have also not shown as such good selling therefore expected that today started correction will complete within next 2/3 sessions.

Mid-session Outlook(30-01-2015)

As Short Term Oscillators were overbought after strong rally in last 10 sessions and sentiment turned heated after Dow Jones 225 points rally of yesterday therefore intraday correction is being seen immediately after opening today. Intraday correction may retrace upto following levels:-

[0.130]- 8,874.7800
[0.236]- 8,886.0200
[0.270]- 8,889.6200
[0.382]- 8,901.4900

As good consolidation between 8862-8893 yesterday therefore Nifty will not easily sustain below 8862 as well as expected that Nifty will get supports within or near about this range. At present intraday charts of first 2 hours are suggesting that it is only that correction which should complete within 2/3 sessions.
Rally continuation in Uncharted Territory after 8880 broken Out
Technical Analysis and Market Outlook
(30-01-2015)
Nifty-Intra Day Chart (Jan 27 to Jan 29,2015):-
Just click on chart for its enlarged view
Technical Patterns and Formations in last 3 Sessions intraday charts

1- Testing of 8880 in last 3 sessions
2- Consolidation near about 8880 in last 3 sessions.
3- Selling at higher levels on 28-01-2015
3- 3 Sessions actual trading between 8826-8985

 Conclusions from 3 Sessions intra day chart analysis 

Importance of 8880 was updated in following topic on 24-01-2015:-


Nifty tested 8880 all the next 3 trading sessions after the posting of above topic and consolidated near about 8880 in all the last 3 sessions as well as Nifty most time hovered around 8880 today.

Nifty-Intra Day Chart (29-Jan-2015):-
Just click on chart for its enlarged view
Technical Patterns and Formations in today intraday charts

1- More than 5 hours consolidation between 8862-8893(Immediate Supports)
2- Nifty most time hovered around 8880.
3- Sharp up and 8880 broken out confirmation in last hour.
4- Whole day actual trading between 8862-8966

Conclusions from intra day chart analysis 

Most time hovered around 8880 and forcefully broken out in last hour after more than 5 hours consolidation and strong indication of fresh rally beginning today.

Conclusions (After Putting All Indicators Together)

Although Nifty closed near the lower levels of the day on 28-01-2015 but we were not Bearish because lower levels good consolidation patterns and supports were also seen therefore we posted following topic yesterday;-


Although Most Asian markets were in deep Red after Dow Jones closing 195 points down but in that Bearish sentiment also we were not Bearish therefore we told following lines within 1st hour today in Post-open Outlook(29-01-2015):-

1- until Nifty will not sustain below 8790 till then even Very Short Term correction will not be considered 
2- good consolidation patterns formations yesterday
3- Until complete selling patterns will not develop till then decisive down moves will not be seen.

We have posted only Bullishness in all the previous Outlooks and strong rally is very much on. As next resistances are between 8947-8985 which are just above today highest therefore some more consolidation is required for next up moves but expected that finally rally will remain continued in uncharted territory because good consolidation near about 8880 in last 3 sessions and its forceful break out confirmation in last hour today.

Post-open Outlook(29-01-2015)

As Dow Jones closed 195 points down after FOMC statement therefore and in reaction all the Asian markets are in Red,resultant weakness in Indian markets. Reaction of FOMC statement has to be firstly understood and until Nifty will not sustain below 8790 till then even Very Short Term correction will not be considered because good consolidation patterns formations yesterday. Until complete selling patterns will not develop till then decisive down moves will not be seen.
Rally Continuation
Technical Analysis and Market Outlook
(29-01-2015)
Nifty-Intra Day Chart (28-Jan-2015):-
Just click on chart for its enlarged view
Technical Patterns and Formations in today intraday charts

1- Buying between 8892-8916 (Immediate Supports)
2- Selling between 8947-8985 (Immediate Resistances)
3- Down moves in Bullish Falling Channel in last more than 2 hours
4- Whole day actual trading between 8875-8985

Conclusions from intra day chart analysis 

Neither we were Bullish nor Bearish for today market therefore we posted following topic for today trading and Nifty closed flat at 8914.30 within mentioned trading range(8790-8925) in the given topic:-


Although Nifty could not sustain at higher levels after strong intraday rally and higher levels selling patterns were also seen but lower levels good consolidation patterns and supports were also seen therefore expected that rally will remain continued despite today closing near the lower levels of the day.
Key of Next Trend between
 8790-8925
Technical Analysis and Market Outlook
(28-01-2015)
Nifty-Intra Day Chart (27-Jan-2015):-
Just click on chart for its enlarged view
Technical Patterns and Formations in today intraday charts

1- Selling between 8852-8860
2- Buying between 8826-8841
3- 1 Hour Up moves in Bearish Rising Channel
4- Whole day actual trading between 8826-8925

Conclusions from intra day chart analysis 

As Indian markets under performed immediately after opening therefore we told following line at 09:15 AM in Post-open Outlook(27-01-2015):-

view is cautious and firstly sustaining beyond 8790-8880 should be watched for next immediate moves confirmations. 

Although closing near the highs of the day after last hour sharp rally but today intraday charts are showing Mixed Patterns formations because following both buying and selling patterns formations today:-

1- Nifty slipped into Red after more than 1 hour hour selling.
2- Almost 1 hour lower levels buying.
3- Last 1 Hour Up moves in Bearish Rising Channel

Following line was told on 24-02-2014 in 'Sustaining of Nifty above 8880 will mean Next 20 months Rally':-

As some selling was seen just below 8863 last Friday therefore follow up consolidation is firstly required and once sustaining above 8880 will mean fresh rally

As follow up selling below 8863 and and Bearish Rising Channel pattern formations above 8863 therefore sustaining above 8880 is must for fresh rally despite closing above 8880 today.  

Indian markets are not prepared for any side decisive after Mixed patterns formations today and expected that Nifty will trade and firstly prepare for next decisive moves between 8790-8925 and valid break out above 8925 after follow up consolidation will mean next fresh phase of up moves. As minor selling till now therefore at present only Very Short Term correction  will be considered after valid break out below 8790.

Post-open Outlook(27-01-2015)

Although positive Indian markets but under performing therefore view is cautious and firstly sustaining beyond 8790-8880 should be watched for next immediate moves confirmations.
Sustaining of Nifty above 8880 will mean Next 20 months Rally
Technical Analysis,Research & Weekly Outlook
(Jan 27 to Jan 30,2015)
Nifty-Weekly Chart (23-Jan-2015):-
Just click on chart for its enlarged view
Technical Patterns and Formations in EOD charts

1- 6357.10 on 08-01-2008(15 Years high formation)
2- 2252.75 on 27-10-2008(Wave-1 begining after 2008 correction completion)
3- 6338.50 on 05-11-2010(Wave-1 completion and Corrective Wave-2 beginning)
4- Wave-1 gained 4085.75 points.
5- 4531.15 on 20-12-2011( 13 Months Wave-2 correction completion and Impulsive Wave-3 beginning)
6- Wave-3 continuation(35 Months rally with recent top formation at 8,866.40 on 23-01-2015)

Conclusions from Weekly chart analysis 

Wave-3 is on and no signal of its completion yet therefore its continuation is expected.

Wave-1 started from 2252 and completed at 6338. Fibonacci retracements levels of this wave are as follows:-

[1.130] 6,869 (Done)
[1.236] 7,302 (Done)
[1.270] 7,441 (Done)
[1.382] 7,898 (Done)
[1.414] 8,029 (Done)
[1.500] 8,381 (Done)
[1.618] 8,863 (Done on 23-01-2015)
[1.764] 9,459
[1.886] 9,958
[2.000] 10,424
[2.236] 11,388
[2.618] 12,949
[3.140] 15,082
[3.618] 17,035
[4.236] 19,564

(Although not easy to accept or imagine also but above higher levels will be seen in coming years)

Nifty-EOD Chart (23-Jan-2015):-
Just click on chart for its enlarged view
Technical Patterns and Formations in EOD charts

1- Wave-5 completion at 8626.95 on 04-12-2014 and correction beginning.
2- Correction completion at 7961.35 on 17-12-2014 and correction beginning.
3- 'Pennant Pattern'formations in 28 Sessions Correction
4- 'Pennant Pattern' broken out on 15-01-2015 after RBI Repo Rates cut

Conclusions from EOD chart analysis 

Correction in 'Pennant Pattern' started after Wave-5 completion which completed on 15-01-2015 after RBI Repo Rates cut and forcefully broken out as well as sustained above it. 

Fibonacci retracements levels of 'Pennant Pattern'(7961-8626) are as follows:-

[1.130] 8,712 (Done)
[1.236] 8,782 (Done)
[1.270] 8,805 (Done)
[1.382] 8,880
[1.414] 8,901
[1.500] 8,958
[1.618] 9,036
[1.764] 9,134
[1.886] 9,215
[2.000] 9,291
[2.236] 9,447
[2.618] 9,701

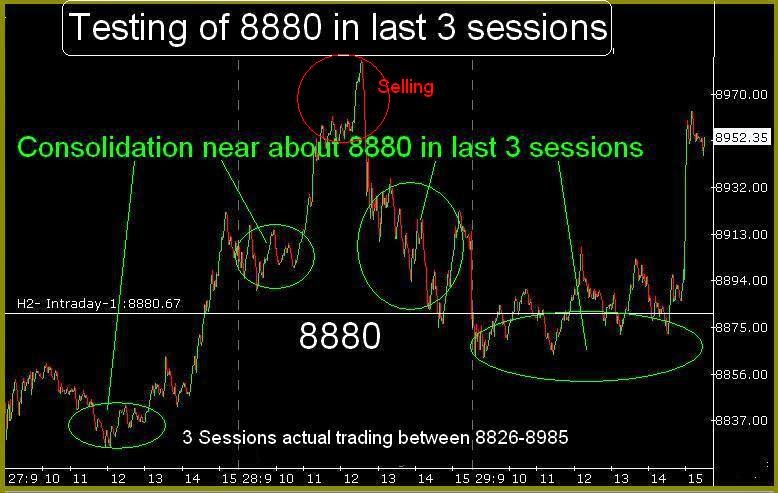
Nifty-Intra Day Chart (23-Jan-2015):-
Just click on chart for its enlarged view
Technical Patterns and Formations in today intraday charts

1- Selling between 8848-8865(Immediate Resistances)
2- Buying between 8796-8815(Immediate Supports)
3- Higher bottom formations
4- Down moves in Bullish Falling Channel
5- Up moves with intraday correction
6- Whole day actual trading between 8796-8865

Conclusions from intra day chart analysis 

Although firstly higher levels selling but lower levels buying was also seen with following consolidation patterns:- 

1- Higher bottom formations
2- Down moves in Bullish Falling Channel
3- Up moves with intraday correction

As sufficient consolidation was also seen therefore intraday charts are suggesting that rally continuation expectation are alive despite first hour higher levels selling.

Conclusions (After Putting All Studies Together)

'Pennant Pattern' completed 1.270%(8805) retracement and may face some resistance at 1.382%(8880) because some selling was seen just below it last Friday. 1.618% retracement(8,863) has been completed on 23-01-2015 and Nifty slipped as well as closed below it last Friday but consolidation was also seen at lower levels therefore rally continuation hopes are still alive but follow up consolidation is firstly required.

Fibonacci numbers are as follows:-

1, 1, 2, 3, 5, 8, 13, 21, 34, 55, 89, 144, 233,...

Wave-2 completed its correction exactly in 13 Months on 20-12-2011 at 4531.15 and impulsive Wave-3 is on for the last 35 months. As Fibonacci number of 34 is crossed therefore Wave-3 continuation hopes have emerged till 55 months means next 20 months.  

All trends are up,Indian markets are most Bullish and fresh rally is on after correction completion in 'Pennant Pattern'formations. Until complete selling patterns will not develop on EOD Charts till then decisive down moves or any big correction will not be considered. As Oscillators are overbought and sentiment is heated therefore minor,intraday or 1/2 sessions correction may be seen for cooling down of sentiment but finally rally is still expected.

Next most crucial levels are follows:-

1- 1.618%(8863) of Wave-3  
2- 1.382%(8880) retracement of 'Pennant Pattern'

As some selling was seen just below 8863 last Friday therefore follow consolidation is firstly required and once sustaining above 8880 will mean fresh rally towards and above those higher levels which have been updated above because that will mean Wave-3 continuation up to next 20 months also.  

Expected that finally Nifty will sustain above 8880 and impulsive Wave-3 will remain continued till next 20 months.
Live Proofs of profitable calls to our Paid Clients and 100% Accurate Analysis
As we were Bullish therefore we updated only Bullish views in following topics in last 4 days:-

1- 23-01-2015-Bulls are roaring like Lion
2- 22-01-2015-Rally Continuation after follow up consolidations
3- 21-01-2015-4 Characters of Bull Markets Correction
4- 20-01-2015-Fresh Rally continuation after Pennant Pattern broken out Confirmations

As was told 100% same happened and strong rally was seen in last 4 days and Nifty is trading 93 points up today

We updated 100% accurate above analysis in this Blog and also sent following profit making calls(SMS) to our paid clients:-

SMS No 1- At 12:18 PM on 20-01-2015- NIFTY-Jan CE(8600)-Buy-Positional-SL-74 & TGT-114-CMP-90(Lalit39)
SMS No 2- At 01:58 PM on 20-01-2015- NIFTY-Jan CE(8600)-Bought on 20-01-2015-Target achieved,Cover and book profit immediately-CMP-114(Lalit39)
SMS No 3- At 03:16 PM on 22-01-2015-NIFTY-Jan CE(8800)-Buy-Positional-SL-49 & TGT-91-CMP-68(Lalit39)
SMS No 4- At 09:16 AM on 23-01-2015-NIFTY-Jan CE(8800)-Bought on 22-01-2015-Target achieved,Cover and book profit immediately-CMP-97(Lalit39)

We always send 2 SMS for each and every call from those fastest websites which deliver SMS within 15 seconds. As we always talk with those proofs which no one can deny therefore updating following live proofs of above mentioned SMS pictures which were sent to our paid clients:-

1- SMS No 1,2 and 3 Picture from 1st Website(Trading and covering SMS):-
Just click on above picture for enlarged view of those SMS which were sent to paid clients
2- SMS No 1 and 2 Picture from 2nd Website(Trading and covering SMS):-
Just click on above picture for enlarged view of those SMS which were sent to paid clients
3- SMS No 3 Picture from 2nd Website(Trading SMS):-
Just click on above picture for enlarged view of those SMS which were sent to paid clients
4- SMS No 4 Picture from 1st Website(Covering SMS):-
Just click on above picture for enlarged view of those SMS which were sent to paid clients
5- SMS No 4 Picture from 2nd Website(Covering SMS):-
Just click on above picture for enlarged view of those SMS which were sent to paid clients
If unable to read  text in above picture then:-

1- Firstly click on above SMS picture and enlarge it.
2- If unable to read then Save picture on yours desktop and after that  
3- Open and again enlarge the picture in Windows Picture Viewer.

Only 2 following information are deleted in above SMS Picture due to official secrecy rules:-

1- Numbers of sent SMS.
2- SMS sending Website name.

As we always send 2 SMS for each and every trading call and  2 SMS for each its covering therefore Wherever Our clients are moving they need not to watch market and only have to keep Mobile in their pocket because in any worst condition also minimum 1 SMS will be delivered and our clients will be able to trade and cover without any delay.

We always talk with only those proofs which no one can deny therefore live proofs have been updated and even though if anyone has any doubt then may call us and then he will be given the Mobile Numbers of those who enjoyed profits from any part in India.
Although Nifty is 93 points up immediately after opening today but we were expecting such strong market therefore we told yesterday that:-

Bulls are roaring like Lion
Technical Analysis and Market Outlook
(23-01-2015)
Nifty-Intra Day Chart (22-Jan-2015):-
Just click on chart for its enlarged view
Technical Patterns and Formations in today intraday charts

1- Selling between 8762-8772 (Immediate Resistances)
2- Selling between 8760-8766 (Immediate Resistances)
3- Consolidation between 8728-8742 (Immediate Supports)
4- Whole day Down moves in Bullish Falling Channel
5- Whole day actual trading between 8728-8774

Conclusions from intra day chart analysis 

Although firstly selling and more than 3 hours slipping also from higher levels but Down moves in Bullish Falling Channel and lower levels consolidations also therefore it is very much clear that as such selling was not seen today that would suggest correction beginning.

All trends are up,Indian markets are most Bullish and fresh rally is on after correction completion confirmation on 20-01-2015 therefore until complete selling patterns will not develop till then decisive down moves or any big correction will not be considered. As Oscillators are overbought and sentiment is heated therefore minor,intraday or 1/2 sessions correction may be seen for cooling down but finally rally will remain continued.
Rally Continuation after follow up consolidations
Technical Analysis and Market Outlook
(22-01-2015)
Nifty-Intra Day Chart (21-Jan-2015):-
Just click on chart for its enlarged view
Technical Patterns and Formations in today intraday charts

1- Selling between 8722-8741(Immediate Resistance)
2- Higher levels patterns formation 
3- Up moves in Bearish Rising Channel
4- 3 Times supports and consolidation Patterns between 8690-8713(Immediate Supports)
5- Down moves in Bullish Falling Channel
6- Whole day actual trading between 8690-8741

Conclusions from intra day chart analysis 

As very short term Oscillators were overbought and sentiment turned heated also after last 4 sessions strong rally therefore cooling down was required and it was seen today through whole day sideways trading within 51 points. Intraday patterns of today are completely mixed because both buying and selling patterns formation and more preparation is firstly required within and near about today trading range(8690-8741) for next decisive moves/trend.

Follow up moves with sustaining beyond today trading range should be firstly watched tomorrow for next decisive moves confirmations but finally rally continuation is expected above today highest(8741) after follow up consolidations. 

As Dow Jones'Futures is now trading more than 80 points down and if such weakness does reflect tomorrow in Asian markets also then weakness may be firstly seen in Indian markets but expected that finally rally continuation will be seen because fresh up moves are on after 31 sessions correction completion on 20-01-2015. 
---------------------------------
Intraday Levels and Trading Strategy 
For 20-01-2015 
-----------------------------------
For Intraday traders"Levels" and "Trading Strategy" are updated daily in the left of this Blog
For Intraday trading Policies- Just click on following "Topic link" and trade according to given "Levels" and "Trading Strategy":-

4 Characters of Bull Markets Correction
Technical Analysis and Market Outlook
(21-01-2015)

Nifty-Intra Day Chart (20-Jan-2015):-
Just click on chart for its enlarged view
Technical Patterns and Formations in today intraday charts

1- First 4 hours consolidations between 8575-8620
2- Strong 100 points rally in last 2 hours
3- Whole day actual trading between 8575-8707

Conclusions from intra day chart analysis 

Following line was told on 19-01-2015 in "Fresh Rally continuation after Pennant Pattern broken out Confirmations"

some more consolidation is firstly required for fresh up moves above all time highest.

Nifty consolidated first 4 hours between 8575-8620 and after that new life time formation above 8626.95,then strong 100 points rally was seen in last 2 hours.

Following topic was posted on 12-01-2015

Nifty will give First Strong Indication of Next Big Moves from Pennant Pattern Break Out 

As Pennant Pattern formation therefore Wave'C' failed after RBI Repo rates cut and Pennant Pattern broken out after huge gap up opening. 

Nifty sustained 3 days above Upper line of Pennant and higher levels consolidations was also seen in intraday charts of 19-01-2015 therefore 'Pennant Pattern' broken out got confirmations and we posted following lines on 19-01-2015 in "Fresh Rally continuation after Pennant Pattern broken out Confirmations"

1- fresh rally after correction completion confirmations
2- emergence of fresh rally expectations after last 31 sessions correction completion.
3- expected that rally will remain continued:-

As was told 100% same happened and strong 144 points rally was seen yesterday.

All trends are up and Indian markets are so Bullish that 2693 points rally corrected only 665 points as well as corrective Wave'C' failed. Certainly fresh rally starting confirmation and Indian markets are trading in new zone as well as no selling at higher levels therefore rally will remain continued. Following 4 characters of such Bull markets should be kept in mind:- 

1- Such Bull markets reuqire complete selling patterns on EOD charts before any big correction.
2- Such Bull markets completes its correction after intraday or 1/2 sessions dorn moves. 
3- Such Bull markets completes its correction side markets with minor moves also.
4- Such Bull markets completes its correction at higher levels also without any down moves if any positive new flow.

As very short term Oscillators are overbought after also last 4 sessions strong rally therefore minor correction may be seen any day but finally rally will remain continued.

Pre-closing Outlook(20-01-2015)

Nifty is traded more than 150 points up after new life time high formation today but we told for such rally 3 times yesterday in "Fresh Rally continuation after Pennant Pattern broken out Confirmations"

1- fresh rally after correction completion confirmations
2- emergence of fresh rally expectations after last 31 sessions correction completion.
3- expected that rally will remain continued

Certainly fresh rally after 31 sessions correction completion and until complete selling patterns will not develop on EOD Charts till then correction will not begin and clear caution that fresh short positions must be built up only after such selling patterns formations.
Fresh Rally continuation after Pennant Pattern broken out Confirmations
Technical Analysis and Market Outlook
(20-01-2015)
Nifty-EOD Chart (19-Jan-2015):-
Just click on chart for its enlarged view
Technical Patterns and Formations in EOD charts

1- Wave-5 completion at 8626.95 on 04-12-2014 and correction beginning.
2- 'Pennant Pattern'formations in last 28 Sessions Correction
3- 'Pennant Pattern' broken out on 15-01-2015 after RBI Repo Rates cut

Conclusions from EOD chart analysis 

As waves structure was not completed and 'Pennant Pattern' broken out after RBI Repo Rates cut as well as Nifty sustained above Upper line of Pennant in last 3 sessions therefore 'Pennant Pattern' broken out and fresh rally after correction completion confirmations.

Nifty-Intra Day Chart (19-Jan-2015):-
Just click on chart for its enlarged view
Technical Patterns and Formations in today intraday charts

1- Up moves with intraday consolidations
2- Consolidation between 8532-8548
3- Down moves in Bullish Falling Channel
4- Whole day actual trading between 8532-8570

Conclusions from intra day chart analysis 

Although some selling patterns were seen in last 2 sessions but higher levels consolidations was seen today therefore emergence of fresh rally expectations after last 31 sessions correction completion. Next resistances are as follows:-

1- 8558-8582
2- 8600-8616

Conclusions (After Putting All Studies Together)

'Pennant Pattern' broken out with huge gap on 15-01-2015 and higher levels consolidations was seen today therefore expected that rally will remain continued. As Short term Oscillators are Overbought and above mentioned resistances are lying just above today highest therefore some more consolidation is firstly required for fresh up moves above all time highest.
-----------------------------------
Intraday Levels and Trading Strategy 
For 20-01-2015 
-----------------------------------
For Intraday traders"Levels" and "Trading Strategy" are updated daily in the left of this Blog
For Intraday trading Policies- Just click on following "Topic link" and trade according to given "Levels" and "Trading Strategy":-

Technical Analysis and Market Outlook(19-01-2015)

Nifty-Intra Day Chart (16-Jan-2015):-
Just click on chart for its enlarged view
Technical Patterns and Formations in today intraday charts

1- Consolidation between 8455-8480
2- Up moves in Bearish Rising Channel
3- Down moves in Bullish Falling Channel
4- Mixed Patterns between 8507-8526
5- Whole day actual trading between 8453-8530

Conclusions from intra day chart analysis

Following lines were told on 15-01-2015 in "Most Bullish news led Strong Rally require Confirmation"

Last 3 hours trading between 8469-8527 and this range broken down therefore higher levels Profit Booking  will be considered and firstly sustaining above today highest should be watched for next up moves confirmations.

Profit booking was told between 8469-8527 and Nifty traded most time as well as closed within this range on 16-01-2015.

Although selling patterns formations were also seen on 16-01-2015 but Indian markets out performed Global cues in following manner:-

1- When all the Asian markets were in deep Red and Dow's Futures was trading more than 140 points down then at that time Nifty opened flat.
2- Most Indian Indices closed in Green despite Red closing of Most Asian markets 

Although Dow's Futures traded in deep Red during Indian trading hours but Dow Jones closed 190 points up last Friday and resultant SGX Nifty also closed 88 points up therefore sentiment may remain strong and gap up opening can not be ruled out next Monday. It should be kept in mind that both consolidation and selling patterns formations were seen between 8453-8530 in last 2 sessions therefore firstly sustaining beyond this range should be watched in the beginning of next week for next trend confirmations

As Waves structure suddenly changed after Repo Rate Cut by RBI and completely mixed patterns on intraday charts last Friday therefore firstly follow up moves and sustaining beyond 8453-8530 will be watched in the coming 1/2 sessions and then next decisive moves will updated after final conclusions.

Our Policy is:- "No gossiping never guessing and whatsoever market suggest,only that is always updated"
-----------------------------------
Intraday Levels and Trading Strategy 
For 19-01-2015 
-----------------------------------
For Intraday traders"Levels" and "Trading Strategy" are updated daily in the left of this Blog
For Intraday trading Policies- Just click on following "Topic link" and trade according to given "Levels" and "Trading Strategy":-