ॐ ह्रीं श्रीं लक्ष्मीभयो नमः॥


Trading "calls" from our "Software" with more than "90% accuracy"

More than "12 years" old "only site of whole world" 
with more than "9700 accurate Outlooks" of 
"Indian Stock Markets" 

Correction below 7961 and towards 7698/7637

Technical Analysis and Market Outlook(26-12-2014)

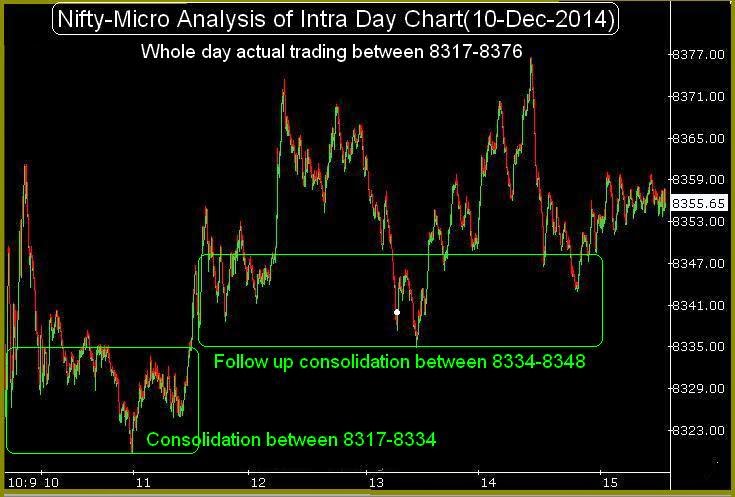
Nifty-Intra Day Chart (24-Dec-2014):-
Just click on chart for its enlarged view
Technical Patterns and Formations in today intraday charts

1- Selling between 8253-8286
2- Follow up selling between 8218-8256
3- Whole day actual trading between 8155-8286

Conclusions from intra day chart analysis 

Following lines were told yesterday in Technical Analysis and Market Outlook(24-12-2014):-

As last 3 hours trading between 8252-8294 with mixed Patterns formations therefore Nifty will firstly prepare for next moves within and near about this range  

As was told 100% same happened and Nifty firstly traded more than 2 hours as well as prepare for next decisive moves within mentioned range between 8253-8286 today.

Following lines were also told yesterday in Technical Analysis and Market Outlook(24-12-2014):-

1- Next supports(weaker) are between 8229-8251
2- once sustaining below 8229 will mean sharp fall.

We clearly told weaker supports and this support broken down forcefully after almost 3 hours follow up selling between 8218-8256.

Although Nifty closed near the top of the day on 22-12-2014 but we were not Bullish and told following conclusive lines in Technical Analysis and Market Outlook(23-12-2014):-

1- It should be kept in mind that Wave'B' is on and it should terminate below the top of Wave-5(8626.95)
2- Whenever intraday selling patterns will develop then that will be first signal of Wave'B' completion and Wave'C' beginning for fresh down moves below the lowest of Wave'A'(7961.35)

Wave'C' is on after good selling in last 2 sessions and same view which was told on 21-12-2014 in Correction Continuation Possibility below 7961.35

high possibility of down moves below 7961.35 

Wave'B' terminated at 8364 and Wave'C' is continued. Wave'A' corrected 666 points and  Wave'C' may also retrace 666 points therefore possibility of correction towards 7698(8364-666) can not be ruled out. Correction is on,Intermediate Term and Short Term Trends are down and testing of Long Term Trend decider 200-Day EMA(7637) is also possible because it is little below 7698.

Finally correction is very much on and its continuation is expected in the coming sessions.Until complete consolidation will not happen on EOD charts till then correction completion will not be considered.

Technical Analysis and Market Outlook(24-12-2014)

Nifty-Intra Day Chart (23-Dec-2014):-
Just click on chart for its enlarged view
Technical Patterns and Formations in today intraday charts

1- 2 Hours selling between 8346-8364
2- Last 3 hours trading between 8252-8294 with mixed Patterns formations (Down moves in Bullish Falling Channel at lower levels and minor selling patterns near 8294)
3- Whole day actual trading between 8252-8364

Conclusions from intra day chart analysis 

Following lines were told yesterday in Technical Analysis and Market Outlook(23-12-2014)

Next resistances are between 8320-8370 and Nifty closed within this range today,firstly sustaining it beyond should be watched tomorrow for Pull Back rally continuation/completion

Resistances are between 8320-8370 was told and Nifty could not move above 8370 as well as slipped below 8320 after follow up selling within mentioned resistance range. It should be kept in mind that resistances within 8320-8370 have been strengthened today because follow up selling within this range and until complete consolidation will not happen till then Nifty will not move above 8370.

As last 3 hours trading between 8252-8294 with mixed Patterns formations therefore Nifty will firstly prepare for next moves within and near about this range and sustaining beyond this range will be first strong indication of next decisive moves.

Next supports(weaker) are between 8229-8251 and finally sustaining beyond this range should be watched in the coming sessions and should be kept in mind that once sustaining below 8229 will mean sharp fall.

Technical Analysis and Market Outlook(23-12-2014)

Nifty-Intra Day Chart (22-Dec-2014):-
Just click on chart for its enlarged view
Technical Patterns and Formations in today intraday charts

1- Firstly more than 4 hours trading with mixed Patterns formations between 8229-8251
2- Forceful up moves after sharp 55 points jump of  Dow's Futures.
3- Whole day actual trading between 8229-8330

Conclusions from intra day chart analysis 

As strong Asian markets therefore positive opening and after that more than 4 hours trading with minor gains and mixed Patterns formations between 8229-8251 but sharp 55 points jump of  Dow's Futures at 01:20 PM and resultant Indian markets also moved up forcefully.

Selling between 8243-8263 last Friday and this range was crossed forcefully therefore Pull Back rally remain continued. Next resistances are between 8320-8370 and Nifty closed within this range today,firstly sustaining it beyond should be watched tomorrow for Pull Back rally continuation/completion. It should be kept in mind that Wave'B' is on and it should terminate below the top of Wave-5(8626.95). Whenever intraday selling patterns will develop then that will be first signal of Wave'B' completion and Wave'C' beginning for fresh down moves below the lowest of Wave'A'(7961.35)

Mid-session Outlook(22-12-2014)

As strong Asian markets therefore firstly positive opening and after that more than 4 hours trading with minor gains but sharp 55 points jump of  Dow's Futures was seen at 01:20 PM and resultant Indian markets also moved up sharply. Although on the back of strong Global cues but Nifty moved up forcefully above last Friday selling range(8243-8263) therefore Pull Back rally continuation will be seen.
Correction Continuation Possibility below 7961.35

Technical Analysis,Research & Weekly Outlook
(Dec 22 to Dec 26,2014)

Nifty-EOD Chart (19-Dec-2014):-
Just click on chart for its enlarged view
Technical Patterns and Formations in EOD charts:-

1- 5933.30 on 04-02-2014(Rally beginning after correction completion)
2- Wave-1(6869.85 on 25-04-2014)
3- Wave-2(6638.55 on 08-05-2014)
4- Wave-3(8180.20 on 08-09-2014)
5- Wave-4(7723.85 on 17-10-2014)
6- Wave-5(8626.95 on 04-12-2014) and 'ABC' correction beginning.
7- Wave'A' completion at 7961.35 on 17-12-2013
8- Wave'B' continuation with its recent top formation at 8263.45 on 19-12-2013 

Conclusions from EOD chart analysis

we told also following line on 12-05-2014 in Minimum target of  Nifty at 8616.90:-

Nifty is well set for rally towards minimum target at 8616.90. 

8616.90 was told 6 months before and Nifty made intraday highest at 8617 on 28-11-2014 as well as immediately corrected 666 points after forming life time high formation at 8626.95.

When Nifty formed all time high at 8616.90 on 04-12-2014 then at the top of rally we posted following bearish Outlook at 08:02 AM on 05-12-2014 in Technical Analysis and Market Outlook(05-12-2014):-

emergence of correction possibility which may be minimum Short Term to Intermediate term

As was told 100% same happened and Nifty corrected 666 points after ours above prediction.

Now Wave'B' of 'ABC' correction is on after 10 months strong 2693 points strong rally which started from 5933.30 on 04-02-2014 and ended after many times new life time high formation at 8626.95 on 04-12-2014 and Corrective Wave'A' begun which completed at 7961.35 on 17-12-2013. 

Nifty-Intra Day Chart (19-Dec-2014):-
Just click on chart for its enlarged view
Technical Patterns and Formations in today intraday charts

1- Selling(immediate Resistance) between 8243-8263
2- Whole day actual trading between 8209-8263

Conclusions from intra day chart analysis 

Gap up opening after strong Global cues but higher levels sliing patterns were formation were also seen therefore down moves below day's lowest(8209) are expected. As good selling seen therefore until complete consolidation will not be seen till then up moves above day's highest(8263) will not be seen.

Conclusions (After Putting All Studies Together)

'ABC' correction is confirm and if complete consolidation happens after completion of Wave'C' only then correction completion will be considered otherwise 5 Waves correction(1,2,3,4,5) will be seen in the coming weeks/months. As good selling on 19-12-2014 therefore if follow up selling develops in the beginning of next week then fresh down moves will be seen below the bottom of Wave'A'(7961.35) which will mean Wave'c' beginning after the completion of Wave'B'.

Correction is on and its continuation is expected in the beginning of next week because good selling at higher levels last Friday as well as high possibility of down moves below 7961.35 after completion of Wave'B' at 8263.45 on 19-12-2013.

Technical Analysis and Market Outlook(19-12-2014)

Nifty-Intra Day Chart (18-Dec-2014):-
Just click on chart for its enlarged view
Technical Patterns and Formations in today intraday charts

1- Consolidation between 8085-8115
2- Last 2 hours up moves with consolidations
3- Whole day actual trading between 8085-8174

Conclusions from intra day chart analysis 

Firstly lower levels consolidations after huge gap up opening and after that last 2 hours up moves with consolidations also therefore today started Pull Back Rally continuation will be seen tomorrow.

Technical Analysis and Market Outlook(18-12-2014)

Nifty-Intra Day Chart (17-Dec-2014):-
Just click on chart for its enlarged view
Technical Patterns and Formations in today intraday charts

1- Lower levels consolidations.
2- Down moves in Bullish Falling Channels
3- Whole day actual trading between 7961-8082

Conclusions from intra day chart analysis 

Firstly lower levels consolidations and after that up moves with consolidation pattern of down moves in Bullish Falling Channels therefore up moves in the form of Pull Back rally are expected tomorrow.

Technical Analysis and Market Outlook(17-12-2014)

Nifty-Intra Day Chart (16-Dec-2014):-
Just click on chart for its enlarged view
Technical Patterns and Formations in today intraday charts

1- Whole day slipping from higher levels
2- Down moves in Bullish Falling Channel


  1. Conclusions from intra day chart analysis 

Correction is on and and 1.85% slipping after most depressing Global markets cues yesterday. Although whole day slipping from higher levels but down moves in Bullish Falling Channel were also seen therefore only some up moves and Pull Back Rally will be considered at this moment.

Technical Position of Nifty is as follows:-

1- Long Term Trend is up,
2- Intermediate and Short Term Trends are down
3- Corrective Wave-A is on. Wave-B(upward) and Wave-C(below yesterday lowest) are still left.

It should be kept in mind that until complete consolidation will not happen on Daily Charts till then fresh rally will not be seen. As Indicators are oversold therefore Pull Back Rally or Wave-B(upward) will be seen after 2/3 days consolidation.  

Pre-open Outlook(16-12-2014)

As US markets and all the European markets closed in deep Red yesterday therefore all the Asian markets are trading in negative zone since opening today. Seems crashing like situation in all the Global markets therefore Indian markets will not be spared and resultant gap down opening will be seen. Correction is on and its continuation will be seen after such high Global markets pressure.

Technical Analysis and Market Outlook(16-12-2014)

Nifty-Intra Day Chart (15-Dec-2014):-
Just click on chart for its enlarged view
Technical Patterns and Formations in today intraday charts

1- Most time trading between 8204-8242 with down moves in Bullish Falling Channels within this range 
2- Whole day trading between 8153-8242

Conclusions from intra day chart analysis 

Although huge gap down opening after most depressing most Global markets but strong more than 50 points recovery in first 3 minutes and most time trading within 38 points between 8204-8242 with down moves in Bullish Falling Channels within this range therefore emergence of fresh up moves expectations tomorrow despite SGX Nifty is now trading 52 points down.

Technical Analysis and Market Outlook(15-12-2014)

Nifty-Intra Day Chart (12-Dec-2014):-
Just click on chart for its enlarged view
Technical Patterns and Formations in today intraday charts

1- Selling between 8309-8321 
2- Selling between 8278-8293
3- Down moves in Bullish Falling Channel
4- Whole day actual trading between 8273-8321

Conclusions from intra day chart analysis 

25 sessions trading between 8290-8627 with good selling at higher levels and this range was broken down but Nifty closed above 8290 on 11-12-2014. Firstly higher levels selling above 8290 and after that follow up selling near about 8290 as well as closing below it on 12-12-2014 which is first indication of 25 sessions trading range broken down. As almost last 3 hours down moves in Bullish Falling Channel therefore only Pull Back Rally possibility will be considered at this moment.

Short Term Trend is down and Intermediate Term Trend will turn down after confirmation of sustaining below 8390 which will mean down trend from 3 weeks to 3 months.Correction is on and until complete consolidation will not happen till then its completion will not be seen and that correction continuation will be considered for which we told in Technical Analysis and Market Outlook(05-12-2014).  

Technical Analysis and Market Outlook(12-12-2014)

Nifty-Intra Day Chart (11-Dec-2014):-
Just click on chart for its enlarged view
Technical Patterns and Formations in today intraday charts

1- Down moves in Bullish Falling Channel
2- Consolidation between 8273-8285
3- Up moves in Bearish Rising Channel
4- Selling between 8330-8348 
5- Whole day actual trading between 8273-8348

Conclusions from intra day chart analysis 

Following lines were told in Technical Analysis and Market Outlook(05-12-2014):-

1- emergence of correction possibility which may be minimum Short Term to Intermediate term.
2- deeper correction will be considered only after sustaining below 8290

Minimum Short Term to Intermediate term correction possibility was told on 05-12-2014 and since then continuous down moves seen in almost all the previous sessions. Importance of  8290 was also told and it was tested today as well as today closing is also near about it at 8292.90.

As highly volatile market with consolidation below 8290 and selling above it therefore today intraday patterns will be understood mixed and more follow up technical positions formations is firstly required for next decisive moves beyond today trading range. Sustaining beyond 8273-8348 should be firstly watched in the coming sessions for:-

1- Much deeper correction below 8273
2- First signal of correction completion above 8348(same level was given yesterday also and today highest is at 8348.30)

Technical Analysis and Market Outlook(11-12-2014)

Nifty-Intra Day Chart (10-Dec-2014):-
Just click on chart for its enlarged view
Technical Patterns and Formations in today intraday charts

1- Consolidation between 8317-8334
2- Follow up consolidation between 8334-8348
3- Whole day actual trading between 8317-8376

Conclusions from intra day chart analysis 

Firstly lower levels good consolidations but not sustaining at higher levels also therefore some more higher levels consolidations is firstly required for next decisive up moves above today highest.

Correction is on but Whole day Bullish Falling Channel formation yesterday and lower levels good consolidations also today therefore emergence of first signal of on going correction completion. As good selling at higher levels in previous weeks therefore more consolidation is required for fresh rally and new life time highest formations.

As consolidation between 8317-8348 today therefore sustaining beyond this range should be firstly watched tomorrow for:-

1- Correction continuation below 8317
2- First signal of on going correction completion above 8348

Technical Analysis and Market Outlook(10-12-2014)

Nifty-Intra Day Chart (09-Dec-2014):-
Just click on chart for its enlarged view
Technical Patterns and Formations in today intraday charts

1- Whole day down moves in Bullish Falling Channel
2- Whole day actual trading between 8330-8444

Conclusions from intra day chart analysis 

Although slipping 114 points from higher levels but whole day down moves in Bullish Falling Channel therefore only Pull Back rally will be considered at this moment because correction is on and its completion will be seen after complete consolidations.

Technical Analysis and Market Outlook(09-12-2014)

Nifty-Intra Day Chart (08-Dec-2014):-
Just click on chart for its enlarged view
Technical Patterns and Formations in today intraday charts

1- Selling between 8507-8546 in first 3 hours
2- Mixed Patterns between 8432-8466 in last 3 hours
3- Whole day actual trading between 8432-8546

Conclusions from intra day chart analysis 

Although Nifty closed 25 points up on 04-12-2014 after new life time high formation at 8626.95 but we told for correction in following lines in Technical Analysis and Market Outlook(05-12-2014)

1- emergence of correction possibility which may be minimum Short Term to Intermediate term
2-  It is confirm that once slipping and sustaining below 8527 will mean sharp down possibility. 

Only and only correction was told in previous both sessions Outlooks and Nifty closed:-

1- 25 points down on 05-Dec-2014
2- 100 points down on 08-Dec-2014

Minimum target of Nifty at 8616.90 was told on 12-05-2014 in following topic:-


Firstly Nifty achieved our target and then corrected 195 points after forming life time high at 8626.95 on 04-12-2014.

Although Nifty closed near the lowest of the day today after first 3 hours selling but mixed Patterns formations also seen between 8432-8466 in last 3 hours therefore firstly sustaining it beyond should be watched tomorrow because sufficient consolidation was also seen in last 3 hours today. 

Correction is on and only minor signal of its completion because mixed Patterns formations today therefore firstly follow up moves with sustaining beyond 8432-8466 must be watched tomorrow for deeper correction confirmations below 8432 and fresh rally after correction completion confirmations above 8466.

Technical Analysis and Market Outlook(08-12-2014)

Nifty-Intra Day Chart (05-Dec-2014):-
Just click on chart for its enlarged view
Technical Patterns and Formations in today intraday charts

1- Selling between 8567-8583 
2- Selling between 8557-8567 
3- Whole day actual trading between 8525-8583

Conclusions from intra day chart analysis 

we told also following line on 12-05-2014 in Minimum target of  Nifty at 8616.90:-

Nifty is well set for rally towards minimum target at 8616.90. 

8616.90 was told 6 months before and Nifty made intraday highest at 8617 on 28-11-2014

Following line was told at 08:02 AM on 05-12-2014 in Technical Analysis and Market Outlook(05-12-2014):-

emergence of correction possibility

As was told 100% same happened and Nifty closed -0.30% down after more than 3 hours positive zone trading but more than 5 hours follow up selling. 

Certainly correction is on and its continuation is expected as well as until complete consolidation will not happen till then correction will remain continued. 

Next possibilities with all crucial levels have already been updated in following topic on 05-12-2014,just go through following topic link and prepare yourself for coming sessions trading:-

Technical Analysis and Market Outlook(05-12-2014)

Nifty-Intra Day Chart (04-Dec-2014):-
Just click on chart for its enlarged view
Technical Patterns and Formations in today intraday charts

1- Most time trading between 8527-8578
2- Up moves in Bearish Rising Channel
3- Whole day actual trading between 8527-8626

Conclusions from intra day chart analysis 

All trends are up but Bearish Rising Channel formations in last 22 sessions between 8290-8627 and Oscillators are showing negative divergence also therefore emergence of correction possibility which may be minimum Short Term to Intermediate term. As Bull markets complete its correction within sideways markets therefore deeper correction will be considered only after sustaining below 8290.  

Although new life time high formation after huge gap up opening yesterday but slipping sharply also immediately after opening and most time trading between 8527-8578 with Up moves in Bearish Rising Channel therefore view will not be Bullish until complete consolidation will not be seen and Nifty will not sustain above 8578. It is confirm that once slipping and sustaining below 8527 will mean sharp down possibility. 

Last 8 sessions trading between 8430-8627 with following supports and resistances:-

1- Supports between 8430-8490(Strong supports)
2- Supports between 8506-8543(Weaker supports)
3- Resistances between 8590-8618(Strong resistances)

As forceful break out above 8618 will be next up move confirmation and sustaining below 8430 will be first strong signal of deeper correction therefore sustaining beyond 8430-8618 will be next decisive moves confirmation and should be firstly watched in the coming sessions. 
Sorry to say that I could not update the Blog yesterday  because I was extremely busy after the marriage of my son but It is confirm that regular updation of Blog will positively restart from tomorrow.
As marriage in our family therefore next Outlook will be updated on 03-12-2014

Technical Analysis and Market Outlook(27-11-2014)

Nifty-Intra Day Chart (26-Nov-2014):-
Just click on chart for its enlarged view
Technical Patterns and Formations in today intraday charts

1- Consolidation between 8438-8457
2- Mixed Patterns between 84381-8500
3- Whole day actual trading between 8439-8500

Conclusions from intra day chart analysis 

Following line was told at 01:09 on 26-11-2014 in Mid-session Outlook(26-11-2014):-

As lower levels good consolidation today therefore high possibility of trading above 8500

As was told 100% same happened and Nifty traded at 8500.30 yesterday

As lower levels good consolidation and higher levels mixed patterns formations were seen therefore lower levels good supports and higher levels weaker resistances will be understood. Although Nifty slipped from higher levels after good recovery from lower levels but clear selling patterns were not seen at higher levels therefore up moves hopes are alive after follow up consolidations in the coming sessions.

Very Short Term correction is on and emergence of  correction completion expectations also generated after lower levels consolidations yesterday. At present Nifty is sideways between 8439-8535 and will firstly trade/prepare within this range as well as  valid break out of this range will result next big moves.

Mid-session Outlook(26-11-2014)

As lower levels good consolidation today therefore high possibility of trading above 8500 after yesterday started correction completion.