| ||||||||||||||||
| ||||||||||||||||

ॐ ह्रीं श्रीं लक्ष्मीभयो नमः॥

FII & DII trading activity in Capital Market Segment on 08-Nov-2012
Indian Stock Markets Closing Reports(08-Nov-2012)
1- Benchmark Indices closed Red.
2- Quiet range bound trading whole day.
3- White Candle formation.
Ratios
Nifty Put Call Ratio: 0.83
Nifty P/E Ratio(08-Nov-2012): 17.97
Advances & Declines
BSE Advances : 1,340
BSE Declines : 1,494
NSE Advances : 642
NSE Declines : 811
Nifty Open Interest Changed Today
Nifty- 5500 CE(Nov)- -5,850(-0.76%)
Nifty- 5500 PE(Nov)- 286,800(5.15%)
Nifty- 5600 CE(Nov)- -170,950(-7.79%)
Nifty- 5600 PE(Nov)- -16,150(-0.23%)
Nifty- 5700 CE(Nov)- 599,700(17.30%)
Nifty- 5700 PE(Nov)- 257,050(3.73%)
Nifty- 5800 CE(Nov)- 661,350(11.45%)
Nifty- 5800 PE(Nov)- -93,900(-2.43%)
Nifty- 5900 CE(Nov)- 606,200(8.39%)
Nifty- 5900 PE(Nov)- -51,050(-4.25%)
Closing
Sensex- closed at 18,846.26(-56.15 Points & -0.30%)
Nifty- closed at 5,738.75(-21.35 Points & -0.37%)
CNX Midcap - closed at 7,966.75(19.65 Points & 0.25%)
CNX Smallcap- closed at 3,497.55(-1.60 Points & -0.05%)
Nifty Spot-Levels & Trading Strategy for 09-11-2012
R3 5808
R2 5776
R1 5757
Avg 5725
S1 5706
S2 5674
S3 5655
Nifty Spot-Trading Strategy
H6 5789 Trgt 2
H5 5777 Trgt 1
H4 5766 Long breakout
H3 5752 Go Short
H2 5747
H1 5742
L1 5733
L2 5728
L3 5723 Long
L4 5709 Short Breakout
L5 5698 Trgt 1
L6 5686 Trgt 2
Nifty(Nov Fut)-Levels & Trading Strategy for 09-11-2012
R3 5816
R2 5796
R1 5780
Avg 5760
S1 5744
S2 5724
S3 5708
Nifty(Nov Fut)-Trading Strategy
H6 5801 Trgt 2
H5 5792 Trgt 1
H4 5784 Long breakout
H3 5774 Go Short
H2 5771
H1 5768
L1 5761
L2 5758
L3 5755 Long
L4 5745 Short Breakout
L5 5737 Trgt 1
L6 5728 Trgt 2
Bank Nifty(Nov Fut)-Levels & Trading Strategy for 09-11-2012
R3 11849
R2 11787
R1 11735
Avg 11673
S1 11621
S2 11559
S3 11507
Bank Nifty(Nov Fut)-Trading Strategy
H6 11798 Trgt 2
H5 11772 Trgt 1
H4 11746 Long breakout
H3 11715 Go Short
H2 11704
H1 11694
L1 11673
L2 11663
L3 11652 Long
L4 11621 Short Breakout
L5 11595 Trgt 1
L6 11569 Trgt 2
Pre-Closing Outlook(08-11-2012)
Whole day 26 points quiet trading between 5716-5742 with lower levels supports but higher levels selling also. Sustaining beyond today trading range should be firstly watched tomorrow for next trend first indication beyond 31 sessions most trading range(5639-5733).
Mid-session Outlook(08-11-2012)
Last 4 hours trading between 5716-5742 with supports at lower levels. As could not sustain at intraday higher levels therefore today range break out will be watched for following next trend:-
1- Above 5733 will be emergence of next up trend hopes but subject to confirmation through sustaining it above.
3- Below 5733 will mean slipping into 31 sessions most trading range(5639-5733)
Post-open Outlook(08-11-2012)
Minor Up moves after gap down opening and now trading near next trend decider(5733). As intraday selling seen above 5733 yesterday therefore fresh consolidation is required to sustain above yesterday highs(5777) and follow up selling today will mean re-entering into previous 31 sessions sideways trading range.
Let follow up moves develop and market prepare for next direction then forthcoming moves will be discussed according to intraday charts formations.
Let follow up moves develop and market prepare for next direction then forthcoming moves will be discussed according to intraday charts formations.
Technical Analysis and Market Outlook(08-11-2012)
Nifty-Intra Day Chart (07-Nov-2012):-
Technical Patterns and Formations in today intraday charts
1- Last 4 hours trading between 5752-5777 with intraday selling patterns at higher levels between 5764-5777.
2- Whole day actual trading between 5711-5777.
Nifty traded most time between 5639-5733 in 30 previous seessions and this range broken out today after the victory news of President Obama but intraday selling was also seen at higher levels between 5764-5777 today. As intraday selling today therefore following lines were told in Pre-Closing Outlook today:-
"Sideways sessions trading range broken out today but its confirmation is still left,let it happen then next trend will be decided because intraday selling patterns also seen at higher levels today"
US markets did not welcomed Obama victory and now all Benchmark Indices are more than 2.5% down today, such weaker closing will mean possibility of negative Asian markets tomorrow and resultant Weak opening possibility in Indian markets.
Expected that Nifty will trade below 5733 tomorrow but 30 previous sessions range break out above 5733 today therefore firstly sustaining it beyond should be watched tomorrow for next trend confirmation.
 |
| Just click on chart for its enlarged view |
1- Last 4 hours trading between 5752-5777 with intraday selling patterns at higher levels between 5764-5777.
2- Whole day actual trading between 5711-5777.
Conclusions from intra day chart analysis
Nifty traded most time between 5639-5733 in 30 previous seessions and this range broken out today after the victory news of President Obama but intraday selling was also seen at higher levels between 5764-5777 today. As intraday selling today therefore following lines were told in Pre-Closing Outlook today:-
"Sideways sessions trading range broken out today but its confirmation is still left,let it happen then next trend will be decided because intraday selling patterns also seen at higher levels today"
US markets did not welcomed Obama victory and now all Benchmark Indices are more than 2.5% down today, such weaker closing will mean possibility of negative Asian markets tomorrow and resultant Weak opening possibility in Indian markets.
Expected that Nifty will trade below 5733 tomorrow but 30 previous sessions range break out above 5733 today therefore firstly sustaining it beyond should be watched tomorrow for next trend confirmation.
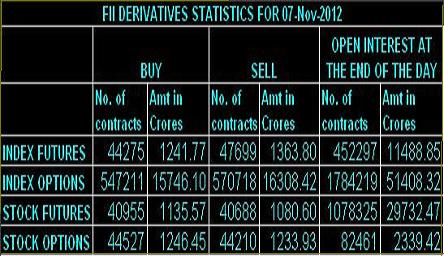
FII & DII trading activity in Capital Market Segment on 07-Nov-2012
| ||||||||||||||||
| ||||||||||||||||
Indian Stock Markets Closing Reports(07-Nov-2012)
1- All the Indices closed in Green except CNX ENERGY.
2- Up moves after Obama victory news but profit booking at higher levels also.
3- Break out of 30 sessions trading range and closing above.
4- White Candle formation.
Ratios
Nifty Put Call Ratio: 0.94
Nifty P/E Ratio(07-Nov-2012): 17.92
Advances & Declines
BSE Advances : 1,675
BSE Declines : 1,211
NSE Advances : 885
NSE Declines : 542
Nifty Open Interest Changed Today
Nifty- 5500 CE(Nov)- -72,600(-8.62%)
Nifty- 5500 PE(Nov)- 817,900(16.55%)
Nifty- 5600 CE(Nov)- -34,000(-1.52%)
Nifty- 5600 PE(Nov)- 206,600(2.86%)
Nifty- 5700 CE(Nov)- -407,550(-10.46%)
Nifty- 5700 PE(Nov)- 1,443,600(25.93%)
Nifty- 5800 CE(Nov)- 322,150(5.57%)
Nifty- 5800 PE(Nov)- 1,385,000(53.39%)
Nifty- 5900 CE(Nov)- 267,400(3.76%)
Nifty- 5900 PE(Nov)- 613,300(101.44%)
Closing
Sensex- closed at 18,902.41(85.03 Points & 0.45%)
Nifty- closed at 5,760.10(35.70 Points & 0.62%)
CNX Midcap - closed at 7,947.10(77.95 Points & 0.99%)
CNX Smallcap- closed at 3,499.15(31.90 Points & 0.92%)
Nifty Spot-Levels & Trading Strategy for 08-11-2012
R3 5853
R2 5815
R1 5787
Avg 5749
S1 5721
S2 5683
S3 5655
Nifty Spot-Trading Strategy
H6 5826 Trgt 2
H5 5811 Trgt 1
H4 5796 Long breakout
H3 5778 Go Short
H2 5772
H1 5766
L1 5753
L2 5747
L3 5741 Long
L4 5723 Short Breakout
L5 5708 Trgt 1
L6 5693 Trgt 2
Nifty(Nov Fut)-Levels & Trading Strategy for 08-11-2012
R3 5902
R2 5860
R1 5826
Avg 5784
S1 5750
S2 5708
S3 5674
Nifty(Nov Fut)-Trading Strategy
H6 5869 Trgt 2
H5 5852 Trgt 1
H4 5834 Long breakout
H3 5813 Go Short
H2 5806
H1 5799
L1 5786
L2 5779
L3 5772 Long
L4 5751 Short Breakout
L5 5733 Trgt 1
L6 5716 Trgt 2
Bank Nifty(Nov Fut)-Levels & Trading Strategy for 08-11-2012
R3 12039
R2 11917
R1 11825
Avg 11703
S1 11611
S2 11489
S3 11397
Bank Nifty(Nov Fut)-Trading Strategy
H6 11950 Trgt 2
H5 11901 Trgt 1
H4 11851 Long breakout
H3 11792 Go Short
H2 11773
H1 11753
L1 11714
L2 11694
L3 11675 Long
L4 11616 Short Breakout
L5 11566 Trgt 1
L6 11517 Trgt 2
Pre-Closing Outlook(07-11-2012)
Last 4 hours trading between 5752-5777 with intraday selling patterns at higher levels therefore more consolidation is required tomorrow for sustaining above 5733/5777. 30 Sideways sessions trading range broken out today but its confirmation is still left,let it happen then next trend will be decided because intraday selling patterns also seen at higher levels today.
Mid-session Outlook(07-11-2012)
As trading above 5733 was expected therefore its detailed analysis was updated yesterday. News based market today and now sustaining above 5733 should be firstly watched for next strong rally confirmations.
Post-open Outlook(07-11-2012)
Nifty traded most time between 5639-5733 in last 30 sessions but once this range was broken down after RBI Credit Policy on 30-10-2012 and today broken out after Obama victory in US Predential Elections.
As sentiment and trading positions reverses sharply after news based Broken out/down therefore its confirmation is must through sustaining beyond and its filters have already been updated yesterday in following topic:-
Technical Analysis and Market Outlook(07-11-2012)
Firstly get confirmations and then expect next trend accordingly.
Technical Analysis and Market Outlook(07-11-2012)
Nifty-Intra Day Chart (06-Nov-2012):-
Technical Patterns and Formations in today intraday charts
1- Consolidation and supports at lower levels between 5698-5710
3- Whole day actual trading between 5698-5729
Conclusions from intra day chart analysis
As soon as consolidation started in Indian markets today then it was immediately updated at 10:16AM in Post-open Outlook(06-11-2012) and following line was told:-
"intraday consolidation patterns seen today in first hour of trading"
Nifty closed at the top of last 30 sideways sessions with lower levels intraday supports and consolidations,next 3 resistances of ongoing Wave-3 are as follows:-
1- 5733
2- 5756
3- 5815
As resistances between 5700-5733 were strong therefore once sustaining above 5733 will be strong indication of rally after correction completion. Trading above 5733 is expected tomorrow but follow up consolidations and sustaining it above is must. Following technical confirmation is must therefore following 2 filters have to be watched first:-
1- 3 Days sustaining above the previous sideways trading range top(5733) or
2- Minimum 3% up moves from the high(5733) of the previous sideways trading range.
Forceful break out or Once sustaining above 5733 will mean clearance of strong resistance and then high possibility of fresh rally after correction completion.
 |
| Just click on chart for its enlarged view |
1- Consolidation and supports at lower levels between 5698-5710
3- Whole day actual trading between 5698-5729
Conclusions from intra day chart analysis
As soon as consolidation started in Indian markets today then it was immediately updated at 10:16AM in Post-open Outlook(06-11-2012) and following line was told:-
"intraday consolidation patterns seen today in first hour of trading"
Nifty closed at the top of last 30 sideways sessions with lower levels intraday supports and consolidations,next 3 resistances of ongoing Wave-3 are as follows:-
1- 5733
2- 5756
3- 5815
As resistances between 5700-5733 were strong therefore once sustaining above 5733 will be strong indication of rally after correction completion. Trading above 5733 is expected tomorrow but follow up consolidations and sustaining it above is must. Following technical confirmation is must therefore following 2 filters have to be watched first:-
1- 3 Days sustaining above the previous sideways trading range top(5733) or
2- Minimum 3% up moves from the high(5733) of the previous sideways trading range.
Forceful break out or Once sustaining above 5733 will mean clearance of strong resistance and then high possibility of fresh rally after correction completion.
Indian Stock Markets Closing Reports(06-Nov-2012)
1- Benchmark Indices closed with marginal gains.
2- All the Indices closed in Green except AUTO and IT.
3- White Candle formation.
Ratios
Nifty Put Call Ratio: 0.80
Nifty P/E Ratio(06-Nov-2012): 17.92
Advances & Declines
BSE Advances : 1,469
BSE Declines : 1,355
NSE Advances : 943
NSE Declines : 806
Nifty Open Interest Changed Today
Nifty- 5500 CE(Nov)- -33,300(-3.80%)
Nifty- 5500 PE(Nov)- -50,200(-1.01%)
Nifty- 5600 CE(Nov)- -149,050(-6.26%)
Nifty- 5600 PE(Nov)- 460,250(6.80%)
Nifty- 5700 CE(Nov)- -457,750(-10.51%)
Nifty- 5700 PE(Nov)- 600,400(12.09%)
Nifty- 5800 CE(Nov)- 519,650(9.87%)
Nifty- 5800 PE(Nov)- 630,950(32.14%)
Closing
Sensex- closed at 18,817.38(54.51 Points & 0.29%)
Nifty- closed at 5,724.40(20.20 Points & 0.35%)
CNX Midcap - 7,869.15closed at (29.30 Points & 0.37%)
CNX Smallcap- closed at 3,467.25(29.50 Points & 0.86%)

Subscribe to:
Posts (Atom)