ॐ ह्रीं श्रीं लक्ष्मीभयो नमः॥


Trading "calls" from our "Software" with more than "90% accuracy"

More than "12 years" old "only site of whole world" 
with more than "9700 accurate Outlooks" of 
"Indian Stock Markets" 

Mid-session Outlook(07-03-2012)

Intermediate and Short term trends are already down in ongoing correction. Long term trend is up and its decising most crucial range(5120-5190) has been tested today, this range is containing little above and within it following crucial levels:

1- 38.2% Retracement Level- 5209
2- 55-Day EMA - today at 5201
3- 200-Day EMA- today at 5188
4- 200-Day SMA- today at 5165

Above 3 levels have been tested today. Correction is on and sustaining below 5120 will be Long term trend turning down confirmations. Down moves are continued and let it stop  and consolidations/base formations start then beginning of correction completion will be considered.

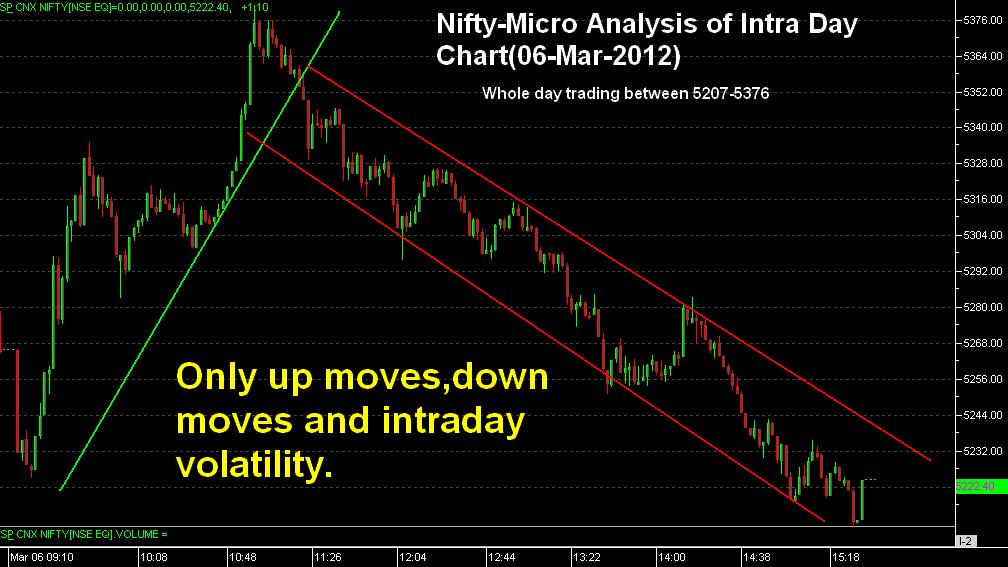
Nifty is trading between 5185-5243 today with higher levels selling therefore more down moves possibilities can not be ruled out.

More down moves & Long Term Trend at stake

Whatsoever happen today all that was clearly projected in following lines on 03-03-2012:-

"negative results for Congress will certainly badly hamper sentiment therefore coming sessions may be highly volatile and follow up selling after any nervous news may result slipping below 5340/5268 also"

Crucial Supports in Assembly Election Results Week

Just click above topic link for verification of our above projection and following most crucial points also:-

1- All the supports of Dec 2011 rally.
2- Long tern  trend deciding levels
3- Importance of next support range 5120-5190.
4- For most crucial levels within 5120-5190.

Nifty-Intra Day Chart(06-Mar-2012):-
Just click on chart for its enlarged view
Technical Patterns and Formations in today intraday charts

1- Only up moves,down moves and intraday volatility.
2- Closing at the lowest of the day.
3- Whole day trading between 5207-5376.

Conclusions

Main features of today trading:-

1- Highy volatile markets after gap down opening.
2- Sharp surgees and declines according to Congress prospects after Assembly Elections Results declarations.
3- Reflection of Congress dismal performance through closing at the lowest of the day.
4- Intermediate term trend turning down confirmations through sustaining below 5340.
5- Breaking down of 7 days sessions range.

More down moves are expected in the coming sessions and those  supports ranges which has already been updated on  on 03-03-2012.

Indian Stock Markets Closing Reports(06-Mar-2012)

Main features of today trading are as follows

1-Highly volatile markets in Assembly Elections results day.
2- Most of the Indices closed in Red including Benchmark Indices.
3- Black Candle today.

Ratios

Nifty Put Call Ratio: 1.09
Nifty P/E Ratio(06-Mar-2012): 18.51

Advances & Declines

BSE Advances : 1010
BSE Declines : 1820
NSE Advances :  408
NSE Declines : 1040

Nifty Open Interest Changed Today

Nifty- 5100 CE(Mar)- +174650(+19.09%)
Nifty- 5100 PE(Mar)- +321800(+6.75%)

Nifty- 5200 CE(Mar)- +314450(+12.94%)
Nifty- 5200 PE(Mar)- -447800(-5.61%)

Nifty- 5300 CE(Mar)- +426400(+15.43%)
Nifty- 5300 PE(Mar)- +288100(+4.88%)

Nifty- 5400 CE(Mar)- +656100(+18.19%)
Nifty- 5400 PE(Mar)- -139800(-3.66%)

Closing 

Nifty- closed at 5,222.40(-57.95 Points & -1.10%)
Sensex- closed at 17,128.28(-189.58 Points & -1.09% )
CNX Midcap - closed at 7,468.00(-61.50 Points & -0.82%)
BSE Smallcap- closed at 6,700.19(-87.51 Points & -1.29%)

FII Trading Data in Derivatives Segment on 06-Mar-2012


FII Trading Data in Derivatives Segment on 06-Mar-2012

FII trading activity on NSE and BSE in Capital Julket Segment(In Rs. Crores)
CategoryDateBuy ValueSell ValueNet Value
FII06-Mar-20122629.952871.17 -241.22


DII trading activity on NSE and BSE in Capital Julket Segment(In Rs. Crores)
CategoryDateBuy ValueSell ValueNet Value
DII06-Mar-20121238.121058.21179.91

Nifty Spot-Levels & Trading Strategy for 07-03-2012

Nifty Spot-Levels

R3 5510
R2 5446
R1 5334
Avg 5270
S1 5158
S2 5094
S3 4982

Nifty Spot-Trading Strategy

H6 5398      Trgt 2
H5 5358     Trgt 1
H4 5318    Long breakout
H3 5270     Go Short
H2 5254
H1 5238
L1 5205
L2 5189
L3 5173    Long
L4 5125     Short Breakout
L5 5085     Trgt 1
L6 5045     Trgt 2

Nifty(Mar Fut)-Levels & Trading Strategy for 07-03-2012

Nifty(Mar Fut)-Levels

R3 5570
R2 5499
R1 5374
Avg 5303
S1 5178
S2 5107
S3 4982

Nifty(Mar Fut)-Trading Strategy

H6 5446     Trgt 2
H5 5402     Trgt 1
H4 5357    Long breakout
H3 5303     Go Short
H2 5285
H1 5267
L1 5232
L2 5214
L3 5196    Long
L4 5142     Short Breakout
L5 5097     Trgt 1
L6 5053     Trgt 2                                                                                                                                                                     

Bank Nifty(Mar Fut)-Levels & Trading Strategy for 07-03-2012

Bank Nifty(Mar Fut)-Levels

R3 10881
R2 10706
R1 10410
Avg 10235
S1 9939
S2 9764
S3 9468

Bank Nifty(Mar Fut)-Trading Strategy

H6 10587     Trgt 2
H5 10480     Trgt 1
H4 10373    Long breakout
H3 10243     Go Short
H2 10200
H1 10157
L1 10070
L2 10027
L3  9984    Long
L4  9854   Short Breakout
L5  9747    Trgt 1
L6  9640    Trgt 2

Pre-Closing Outlook(06-03-2012)

Today intraday moves were according to Congress expectations during Assembly Elections results day. When intial results trend indicated gains for Congress then up moves were seen but as soon as results confirmed the defeat of Congress then markets started to tumble down and Market is more than 1% down.

5267-5322 has been broken down and Intermediate term trend turning down confirmations also therefore more down moves are expected. As down moves possibility was alive therefore following topic was updated on 03-03-2012:-


Just click above topic Link and understand all the crucial support levels.

Mid-session Outlook(06-03-2012)

Highly volatile markets during Assembly Election Results day,Nifty is trading between yesterday trading range(5267-5322) at this moment and importance of this range have already been discussed in previous outlook.

It was expected that on going correction will complete now fresh up moves will start after correction completion and increase in Congress strength but market could not sustain at higher levels after confirmation of Punjab defeat and no role in U.P. Govt. formations.

Tough to understand the change of Technical positions during such high volatility therefore next moves and fate of Intermediate term trend will get confirmations through:-

1- Sustaining beyond yesterday trading range(5267-5322) for first indication.
2- Sustaining beyond intermediate term trend decider 5340 for final confirmations.

Live Proofs of our 100% accurate projections and Guidance during Assembly results

Post-open Outlook(06-03-2012)

Indian markets more than 1.00% down immediately after opening today and then more than 1 % up within first half hour today and proved ours following projections 100% accurate:-

In Pre-Closing Outlook(05-03-2012) at 02:59PM yesterday:-

A- strong indication of intermediate term trend turning down and high possibility of more down moves to text next support levels.
B-Indian markets are prepared for more down moves in the coming sessions.

2- In Technical and Assembly results implications Analysis yesterday

A- Technically Intermediate term trend turning down strong indication
B- technically high possibility of more down moves to test next support levels in the coming sessions
C- Indian markets are technically prepared for more down moves in the coming sessions.

High volatility today but we told following lines yesterday;-

1- Assembly results uncertainty led volatility can not be ruled out tomorrow
2- in such situations technical positins reverses also therefore sustaining beyond today trading range(5267-5322) should be firstly watched for next moves confirmations.
3- Indian markets will only be effected by Congress conclusive gains/loss and change of dependence on other parties.

Highly Volatile market today and technical positins reverses also in such situations therefore following levels should be firstly watched:-

1- Sustaining beyond yesterday trading range(5267-5322) for first indication.
2- Sustaining beyond intermediate term trend decider 5340

Long term trend is up Short term trend is down and correction completion/continuation through survival of intermediate term trend will be decided through sustaining beyond above levels and should be firstly watched.

Expected that no fresh up moves will start after correction completion  today.

Technical and Assembly results implications Analysis For 06-03-2012

Nifty-Intra Day Chart(05-Mar-2012):-
Just click on chart for its enlarged view
Technical Patterns and Formations in today intraday charts

1- Selling between 5305-5322
2- Minor intraday support between 5267-5280
3- Whole day trading between 5267-5322

Conclusions from intra day chart analysis 

Technically Intermediate term trend turning down strong indication through:-

Continuous Whole day down moves below intermediate term trend decider 5340 today with intraday selling patterns immediately after opening between 5305-5322 today

Although minor intraday support between 5267-5280 today but good selling at higher levels therefore technically high possibility of more down moves to test next support levels in the coming sessions. As down moves possibility was alive therefore following topic was updated on 03-03-2012:-


Just click above topic link and prepare for trading after understanding all crucial levels

Assembly results Uncertainity led volatility can not be ruled out tomorrow and in such situations technical positins reverses also therefore sustaining beyond today trading range(5267-5322) should be firstly watched for next moves confirmations.

Indian markets will only be effected by Congress conclusive gains/loss and change of dependence on other parties. As it may trigger next trend also therefore implications of Assembly results should be understood under this purview also because it may also give final confirmation to the 7 sessions struggling Intermediate term trend.

If anything miraculous come out from Assembly results tomorrow then any up moves will be expected otherwise Indian markets are technically prepared for more down moves in the coming sessions.

FII & DII trading activity in Capital Market Segment on 05-Mar-2012


Indian Stock Markets Closing Reports(05-Mar-2012)

Main features of today trading are as follows

1- Long Black Candle.
2- All the Indices closed in Red except FMCG.
3- whole day down moves after weak opening.

Ratios

Nifty Put Call Ratio: 0.95
Nifty P/E Ratio(05-Mar-2012): 18.71

Advances & Declines

BSE Advances :  952
BSE Declines : 1899
NSE Advances :  412
NSE Declines : 1044

Nifty Open Interest Changed Today

Nifty- 5200 CE(Mar)- +381950(+18.28%)
Nifty- 5200 PE(Mar)- +996150(+13.41%)

Nifty- 5300 CE(Mar)- +807100(+39.52%)
Nifty- 5300 PE(Mar)- +348750(+5.30%)

Nifty- 5400 CE(Mar)- +488900(+15.30%)
Nifty- 5400 PE(Mar)- +175650(+4.78%)

Nifty- 5500 CE(Mar)- +440200(+10.34%)
Nifty- 5500 PE(Mar)- -13900(-0.46%)

Closing 

Nifty- closed at 5,280.35(-79.05 Points & -1.47%)
Sensex- closed at 17,362.87(-274.12 Points & -1.55% )
CNX Midcap - closed at 7,529.50(-125.95 Points & -1.65%)
BSE Smallcap- closed at 6,787.70(-65.39 Points & -0.95%)

FII & DII trading activity in Capital Market Segment on 05-Mar-2012

FII trading activity on NSE and BSE in Capital Julket Segment(In Rs. Crores)
CategoryDateBuy ValueSell ValueNet Value
FII05-Mar-20121867.041741.54125.5


DII trading activity on NSE and BSE in Capital Julket Segment(In Rs. Crores)
CategoryDateBuy ValueSell ValueNet Value
DII05-Mar-2012827.421085.75-258.33

Nifty Spot-Levels & Trading Strategy for 06-03-2012

Nifty Spot-Levels

R3 5406
R2 5375
R1 5327
Avg 5296
S1 5248
S2 5217
S3 5169

Nifty Spot-Trading Strategy

H6 5359     Trgt 2
H5 5341     Trgt 1
H4 5323     Long breakout
H3 5301     Go Short
H2 5294
H1 5287
L1 5272
L2 5265
L3 5258     Long
L4 5236     Short Breakout
L5 5218     Trgt 1
L6 5200     Trgt 2

Nifty(Mar Fut)-Levels & Trading Strategy for 06-03-2012

Nifty(Mar Fut)-Levels

R3 5447
R2 5412
R1 5365
Avg 5330
S1 5283
S2 5248
S3 5201

Nifty(Mar Fut)-Trading Strategy

H6 5400     Trgt 2
H5 5381     Trgt 1
H4 5363     Long breakout
H3 5340     Go Short
H2 5333
H1 5325
L1 5310
L2 5302
L3 5295    Long
L4 5272     Short Breakout
L5 5254     Trgt 1
L6 5235     Trgt 2

Bank Nifty(Mar Fut)-Levels & Trading Strategy for 06-03-2012

Bank Nifty(Mar Fut)-Levels

R3 10717
R2 10605
R1 10423
Avg 10311
S1 10129
S2 10017
S3 9835

Bank Nifty(Mar Fut)-Trading Strategy

H6 10536     Trgt 2
H5 10469     Trgt 1
H4 10402     Long breakout
H3 10321     Go Short
H2 10294
H1 10267
L1 10214
L2 10187
L3 10160     Long
L4 10079     Short Breakout
L5 10012     Trgt 1
L6  9945    Trgt 2

Pre-Closing Outlook(05-03-2012)

Whole day trading below intermediate term trend decider 5340 today with intraday selling patterns today means strong indication of intermediate term trend turning down and high possibility of more down moves to text next support levels.

If anything miraculous come out from tomorrow Assembly results then expect any up move otherwise Indian markets are prepared for more down moves in the coming sessions.

Mid-session Outlook(05-03-2012)


Intraday selling patterns between 5305-5322 today. 

Post-open Outlook(05-03-2012)

All Asian markrets are in Red and some are more than 1% down therefore Red zone trading after weak opening today. Assembly results season today because market is reacting exit poll results today and tomorrow will react on achual results therefore volatility may be high and sustaining it beyond 5298 should be firstly watched for next decisive big move confirmations.