ॐ ह्रीं श्रीं लक्ष्मीभयो नमः॥


Trading "calls" from our "Software" with more than "90% accuracy"

More than "12 years" old "only site of whole world" 
with more than "9700 accurate Outlooks" of 
"Indian Stock Markets" 

Correction confirmation of 2012 Rally

Nifty-EOD Chart(24-Feb-2012):-
Just click on chart for its enlarged view
Technical Patterns and Formations in EOD charts

1- Up moves in rising channel.
2- 1098.80 Nifty Points rally in 45 sessions
2- Rising channel broken down.

Conclusions from EOD chart analysis 

2012 Strong rally in  rising channel and its Correction confirmation through rising channel broken down.

All 7 Supports of 2012 Rally

Nifty-EOD Chart(24-Feb-2012):-
Just click on chart for its enlarged view
All 7 Supports of 2012 Rally

1- Strong support and base formation between 4532-4670
2- Minor support between 4590-4640
3- Strong support between 4680-4760
4- Support between 4810-4900
5- Minor support between 4992-5068
6- Support between 5120-5190
7- Strong support between 5340-5415

One Resistance of 2012 Rally

1- Resistance through 3 days selling between 5588-5625

Conclusions from EOD chart analysis 

Nifty got support through consolidation in 7 ranges and staged 1098.80 Points run away rally in 45 sessions. Now correction is on after 3 days good selling between 5588-5625 and market requires complete consolidation for fresh rally. It is confirm that Nifty will get support at any one of above support ranges and breaking down of a support range will mean fast down move toward next support therefore above support ranges can be used for long trades after fresh consolidation confirmations and for shorting after formations of distribution patterns within any of above mentioned ranges.

Immediate Strong Supports and Resistances

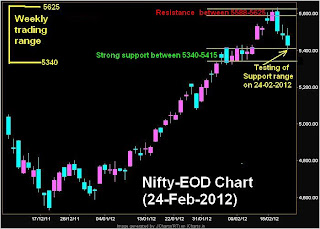
Nifty-EOD Chart(24-Feb-2012):-
Just click on chart for its enlarged view
Technical Patterns and Formations in EOD charts

1- Resistance through 3 days selling between 5588-5625
2- Strong support between 5340-5415
3- Testing of Support range on 24-02-2012
4- Weekly trading range 5340-5625

Conclusions from EOD chart analysis 

Correction commenced after good selling between 5588-5625 therefore complete consolidation is required to cross 5625 and in the same manner strong supports also between 5340-5415 therefore complete distribution is must for slipping below 5340.  Although Nifty tested mentioned support range and closed above it but both supports and resistances both are sufficiently strong and market require complete preparation for breaking out of these 2 Resistance/support ranges.

Expected that Nifty will firstly trade minimum 2/3 sessions between 5340 and 5625 and prepare for next moves and sustaining below 5340 will mean deeper correction after breaking down of strong support ranges,sustaining above 5625 will mean strong rally after correction completion.

FII Trading Data in Derivatives Segment on 24-Feb-2012


FII & DII trading activity in Capital Market Segment on 24-Feb-2012

FII trading activity on NSE and BSE in Capital Julket Segment(In Rs. Crores)
CategoryDateBuy ValueSell ValueNet Value
FII24-Feb-201211138.592183.298955.3


DII trading activity on NSE and BSE in Capital Julket Segment(In Rs. Crores)
CategoryDateBuy ValueSell ValueNet Value
DII24-Feb-20121055.991892.7-836.71

Indian Stock Markets Closing Reports(27-Feb-2012)

Main features of today trading are as follows

1- All the Indices closed in Red except IT,Metals and FMCG.
2- Black Candle formation.
3- Testing of crucial supports below 5460.

Ratios

Nifty Put Call Ratio:1.17
Nifty P/E Ratio(24-Feb-2012):19.02

Advances & Declines

BSE Advances : 1086
BSE Declines :  1832
NSE Advances : 462
NSE Declines :  997

Nifty Open Interest Changed Today

Nifty- 5400 CE(Feb)- +127550(+7.75%)
Nifty- 5400 PE(Feb)- +504900(+14.31%)

Nifty- 5500 CE(Feb)- +702900(+27.01%)
Nifty- 5500 PE(Feb)- +235250(+8.02%)

Nifty- 5600 CE(Feb)- +374400(+14.71%)
Nifty- 5600 PE(Feb)- -37000(-2.69%)

Closing 

Nifty- closed at 5,429.30(-54 Points & -0.98%)
Sensex- closed at 17,923.57(-154.93 Points & -0.86% )
CNX Midcap - closed at 7,588.30(-57.85 Points & -0.76%)
BSE Smallcap- closed at 6,857.04(-48.85 Points & -0.71%)

Nifty Spot-Levels & Trading Strategy for 27-02-2012

Nifty Spot-Levels

R3 5614
R2 5567
R1 5498
Avg 5451
S1 5382
S2 5335
S3 5266

Nifty Spot-Trading Strategy

H6 5545     Trgt 2
H5 5519     Trgt 1
H4 5492     Long breakout
H3 5460     Go Short
H2 5450
H1 5439
L1 5418
L2 5407
L3 5397     Long
L4 5365     Short Breakout
L5 5338     Trgt 1
L6 5312     Trgt 2

Nifty(Mar Fut)-Levels & Trading Strategy for 27-02-2012

Nifty(Mar Fut)-Levels

R3 5656
R2 5610
R1 5548
Avg 5502
S1 5440
S2 5394
S3 5332

Nifty(Mar Fut)-Trading Strategy

H6 5595     Trgt 2
H5 5571     Trgt 1
H4 5546     Long breakout
H3 5516     Go Short
H2 5506
H1 5496
L1 5477
L2 5467
L3 5457     Long
L4 5427     Short Breakout
L5 5403     Trgt 1
L6 5378     Trgt 2

Bank Nifty(Mar Fut)-Levels & Trading Strategy for 27-02-2012

Bank Nifty(Mar Fut)-Levels

R3 11155
R2 11006
R1 10807
Avg 10658
S1 10459
S2 10310
S3 10111

Bank Nifty(Mar Fut)-Trading Strategy

H6 10959     Trgt 2
H5 10879     Trgt 1
H4 10799     Long breakout
H3 10703     Go Short
H2 10671
H1 10639
L1 10576
L2 10544
L3 10512     Long
L4 10416     Short Breakout
L5 10336     Trgt 1
L6 10256     Trgt 2

Nifty Spot-Weekly Levels & Trading Strategy(Feb 27 to Mar 02,2012)

Nifty Spot-Weekly Levels

R3 5796
R2 5713
R1 5571
Avg 5488
S1 5346
S2 5263
S3 5121

Nifty Spot-Weekly Trading Strategy 

H6 5655     Trgt 2
H5 5603     Trgt 1
H4 5552     Long breakout
H3 5490     Go Short
H2 5470
H1 5449
L1 5408
L2 5387
L3 5367     Long
L4 5305     Short Breakout
L5 5254     Trgt 1
L6 5203     Trgt 2

Bank Nifty Spot-Weekly Levels & Trading Strategy(Feb 27 to Mar 02,2012)

Bank Nifty Spot-Weekly Levels

R3 11802
R2 11514
R1 11010
Avg 10722
S1 10218
S2 9930
S3 9426

Bank Nifty Spot-Weekly Trading Strategy 

H6 11303     Trgt 2
H5 11122     Trgt 1
H4 10941     Long breakout
H3 10723     Go Short
H2 10651
H1 10578
L1 10433
L2 10360
L3 10288     Long
L4 10070     Short Breakout
L5 9889     Trgt 1
L6 9708     Trgt 2

Pre-Closing Outlook(24-02-2012)

Following lines were told yesterday in Correction is on & Bulls Watching Next Supports

more down moves possibilities have turned higher and testing of following supports can not be ruled out:-
1- 5428-5461(Gap Support)
2- 5340-5415(Strong support)

Above both supports have been tested today and proved our above projection 100% accurate.

All the Global markets are in Green But Indian markets are under performing and in Red as well as traded most time between Gap Support range(5428-5461) today. Higher levels selling seen after lower levels minor support but breaking down of 5428 is without force also therefore higher levels selling and lower levels buying signals also.

Strong support between 5340-5415 and supports signals above it therefore sustaining beyond today range(5406-5460) will be firstly  watched in next week for the confirmation of correction continuation/completion.

Firstly Watch 5428-5461 (Gap Support)

Mid-session Outlook(24-02-2012)

Following line was told yesterday which proved 100% accurate today after more than .85% down moves today:-

"more down moves possibilities have turned higher"

Just click following topic link and verify our above projection:-

Correction is on & Bulls Watching Next Supports 

Following first support was yesterday in above topic:-

1- 5428-5461(Gap Support)

Nifty is trading within above support for the last 2 hours after forming low at 5428.05. Minor intraday support pattern seen at lower levels today but lot of consolidation and base formation is reuqired for completion of correction. As minor support within mentioned Gap Support therefore sustaining beyond this range will be firstly watched today for next very short term move confirmation.

Correction is on & Bulls Watching Next Supports

Technical Analysis,Researches & Market Outlook (24-02-2012)

Nifty-Intra Day Chart(23-Feb-2012):-
Just click on chart for its enlarged view
Technical Patterns and Formations in today intraday charts

1- Selling between 5545-5517.
2- Down moves in falling channel.
3- Falling channel broken out.
4- Up moves in rising channel.
5- Selling between 5514-5537.
6- Rising channel broken down.
7- Whole day trading between 5461-5538.

Conclusions from intra day chart analysis 

Following 2 technical positions have been updated previously in Weekly Outlook(Feb 21 to Feb 24,2012)and now being repeated:-

1- 61.8% Retracement level at 5648
2- Crucial resistance is between 5600-5700

Selling between 5588-5625 in 3 previous sessions(17-02-2012 to 22-02-2012) and its confirmation through sharp fall seen on 22-02-2012. As mentioned selling has been just below 61.8% Retracement level and within mentioned resistance range therefore it has been strenghtened as well as resistance at 61.8% Retracement level has been validated. 

Very short term correction is on and intraday selling seen at higher levels today also therefore more down moves possibilities have turned higher and testing of following supports can not be ruled out:-

1- 5428-5461(Gap Support)
2- 5340-5415(Strong support)

Sufficient and strong evidences of correction therefore complete consolidation is required to cross recent resistance(5588-5625) and until Nifty will not sustain above 5625 till then next up move will not be considered. As Nifty has to correct  whole 1099 Nifty points rally therefore more down moves possibility can not be ruled out and Support range of 5340-5415 will be next hope for Bulls because it is strong support range.

FII Trading Data in Derivatives Segment on 23-Feb-2012


FII & DII trading activity in Capital Market Segment on 23-Feb-2012

FII trading activity on NSE and BSE in Capital Julket Segment(In Rs. Crores)
CategoryDateBuy ValueSell ValueNet Value
FII23-Feb-20124069.923965.37104.55


DII trading activity on NSE and BSE in Capital Julket Segment(In Rs. Crores)
CategoryDateBuy ValueSell ValueNet Value
DII23-Feb-20121453.72094.63-640.93

Indian Stock Markets Closing Reports(23-Feb-2012)

Main features of today trading are as follows

1- Benvhmark Indices closed in Red.
2- Doji Candle formation.
3- Record volume in 77 Nifty points range bound market.

Ratios

Nifty Put Call Ratio:1.13
Nifty P/E Ratio(23-Feb-2012):19.21

Advances & Declines

BSE Advances : 1103
BSE Declines :  1784
NSE Advances : 456
NSE Declines :  1005

Nifty Open Interest Changed Today

Nifty- 5400 CE(Feb)- -303550(-24.42%)
Nifty- 5400 PE(Feb)- +3702350(+54.39%)

Nifty- 5500 CE(Feb)- +2114600(+43.01%)
Nifty- 5500 PE(Feb)- -1629150(-34.97%)

Nifty- 5600 CE(Feb)- +2071550(+33.52%)
Nifty- 5600 PE(Feb)- -3312000(-72.83%)

Closing 

Nifty- closed at 5,483.30(-22.05 Points & -0.40%)
Sensex- closed at 18,078.50(-66.75 Points & -0.37% )
CNX Midcap - closed at 7,646.15(-30.65 Points & -0.40%)
BSE Smallcap- closed at 6,905.89(-63.17 Points & -0.91%)

Nifty Spot-Levels & Trading Strategy for 24-02-2012

Nifty Spot-Levels

R3 5603
R2 5570
R1 5526
Avg 5493
S1 5449
S2 5416
S3 5372

Nifty Spot-Trading Strategy

H6 5560     Trgt 2
H5 5542     Trgt 1
H4 5525     Long breakout
H3 5504     Go Short
H2 5497
H1 5490
L1 5475
L2 5468
L3 5461     Long
L4 5440     Short Breakout
L5 5423     Trgt 1
L6 5405     Trgt 2

Nifty(Mar Fut)-Levels & Trading Strategy for 24-02-2012

Nifty(Mar Fut)-Levels

R3 5673
R2 5632
R1 5585
Avg 5544
S1 5497
S2 5456
S3 5409

Nifty(Mar Fut)-Trading Strategy

H6 5627     Trgt 2
H5 5607     Trgt 1
H4 5587     Long breakout
H3 5563     Go Short
H2 5555
H1 5547
L1 5530
L2 5522
L3 5514     Long
L4 5490     Short Breakout
L5 5470     Trgt 1
L6 5450     Trgt 2

Bank Nifty(Mar Fut)-Levels & Trading Strategy for 24-02-2012

Bank Nifty(Mar Fut)-Levels

R3 11178
R2 11061
R1 10936
Avg 10819
S1 10694
S2 10577
S3 10452

Bank Nifty(Mar Fut)-Trading Strategy

H6 11055     Trgt 2
H5 10999     Trgt 1
H4 10944     Long breakout
H3 10877     Go Short
H2 10855
H1 10833
L1 10788
L2 10766
L3 10744     Long
L4 10677     Short Breakout
L5 10622     Trgt 1
L6 10566     Trgt 2

Pre-Closing Outlook(23-02-2012)

For today trading guidance following topic was posted at 11:16:00AM today:-

Firstly watch today sustaining beyond 5482-5519

Nifty hovered around above range whole day and now trading at 5485 after forming top at 5537.40 and bottom at 5460.80.

Intraday patterns are mixed today and sustaining beyond today trading range will give correction continuation/completion confirmation.